HAL Id: hal-01141490
https://hal-univ-rennes1.archives-ouvertes.fr/hal-01141490
Submitted on 4 Nov 2015HAL is a multi-disciplinary open access
archive for the deposit and dissemination of sci-entific research documents, whether they are pub-lished or not. The documents may come from teaching and research institutions in France or abroad, or from public or private research centers.
L’archive ouverte pluridisciplinaire HAL, est destinée au dépôt et à la diffusion de documents scientifiques de niveau recherche, publiés ou non, émanant des établissements d’enseignement et de recherche français ou étrangers, des laboratoires publics ou privés.
Evidencing the chemical degradation of a hydrophilized
pes ultrafiltration membrane despite protein fouling
Murielle Rabiller-Baudry, Aurélie Bouzin, Charlène Hallery, Jean Girard,
Cindy Leperoux
To cite this version:
Murielle Rabiller-Baudry, Aurélie Bouzin, Charlène Hallery, Jean Girard, Cindy Leperoux. Evidencing the chemical degradation of a hydrophilized pes ultrafiltration membrane despite protein fouling. Separation and Purification Technology, Elsevier, 2015, 147, pp.62-81. �10.1016/j.seppur.2015.03.056�. �hal-01141490�
1
EVIDENCING THE CHEMICAL DEGRADATION OF A HYDROPHILIZED PES ULTRAFILTRATION MEMBRANE DESPITE PROTEIN FOULING
Murielle RABILLER-BAUDRY*, Aurélie BOUZIN, Charlène HALLERY, Jean GIRARD, Cindy LEPEROUX
1-Université de Rennes 1, « Institut des Sciences Chimiques de Rennes » UMR-CNRS 6226, 263 avenue du Général Leclerc, CS 74205, case 1011, 35042 Rennes cedex, France
Corresponding author: murielle.rabiller-baudry@univ-rennes1.fr
KEYWORDS
PES, PVP, ultrafiltration, proteins, ageing, hypochlorite, FTIR-ATR
ABSTRACT
Hydrophilisation of polyethersulfone (PES) based membrane is often achieved by addition of polyvinylpyrrolidone (PVP) leading to a physical blend of the two polymers. This paper shows that the most commonly used membrane for UF in dairy industry is a PES/PVP based one. Nevertheless if hydrophilisation limits the organic fouling, PVP is also the Achilles heel of these membranes. It is particularly true when membranes are exposed to hypochlorite as it is the case for cleaning/disinfection steps. Evidencing the disappearance of PVP from a pristine PES/PVP membrane can be easily achieved by FTIR-ATR analyses. But when one wants to study the ageing of a membrane used in UF it gets more complicated: regardless of the cleaning efficiency the membrane always remains fouled by some proteins. As both PVP and proteins own chemical bounds leading to absorption at the same wavenumber in FTIR-ATR, it thereby prevents the easy highlighting of the PVP degradation. The aim of this paper is to propose a simple treatment of raw FTIR-ATR spectra to dissociate these two contributions, allowing consequently the study of the degradation of a fouled membrane. Then the procedure is applied to a real case study on a spiral membrane.
2
1. INTRODUCTION
Fouling systematically occurs during ultrafiltration (UF) as it is observed when filtering skim milk by spiral membranes based on polyethersulfone (PES, Figure 1) [1-4]. The membrane composition is of course an important parameter as the physico-chemical interactions between the skim milk components and the membrane material play a crucial role on the membrane global fouling [5]. In fact, PES membranes also contained a minor amount of additives that are added to increase the membrane hydrophilic character, but generally these additives are not clearly mentioned by the membrane providers. Polyvinylpyrrolidone (PVP) (Figure 1) is one of the most famous used additive and it is quite logical to suspect its presence in a hydrophilised PES membrane. But it must generally be proved as it will be done in this study as preliminary investigation (see results).
Nowadays, it is quite well understood that hydrophilisation limits the membrane fouling by organic compounds such as proteins. Nevertheless, it is also known that PVP is the Achilles heel of these membranes. This is particularly true when they are exposed to sodium hypochlorite (NaOCl) as it is the case for daily cleaning/disinfection steps at industrial scale.
To go ahead in the understanding in PES/PVP membrane stability, several teams working in membrane food or water applications have chosen to study variations of flux and selectivity after immersion of pristine membranes in various NaOCl solutions. For such purposes they used more or less complex degradation protocols [2, 6, 8-22].
Dealing with the membrane material degradation, in our opinion one of the most comprehensive fundamental results is obtained by infra-red analyses (FTIR). Infra-red spectroscopy is a technique only able to evidence polar bounds existing in polymers. Nevertheless it must be underlined that these studies are achieved on pristine membranes that were voluntary aged in sodium hypochlorite solutions, the pH of which is generally set in the range 8.0 – 9.0. NaOCl disinfecting solutions having such pHs are known to be lead to severe degradation of PES/PVP membranes [see for instance 18, 19 and references cited herein]). In the case of PES/PVP membranes a special attention must be paid to an absorption band of the FTIR-ATR spectrum located close to a wavenumber at 1661 cm-1 and attributed to the C=O amide bound of PVP. To put it in a nutshell, the PVP C= O bound progressively disappears during the membrane ageing provoked by NaOCl treatments. Figure 2 shows one
3 of the mechanism suggested in literature to explain the C=O disappearance that can be understood as the opening of the PVP ring. This is significantly different from a total removal of the PVP or of its degradation compounds.
Moreover, another band located at 1030 cm-1 progressively appears on the FTIR-ATR spectrum and is commonly attributed to an evolution of the PES skeleton itself. Nevertheless there is still controversy about the exact meaning of this band, sometimes assigned to a sulfonic acid group (SO3H, Figure 3a, [14]) and recently to a phenol formation (OH on phenyl ring, Figure 3b, [18]). It is out of the scope of this paper to discuss the validity of these two proposal and in the following we will only discuss degradation of PES skeleton evidenced by the 1030 cm-1 band without any other comments.
To show the evolution of the PES skeleton is quite easy on an aged membrane that have been used at industrial scale because no band overlapping have been evidenced with the fouling (Figure 4) and the 1030 cm-1 is a pure signal revealing the PES degradation. For a more detailed presentation of the membrane used at industrial scale and called here “Membrane U” see [1].
The disappearance of PVP from a pristine PES/PVP membrane can be easily achieved by FTIR-ATR analysis, but only a single band can be used for this purpose: those located at 1661 cm-1. But when one wants to study the ageing of a membrane used in UF it gets more complicated because of the presence of fouling as it will be explained below.
Dealing with PES/PVP membranes fouled during UF of skim milk, it must be underlined that only a part of the whole fouling is irreversible (not removed by a simple water rinsing) and this part is known to be made of proteins only, in the particular case of organic membranes
[3-4]. This irreversible protein deposit represents the target of the cleaning/disinfecting operation
that immediately follows the production step. Classically, at industrial scale, organic UF membranes fouled by skim milk are cleaned according to a procedure involving a cascade of 3 solutions set at 50°C: alkaline cleaning at pH 11.5/12.0 with a formulated detergent containing surfactants, then acid cleaning generally with nitric acid at pH 1.6 and finally an alkaline and chlorine disinfecting step using sodium hypochlorite (bleach) set at 150-200 ppm in total free chlorine (TFC) [1, 3, 4]. In our previous studies we have explained how such a cascade can be simplified by the cancellation of the acid step [7]. Nevertheless for food security purposes it is not possible to withdraw the disinfecting step. Physico-chemical
4 analyses of such industrial membranes autopsied at the end of their service life highlight presence of a residual protein fouling even after a final cleaning procedure [1].
Proteins own a specific bound called “amide I” (C=O vibration of the amide group, -CO-NH) that is superimposed to the PVP C=O bound (the only one that can be used to deal with the PVP degradation). Consequently, an analytical difficulty must be overcome when fouling is made of proteins (Figure 5) to unambiguously evidence modifications of the membrane due to fouling occurrence or to membrane material degradation or a combination of the two. So in this paper we propose an approach to treat a FTIR-ATR spectrum in order to dissociate the contributions of PVP and proteins to the global band obtained on the raw spectrum of a fouled membrane. For the demonstration pristine membranes at 3 degradation states are prepared and fouled with proteins. Then the methodology is applied to the analysis of a spiral membrane (6.7 m2) used at laboratory scale alternatively in UF of skim milk and UF of sodium hypochlorite aiming at evidencing a possible heterogeneity of the membrane degradation with respect to the distribution of fouling in this complex geometry.
2. THEORETICAL PART
On the FTIR-ATR spectra of a PES/PVP pristine membrane (here HFK-131 membrane) all bands can be assigned to PES except that located at 1661 cm-1 which can be attributed to the C=O bound of PVP. Figure 4 shows the attributions in the 1770-700 cm-1 range that is the range of interest for the following discussion. For sake of comparison, the spectrum of a membrane already used at industrial scale (Membrane U) is also given. Membrane U is at the end of its service life that corresponds to 8,000 h of skim milk UF. A final and very efficient cleaning has been performed before the FTIR-ATR spectrum registration. As explained in the introduction, clearly the PVP C=O band has disappeared and the new 1030 cm-1 band has appeared on the spectrum.
However, when the membrane is fouled by milk proteins and when the cleaning is not sufficiently efficient to remove the proteins from the membrane, the PVP C=O band and the amide I band of proteins are overlapped. This analytical difficulty would be more and more frequent with the membrane ageing because the fouling tends to increase with the membrane age and the cleanability seems to decrease accordingly. Figure 5 shows the raw spectra obtained for a pristine membrane and for a protein fouled one. If the protein deposit is very
5 high (see results) then an aged and fouled membrane can exhibit a C=O band of greater intensity than that of the pristine membrane itself. Consequently it becomes impossible to deal with a possible degradation of PVP from the membrane without any treatment of the FTIR-ATR spectrum.
We propose to establish a mathematical treatment of the spectrum in order to dissociate the contribution of these two C=O bands. Moreover, this paper aims at developing a simple approach that can be applied without any sophisticated and costly software able to perform band deconvolution.
Proteins also lead to a second characteristic absorption band called amide II band that corresponds to the superimposition of vibrations due to CN+NH bounds of the amide group.
Knowing that the protein amide II band, located close to 1539 cm-1, have no overlapping with the pristine membrane bands, neither PES nor PVP, we have already developped a method of quantification of proteins directly on the HFK-131 membrane. This analysis is based on the H1539 protein amide II / H1240 PES ratio (with HiX: band height corresponding to the absorbance intensity at a given i wavenumber (wi) and corresponding to X material or functional group) [4].
The first step of the approach proposed in this paper is based on the simple fact that on a fouled membrane, absorption measured at 1661 cm-1 (H1661 raw spectrum) corresponds to the superimposition of absorbance due to PVP (H1661 PVP ) and absorbance due to protein amide I vibration (H1661protein amide I):
H1661 raw spectrum = H 1661 PVP+ H 1661protein amide I (eq. 1)
The new idea of this paper consists in the determination of the protein amide I intensity at 1661 cm-1 (H1661 protein amide I) from that of the amide II band (H1539 protein amide II).
As mentioned previously, these two bonds belong to the same amide group, namely N-C =O, but correspond to different vibration modes. Consequently it is not creasy to imagine that the intensity of the two FTIR bands of the amide group of proteins are correlated. Assuming this idea, we have tried to evidence the possible relationship between the two heights of these bounds without any other assumption. The experimental developments detailed in the results
6 show that the relationship between the two heights exists. Moreover experimental results evidence that, regardless of the chosen protocol, the relationship is linear (see below). For sake of simplification the general form of this relationship is consequently given as that of a straight line (equation 2).
H1661 protein amide I = α x H1539protein amide II + β (eq. 2)
Where α and β are coefficients to be determined.
A main bottleneck of the approach is the experimental determination of α and β. In the results we will discuss two experimental approaches to determine these coefficients. One is based on spectra acquired for proteins in aqueous solutions. The other involved treatment of spectra acquired with more or less aged membranes on which controlled protein deposit are made. It is explained in the results why only one of these two approaches can be validated.
The second key point is the experimental validation of equation 3 that can be easily drawn from the previous ones.
H1661 raw spectrum / H 1240PES= (H 1661 PVP / H 1240PES )+ (H 1661protein amide I /H 1240PES ) (eq. 3)
It requires having PES/PVP membranes with various amount of PVP. In this paper we have used pristine and aged membranes specially prepared to cover a wide range of membrane degradation up to a PVP height divided by two with respect to its initial height.
Figure 6 summarizes the global approach.
3. EXPERIMENTAL
3.1.1. Water, skim milk and solutions
Water used either for solution preparation and membrane rinsing is deionised and 1 µm filtered. Its conductivity is always lower than 1 µS.cm-1.
7 The skim milk used is a commercial one (UHT, Lait de Montagne, Carrefour, France) containing an average of 32 g.L-1 proteins and 48 g.L-1 carbohydrates (mainly lactose) and only traces of lipids (< 0.5 %).
Protein solutions are prepared from a powder containing whey proteins (PS90 Protarmor, Saint Brice en Coglès, France) dissolved in deionised water. A set of 6 concentrations is used: 0, 5, 10, 20, 30 and 50 g.L-1.
NaOCl solutions at 400 ppm in total free chlorine (TFC) are prepared from commercial bleach solution provided by Lacroix (eau de Javel, bleach at 96,000 ppm TFC, France). The pH is adjusted to 8.0 ± 0.1 by addition of HCl of analytical grade (Acros).
A formulated alkaline solution, namely P3-ultrasil 10 provided by Ecolab (Issy les Moulineaux, France) is used for membrane cleaning. It is set at 4 g.L-1 that corresponds to a natural pH of 12.0.
3.1.2. Membranes
The membrane used is named HFK-131. It is a UF membrane provided by Koch (USA) and commonly used at industrial scale for UF of skim milk and of both acid and rennet whey. This membrane represents about 70 % of the world market for these specific applications. It is a PES based membrane of 5-10 kg mol-1molecular weight cut off according to the provider.
We have studied this membrane to prove that it is a PES/PVP one. Among experimental data allowing to draw this conclusion are:
(i) the presence of the 1661 cm-1 band on the FTIR-ATR spectra (Figure 4, Figure 5). Moreover, we had also checked that the HFK-131 spectrum is similar to that of a dense film we had prepared, that was made from PES and PVP physical blend (95/5) [6].
(ii) the presence of nitrogen evidenced by nano-SIMS measurements (Figure 7). SIMS is only able to evidence nitrogen atoms bounded to carbon further called organic nitrogen (CN group).
8 3.1.2.1. Spiral membrane
The spiral membrane is chosen in order to have a filtering area of several square meters (6.7 m2, 4333 K131 VYV module). The membrane (further called CIP-3, KMS K131V 8879759136) is made of 4 double sheets of membranes wounded around a permeate collector tube of 33 inches length as schematically explained in Figure 8.
3.1.2.2. Flat membrane coupons: fouling of pristine and aged membranes
Several flat membranes of 127 cm2 (or sometimes less) are sampled in a second pristine spiral membrane (further called cut-CIP-1). These membrane coupons are used for FTIR-ATR analyses performed to validate the methodological approach explained in the theoretical part. Prior to be used these samples are carefully rinsed in water to remove the preservative (the rinsing efficiency is systematically checked by FTIR-ATR).
- Ageing of membrane coupons
The ageing protocol is inspired from the one established in our laboratory and already described in [6]. Six membrane coupons (6 cm x 3 cm) are soaked in a NaOCl solution set at 400 ppm TFC and pH 8.0 (V= 26.3 mL, surface/volume = 14.6 L.m-2) under micro-waves (pulsed microwaves at 255 W) during 210 or 480 min. The micro-waves help to accelerate the chemical degradation when compared to simple soaking in the same solution. Thus depending on the treatment duration different ageing states are reached; it is shown from the PVP C=O height decrease. In order to avoid impact of NaOCl concentration during the ageing process, the NaOCl solution has been regularly replaced by a similar volume of a fresh solution. Some characteristics of aged membranes are given Table 1.
- Protein fouling of membrane coupons
The protocol is the same when using pristine and aged membranes. A membrane coupon (3 cm x 6 cm) is immersed under gentle stirring at room temperature in 100 mL of a protein solution during 2 h. Proteins are set at different concentrations (0, 5, 10, 20, 30 and 50 g.L-1). After dripping, membranes are carefully dried in a desiccator under dynamic vacuum.
9 ATR spectrum is registered on each dried coupon before and after the protein deposition. Protein quantification is achieved using equation 4 (see below). The amount of proteins on obtained deposit are shown Table 1 for the pristine membrane and the two aged membranes.
3.1.3. UF with the spiral membrane
3.1.3.1.Skim milk UF
A pristine spiral membrane is installed on a pilot provided by TIA (TIA 3093, Bollène, France) and already described in [24]. The fouling of the spiral membrane is achieved by UF of 24 L of skim milk at 50°C in batch mode at volume reduction ratio VRR= 1 , meaning here that both the retentate and the permeate are fully recycled in the feed tank. During UF the feed flow rate is constant. It is set at 9.5 m3.h-1 that corresponds to a cross-flow velocity of about 0.3 m.s-1.
The transmembrane pressure (TMP) is regularly increased from 1.5 bar at start to 4.0 bar at the end of the UF run. This last TMP value allows to reach the limiting flux. Each TMP increase is achieved when a plateau value of flux is reached at the previous TMP. The UF duration is close to 5.5 h for one UF run. The membrane flux (J) is followed all over the skim milk UF.
The average TMP is classically calculated as the mean value when considering the membrane inlet and outlet TMPs. Nevertheless, it must be kept in mind that the pressure drop along the membrane element is 2.2 bar regardless of the average TMP. This is not a negligible value by comparison to the average TMP itself. In the following an estimation of the local TMP is made considering a linear pressure drop along the membrane element, according to a calculation proposed in [23].
At the end of skim milk UF, the membrane is extensively rinsed by water. Then it is cleaned at 2 bar, 50°C during 1 h by 25 L of P3-ultrasil 10 formulated solution. This protocol allows the water flux recovery of the pristine membrane.
10 In order to accelerate the spiral membrane ageing, UF of sodium hypochlorite solution at 400 ppm TFC and pH 8.0 is performed at 2.0 bar and 50°C. The treatment duration can vary and is summarized as a cumulative dose of hypochlorite expressed according to equation 5.
NaOCl dose membrane exposition (ppm.d) = 400 ppm x number of days (eq. 4)
From a practical point of view, 3 UF of skim milk are consecutively performed on the pristine membrane. After alkaline cleaning the membrane is then aged in NaOCl up to a cumulative dose of 400 ppm.d. Then another UF of skim milk is performed. After a second alkaline cleaning the membrane is aged in NaOCl up to a cumulative dose of 2,000 ppm.d. Then another UF of skim milk is performed. After cleaning the membrane is aged up to a cumulative dose of 2,800 ppm.d and a final skim milk UF is performed. Finally, the membrane is carefully rinsed by water but not cleaned. Then the membrane is autopsied.
According to the provider this membrane is guaranteed up to a 5,000 ppm.d NaOCl dose but nothing is clearly explained about the way to reach this dose. Nevertheless, we can suggest that the autopsied CIP-3 membrane could be equivalent to a membrane close to half time of a normal service life at industrial scale.
3.1.4. FTIR-ATR on membranes for protein quantification purpose
The membrane samples are carefully dried under dynamic vacuum before registration to remove water (systematically checked in the 3500 cm-1 region).
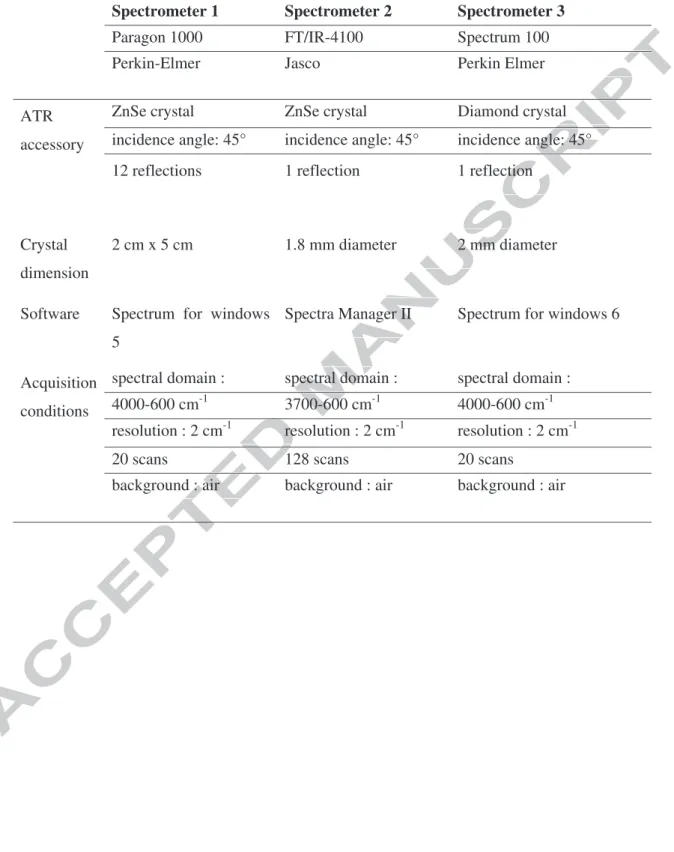
For sake of generalization, three different FTIR-ATR spectrometers have been used in this study. Their characteristics are shown in Table 2 as well as the standard conditions used for spectra acquisition. It has been checked that the spectra acquired on each spectrometer are similar when dealing with the wavenumbers but the raw intensity of each band is different. This is probably due to differences in the ATR-accessory crystal (chemical nature and reflection number). Nevertheless it has also been checked that the relative ratio of two band heights (for instance: Hi/H1240 PES) are the same regardless of the spectrometer used (see
11 3.1.4.1.Quantification of residual proteins directly on membranes
The initial calibration has been established with spectrometer 1 [3, 4, 6] but as explained above can be used with spectrometer 2 (see Figure A1 in Appendix 1) and spectrometer 3. The quantification is possible in a wide range of fouling from 1 to 350 µg of proteins per square centimetre of membrane (geometric area) with a precision of 1 µg.cm-2 (equation 4). 19 samples of fouled pristine membranes have been used to establish the equation, allowing to reach r2 = 0.997.
H1539protein amide II/ H1240PES – H2060-2240baseline = 0.0034 [P] (eq. 4)
With:
[P]: the protein concentration in µg.cm-2
HiX: band height corresponding to the absorbance intensity at a given wavenumber (wi) and corresponding to X material or functional group. (see Appendix 1).
H2060-2240baseline : the average height of the baseline measured in the 2060-2240 cm-1 range of wavenumbers. Value equal to 0.0165.
- Specific procedure for the spiral membrane
After the final fouling by skim milk up to 4.0 bar and rinsing by deionised water, the spiral membrane (CIP-3, 6.7 m2) has been cut in 324 pieces of about 127 cm2 area each.
Each flat sample is then analyzed with spectrometer 1. Only the spectrum of the sample center is registered. Nevertheless, each 127 cm2 sample could be divided in 9 smaller pieces of about 10 cm2 (corresponding to the ZnSe crystal area), but it has been checked on a whole membrane sheet of about 1 m2 that the variations are not significant and that a single result seems quite acceptable for the followed purpose.
This autopsy allows establishing firstly the mapping of the irreversible fouling and secondly that of the degradation state of the membrane by the mean of measurements at 1661 cm-1 (PVP) and 1030 cm-1 (PES skeleton).
12 The small flat membrane coupons have been analyzed with spectrometer 2. It was used to establish the protocol exposed in the theoretical part above.
3.1.5. FTIR-ATR on membranes for evidencing of membrane degradation
Firstly the spectrum of each membrane coupon, in pristine form, is registered. Thus H1240PES and H1661PVP is measured allowing the calculation of the H1661PVP/H1240PES ratio for each sample.
Secondly, some membrane coupons are submitted to a more or less intensive ageing procedure according to the protocols described in paragraph 3.1.2. Then the spectrum of each aged membrane coupon is registered. Thus H1240PES and H1661PVP is measured allowing the calculation of the H1661PVP/H1240PES ratio for each sample before fouling. Of course it has been checked that the PVP band is modified when compared to that measured before the ageing treatment. These values obtained after ageing are then used as reference values to be compared to values obtained after fouling on aged membranes.
Finally, membranes are fouled with protein solutions according to the protocol described in paragraph 3.1.2. FTIR-ATR spectra are then registered and H1661raw spectra, H1240PES and H1661protein amide II are determined for the registered spectrum of each membrane coupon after fouling allowing the acquisition of the raw spectra of aged then fouled membranes.
The following ratios, H1661 raw spectra/H1240PES and H1661protein amide II/H1240PES can easily be deduced. Then H1661 protein amide I/H1240PES of the fouled membrane is drawn from equation 3 with the H1661 raw spectra/H1240PES ratio of the fouled membrane and the H1661PVP/H1240PES ratio of the same coupon before fouling.
Finally the H1661 protein amide I/H1661protein amide II ratio is obtained from the (H1661 protein amide I/H
1240PES) to (H1661 protein amide II/H1240PES) ratio.
3.1.6. FTIR-ATR on protein solutions
13 The obtained spectrum of a solution (Protein raw spectrum) is the superimposition of the water spectrum and of the protein one. But because the main component of a protein solution is water that have a band located at 1637 cm-1 which overlaps the amide I band of proteins, a treatment of the raw spectrum is needed to put in evidence amide I and amide II bands of proteins (Equation 6, see Appendix 2 for details). After treatment the spectrum is called Protein difference spectrum
Protein difference spectrum = Protein raw spectrum - γ water spectrum (eq. 6) With:
γ: coefficient to be determined for each protein spectrum. The determination of γ is based on the cancellation of the OH band of water located close to 3300 cm-1. There is no significant overlapping of the 3300 cm-1 water band with protein bands in this region, because unsaturated C-H bonds of proteins are located below 3000 cm-1. The determination of γ is the result of tests and errors with different values close to 1.000 with the objective to obtain a a region close to 3300 cm-1 as flat as possible in the Protein difference spectrum that is the considered criterion to prove the quality of the spectrum treatment. Moreover, for similar reason, the 2300-1800 cm-1 region must also be as flat as possible on the difference spectrum (see Appendix 2 for details). From a practical point of view, in this study γ slightly varies around 0.8 ± 0.2.
4. RESULTS AND DISCUSSION
4.1. FTIR-ATR study of estimation of protein amide I band from protein amide II band
As already explained the first bottleneck of the procedure (Figure 6) consists in the estimation of protein amide I intensity from that of protein amide II on the FTIR-ATR spectrum. Two approaches have been tested that are detailed in the following.
4.1.1. Proteins in solution
Spectra of 1 µL of several protein solutions have been registered with spectrometer 2. Spectra have then been post-treated according to the procedure described in paragraph 3.1.6.
14 The results evidence that the H1661protein amide I / H1539 protein amide II ratio decreases linearly with protein concentration according to equation 7.
H1661protein amide I / H1539 protein amide II = - 0.06 x [P’] + 3.6 with r2= 0.95 (eq. 7)
With:
[P’] the concentration of proteins in g.L-1
This linear trend suggests a structural evolution of proteins with dilution.
4.1.2.Proteins adsorbed on flat membrane
Spectra of voluntary aged and fouled membrane coupons have been registered with spectrometer 1. Then spectra have been post-treated according to the procedure described in paragraph 3.1.5.
Table 3, Table 4 and Table 5 present FTIR-ATR data before and after fouling by proteins on
the pristine membrane and the two aged ones.
Whatever the fouling amount and the membrane ageing state, the (H1661protein amide I/H1240PES) ratio is always proportional to the (H1539protein amide II/H1240PES) ratio; this means that β=0 in
equation 2.
Moreover, the (H1661protein amide I /H1539protein amide II ) ratio, and thus α term of equation 2, is the same for the three aged state membranes in a wide range of protein deposit amount. (Table 6).
4.1.3.Conclusion on the two approaches
Estimation of the height of protein amide I band from the height of protein amide II band can be achieved from spectra acquired with proteins in solution and with proteins adsorbed on membranes. Nevertheless the conclusions are clearly different: in solution the ratio of the two band heights varies whereas it remains constant for proteins adsorbed on membranes.
15 In solution, this result suggests a structural evolution of proteins with dilution likely due to a competition between hydrogen bond due to protein-protein interactions and those due to protein-water interactions.
On membranes, adsorption is mainly due to hydrophobic interactions that lead to similar structures of adsorbed proteins, regardless of the amount that always remains low.
Finally the proposed approach can be validated by using calibration obtained with protein adsorbed on membranes because it is a closer situation to that of adsorbed proteins during UF (Table 6).
4.2. Spiral membrane degradation state
The degradation state is discussed from both flux measurements and FTIR-ATR spectra.
4.2.1. UF of skim milk
For pristine CIP-3 membrane, the permeability to water at 50°C is 59.8 L.h-1.m-2.bar-1.
Three UF of skim milk have been performed on the pristine membrane with an alkaline cleaning step between each of them. Figure 9 shows the excellent reproducibility.
After a sufficient dose of NaOCl received by the membrane, fluxes progressively increase, highlighting, on a hydrodynamic point of view, that membrane degradation occurs. It is also evidenced that more than the limiting flux the critical flux also varies with the membrane ageing (see [24] and references cited herein for a discussion dealing with limiting and critical fluxes with the pristine membrane in skim milk).
4.2.2. Mapping of the protein irreversible deposit
After the last skim milk UF (NaOCl dose set at 2,800 ppm.d) the membrane is rinsed and autopsied. Figure 10 shows the distribution of the residual protein amount according to the location on the eight membrane sheets (supporting values are given Figure A4-1 in Appendix
16
4). The zone closed to the permeate collector axis is often more fouled. An average value is
calculated on all the membrane and corresponds to 50 ± 9 µg.cm-2.
4.2.3. PVP distribution on aged and fouled membrane
Figure 11 shows the mapping of the (H1661raw spectra/H1240PES)ratio as determined from raw
spectra obtained by FTIR-ATR. An average ratio is calculated on the whole membrane corresponding to 0.24 ± 0.03 (RSD = 11 %, the supporting values can be seen in Figure A4-2 in Appendix 4).
Figure 12 shows the mapping of the (H1661PVP/H1240PES)ratio as determined from raw spectra
obtained by FTIR-ATR and applying equation 3. An average ratio is calculated on the whole membrane corresponding to 0.08 ± 0.02 (RSD = 18 %, the supporting values can be seen in
Figure A4-3 in Appendix 4). The PVP amount can be roughly considered as constant,
highlighting a regular, but not total, disappearance of PVP on the whole membrane. This value is between that of the pristine membrane (0.14) and that of the industrial aged membrane (membrane U after extensive cleaning, 0.06).
In this spiral membrane, the protein amount varies from 10 to 80 µg of proteins per cm2 but most values are in the range 40-60 µg.cm-2: fouling is not homogeneous whereas the PVP amount appears roughly constant. Consequently it is not possible to evidence if the protein fouling plays a protective role toward the PVP degradation. Nevertheless it is not possible to conclude on the absence of this protection.
4.2.4. PES degradation on aged and fouled membrane
PES degradation has been checked from the 1030 cm-1 band increase. Figure 13 shows the mapping of the (H1030 /H1240PES)ratio as determined from raw spectra obtained by FTIR-ATR.
An average ratio has been calculated on the whole membrane corresponding to 0.13 ± 0.06 even if the relative standard deviation is very high (RSD = 45 %, the supporting values can be seen in Figure A4-4 in Appendix 4). Consequently, this degradation state cannot be considered as constant and further investigations are needed to understand the origin of this observation. Nevertheless all these values are significantly lower than that of the industrial aged membrane (Membrane U after extensive cleaning, 0.29).
17 For similar reasons, it is not possible to evidence if the protein fouling plays or not a protective role toward the PES degradation.
Prulho et al. [19] and Pellegrin et al. [20] suggesteed a link between PVP degradation and PES degradation. These authors believe that some degradation compounds of PVP obtained from reaction involving NaOCl can be active organic radicals. These radicals would be able to attack the PES skeleton and lead to the 1030 cm-1 band. So we tried to find correlation between PVP disappearance (H1661PVP/H1240PES) and PES degradation (H1030/H1240PES). But no particular relationship was found (see Figure A3-1 in Appendix 3). Our results were not able to confirm nor infirm the assumption of these authors.
CONCLUSION
This paper proposes and validates an approach to evaluate the degradation state of a PES/PVP membrane even when the membrane is fouled by proteins.
The procedure is based on FTIR-ATR technique and can be used with spectrometers of different characteristics aiming at a generalization of these results.
The approach is then successfully applied to a case study of a spiral membrane voluntarily aged on a UF pilot by filtration of a 400 ppm NaOCl pH 8.0 solution alternatively with UF of skim milk.
Mapping of the irreversible fouling distribution in this membrane aged at 2,800 ppm.d NaOCl dose has been performed. The results demonstrate the existence of a protein distribution that is different from that observed at lower TMP with a pristine membrane [24]. The PVP remaining amount is quite regular showing a partial degradation but not a total disappearance. The PES skeleton is also degraded but in a more irregular way. An attempt of correlation between protein fouling and PVP disappearance or PES degradation failed. Nevertheless it is not possible to draw conclusion about the efficiency or the non-efficiency of protection of the fouling layer toward the whole process of membrane degradation. Moreover, it has not been possible to evidence a link between PVP disappearance and PES skeleton degradation.
18
ACKNOWLEDGEMENTS
This study was financially supported by the French ANR program “Méduse” (project n° ANR-09-BLAN-0055-01).
The authors acknowledge Thomas DELHAYE, from University of Rennes 1 (Nanosims Platform) for the SIMS analysis of the pristine membrane.
The authors acknowledge Frederic Bon from University of Rennes 1- IUT Rennes for discussion.
19
REFERENCES
[1] L. Begoin, M. Rabiller-Baudry, B. Chaufer, C.Faille, P. Blanpain-Avet, T. Benezech, T.A. Doneva, Methodology of analysis of a spiral wound module. Application to PES membrane of ultrafiltration of skimmed milk, Desalination 192 (2006) 40-53.
[2] L. Begoin, M. Rabiller-Baudry, B. Chaufer, M.C. Hautbois, T.A. Doneva, Ageing of PES industrial spiral-wound membranes in acid whey ultrafiltration, Desalination 192 (2006) 25-39.
[3] M. Rabiller-Baudry, L. Bégoin, D. Delaunay, L. Paugam, B. Chaufer, A dual approach of membrane cleaning based on physico-chemistry and hydrodynamics: Application to PES membrane of dairy industry, Chem. Eng. Process. 47 (2008) 267-275.
[4] D. Delaunay, M. Rabiller-Baudry, J.M. Gozalvez-Zafrilla, B. Balannec, M. Frappart, L. Paugam, Mapping of protein fouling by FTIR-ATR as experimental tool to study membrane fouling and fluid velocity profile in various geometries and validation by CFD simulation, Chem. Eng. Process. 47 (2008) 1106–1117.
[5] H. Bouzid, M. Rabiller-Baudry, L. Paugam,F. Rousseau, Z. Derriche, N.E. Bettahar, Impact of zeta potential and size of caseins as precursors of fouling deposit on limiting and critical fluxes in spiral ultrafiltration of modified skim milks, J. Membr. Sci. 314 (2008) 67-75.
[6] M. Rabiller-Baudry, C. Leperoux, D. Delaunay, H. Diallo, L. Paquin, On the use of microwaves to accelerate ageing of an ultrafiltration PES membrane by sodium hypochlorite to obtain similar ageing state to that obtained for membranes working at industrial scale, Filtration 14 (2014) 38-48.
[7] L. Paugam, D. Delaunay, N.W. Diagne, M. Rabiller-Baudry, Cleaning of skim milk PES ultrafiltration membrane: on the real effect of the cleaning acid step, J. Membr. Sci. 428 (2013) 275-280.
20 [8] C. Causserand, S. Rouaix, J.P. Lafaille, P. Aimar, Degradation of polysulfone membranes due to contact with bleaching solution, Desalination 199 (2006) 70-72.
[9] S. Rouaix, C. Causserand, P. Aimar, Experimental study of the effects of hypochlorite on polysulfone membrane properties, J. Membr. Sci. 277 (2006) 137-147.
[10] F. Thominette, O Farnault, E. Gaudichet-Maurin, C. Machinal, J.C. Schrotter, Ageing of polyethersulfone ultrafiltration membranes in hypochlorite treatment, Desalination 200 (2006) 7-8.
[11] E. Gaudichet-Maurin, F. Thominette, Ageing of polysulfone ultrafiltration membranes in contact with bleach solutions, J. Membr. Sci. 282 (2006) 198-204.
[12] E. Arkhangelsky, D. Kuzmenko, V. Gitis, Impact of chemical cleaning on properties and functioning of polyethersulfone membranes, J. Membr. Sci.305 (2007) 176-184.
[13] C. Causserand, S. Rouaix, J.P. Lafaille; P. Aimar, Ageing of polysulfone membranes in contact with bleach solution: Role of radical oxidation and of some dissolved metal ions, Chem. Eng. Process.: Process Intensification 47 (2008) 48-56.
[14] K. Yadav, K.R. Morison, M.P. Staiger, Effects of hypochlorite treatment on the surface morphology and mechanical properties of polyethersulfone ultrafiltration membranes, Polymer Degrad. Stab. 94 (2009) 1955-1961.
[15] K. Yadav, K.R. Morison, Effects of hypochlorite exposure on flux through polyethersulphone ultrafiltration membranes, Food Bioproducts Process. 88 (2010) 419-424.
[16] B. Pellegrin, R Prulho, A. Rivaton, S. Therias, J.L. Gardette, E. Gaudichet-Maurin, C. Causserand, Hypochlorite Cleaning of Polyethersulfone/Polyvinylpyrrolidone Ultrafiltration Membranes: Impact on Performances, Procedia Engineering 44 (2012) 472-475.
[17] R. Prulho, A. Rivaton, S. Therias, J.L. Gardette, Ageing Mechanism of Polyethersulfone/Polyvinylpyrrolidone Membranes in Contact with Bleach Water, Procedia Engineering 44 (2012) 1031-1034.
21 [18] R. Prulho, S. Therias, A. Rivaton, J.L. Gardette, Ageing of polyethersulfone/polyvinylpyrrolidone blends in contact with bleach water, Polymer Degrad. Stabi. 98 (2013) 1164-1172.
[19] B. Pellegrin, R. Prulho, A. Rivaton, S. Therias, J.L. Gardette, E. Gaudichet-Maurin, C. Causserand, Multi-scale analysis of hypochlorite induced PES/PVP ultrafiltration membranes degradation, J. Membr. Sci. 447 (2013) 287-296.
[20] C. Régula, E. Carretier, Y. Wyart, M. Sergent, G. Gésan-Guiziou, D. Ferry, A. Vincent, D. Boudot, P. Moulin, Ageing of ultrafiltration membranes in contact with sodium hypochlorite and commercial oxidant: Experimental designs as a new ageing protocol, Sep. Purif. Technol. 103 (2013) 119-138.
[21] C. Regula, E. Carretier, Y. Wyart, G. Gésan-Guiziou, A. Vincent, D. Boudot, P. Moulin, Chemical cleaning/disinfection and ageing of organic UF membranes: A review, Water Res.56 (2014) 325-365.
[22] I.M. Wienk, E.E.B. Meuleman, Z Borneman, Th. van den Boomgaard, C.A. Smolders, Chemical treatment of membranes of a polymer blend: mechanism of the reaction of hypochloride with poly(vinylpyrrolidone). J. Polym. Sci.: Part A: Polym. Chem. 33 (1995) 49-54.
[23] M. Rabiller-Baudry, N.W Diagne, D. Lebordais, How the experimental knowledge of the irreversible fouling distribution can contribute to understand the fluid circulation in a spiral ultrafiltration membrane, Sep. Purif. Technol. 136 (2014) 157-167.
22
Table captions
Table 1. Conditions of membrane accelerated ageing, FTIR-ATR characteristics and protein
amount further adsorbed on (aged) membrane surface.
*H1661 PVP is the height of the band located at 1661 cm-1 and attributed to PVP in the pristine membrane whereas H1240 PES is the height of the band located at 1240 cm-1 and attributed to PES in the pristine membrane.
Table 2. Description of the 3 FTIR-ATR spectrometers used in this study
Table 3. Hi/H1240PES ratio from FTIR-ATR before and after fouling of pristine membrane by proteins.
Table 4. Hi/H1240PES ratio from FTIR-ATR before and after fouling of the 210 min micro-waves aged membrane by proteins.
Table 5. Hi/H1240PES ratio from FTIR-ATR before and after fouling of the 480 min micro-waves aged membrane by proteins
Table 6. Determination of H1661protein amide I/H1240PES from .(H1539protein amide II/H1240PES) for different membranes
23
Figure captions
Figure 1: Some polymers constituting active layer of membranes
Figure 2: Opening of the PVP ring opening by hypochlorite in alkaline conditions according
to Wienk et al. [22]
Figure 3: Evolution of PES skeleton by formation of – (a) sulfonic acid group according to
[14] and (b) phenol group (OH on the phenyl ring) according to [18]
Figure 4: FTIR-ATR raw spectra of a pristine PES/PVP membrane (HFK-131, Koch) in
green and with smaller intensity of an industrial membrane at the end of its service life (membrane U)
Figure 5: Raw spectra of a PES/PVP membrane - (a) without or (b) with protein fouling
Figure 6: Summary of the analytical difficulty to overcome and of the proposed approach
Figure 7: NanoSIMS analysis of the pristine HFK-131 membrane highlighting presence of
nitrogen. Y-axis gives the atomic ratio of organic nitrogen to sulfur considering that N comes from PVP and S from PES. The longer is the atom ablation time on the x-axis the deeper is the analysis in the membrane. There is more PVP on the surface of the membrane but it never disappears
Figure 8. Scheme of the spiral membrane with 4 double sheets highlighting the different
channels in which are inserted retentate or permeate spacer, respectively. Each membrane is labelled according to the same nomenclature as those used for the quantification of protein amount for the autopsied membrane (see results). F1C1 is the innermost membrane sheet whereas F4C2 is the outermost one.
24
Figure 9: Evolution of flux in skim milk according to NaOCl dose received by the spiral
membrane
Figure 10. Mapping of the protein irreversible deposit in the spiral membrane determined
from FTIR-ATR quantification (protein amount in µg.cm-2) according to the location in the spiral membrane. The local TMP is calculated from the assumption of a linear pressure drop decrease. The membrane labels are defined on Figure 8. TMP decreases from the inlet to the outlet of the spiral membrane. d is the distance from the permeate axis (d=0) for a membrane sheet.
Figure 11 Mapping of H1661raw spectrum/H1240PES obtained from FTIR-ATR according to the location in the spiral membrane. The local TMP is calculated from the assumption of a linear pressure drop decrease. The membrane labels are defined on Figure 8. TMP decreases from the inlet to the outlet of the spiral membrane. d is the distance from the permeate axis (d=0) for a membrane sheet.
Figure 12. Mapping of H1661 PVP/H1240 PES obtained from equation 3 according to the location in the spiral membrane. The local TMP is calculated from the assumption of a linear pressure drop decrease. The membrane labels are defined on Figure 8. TMP decreases from the inlet to the outlet of the spiral membrane. d is the distance from the permeate axis (d=0) for a membrane sheet
Figure 13. Mapping of H1030/H1240PES according to the location in the spiral membrane. The local TMP is calculated from the assumption of a linear pressure drop decrease. The membrane labels are defined on Figure 8. TMP decreases from the inlet to the outlet of the spiral membrane. d is the distance from the permeate axis (d=0) for a membrane sheet
A A O d T t o W t O c i F d r AP Ap On dep spe To tho ove We targ On cho inst Fig diff resu PPE ppen e m pend ectr ov ose erla e th get a p osen tanc gure fere ults END ndi mus ds o a w verc loc appi hen com prac n in ce b e A ent s ar DIC ix 1 st u on with com ate ing nee mpo ctic n a betw A1-pr re o CES 1: F unde the h dif me t d a wi ed one cal p a w wee -1 : istin obta S FTI erst e thi ffer this at 1 ith P to ent poin wave en 2 Li ne aine R-A tand ickn rent dif 240 PVP det ow nt o enu 224 inea HF ed w ATR d th nes t fo ffic 0 cm P a term wing of v umb 40 a ar FK-whe R r hat ss o oulin cult m-1 and mine g a b view ber and rel -13 en c regi the of th ng y, w (th pro e th ban w H reg d 20 atio 1 m com istr e p he f am we he h otei he H nd l Hi h gio 060 ons mem mpa rati pene foul moun pay heig in b Hi/H oca as t n t cm ship mbr arin ion etra ling nts y a ght band H12 ated to b that m-1 f p b ran ng sp atio g de is n a sp of ds. 240 P d at be m t is furt etw nes pec on d epo not peci wh Co PES t wi mea s ve ther ween wit ctro dep osit. pos ial hich nse rat . asur ery r ca n b th ome th . Co ssib atte h is eque tio t red fla alled ban spe eter of ons ble. enti fu ent to c ag at a d H d h ectr r 1 a the sequ . ion rthe tly i com ain and H206 heig rom and e IR uen to er c it ca mpa nst a d w 0-22 ght mete d sp R in ntly on call an b are a ba with 240b ra er 1 pect ncid dir e o led be u var asel h a baseli atio 1 a trom den rect of th H1 use riat line ver ine w o (H and met nt b t co he P 240 ed a tion e of ry with Hi/H sp ter 3 beam omp PES PES as a n in f ref sm h sp H124 pect 3. m i pari S m S ). T ref n the fere mall pec 40PE trom in t ison mem Thi fere e q enc ab ctrom ES) met the n of mbr s b ence quan e th bsor me me ter me f H rane and e ba ntity hat rban ter easu 2. emb i on e ba d ha and y o mu nce 1. ure Sim bran n tw and as n d. of th ust b e, f d o mila 25 ne wo ds, no he be for on ar
26
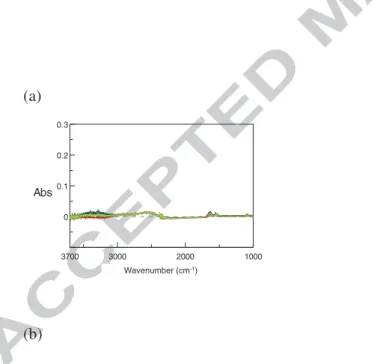
Appendix 2: Determination of γ for FTIR-ATR analysis of proteins in aqueous solutions. The spectrum of water is firstly registered (Figure A2-1 a): two main bands due to OH bond are observed located close to 3333 cm-1 and 1636 cm-1, respectively.
(a)
(b)
Figure A2-1: FTIR-ATR raw spectra- (a) water – (b) protein solutions in water The spectra of protein solutions (protein concentration between 5 and 50 g.L-1) are registered (Figure A2-1 b). At first sight bands of water are easily observed. Looking carefully close to
-0.1 0.3 0 0.1 0.2 3700 3000 2000 1000 Abs Wavenumber [cm-1] Wavenumber (cm-1) 3333 1636 -0.1 0.3 0 0.1 0.2 3700 3000 2000 1000
Abs
Wavenumber [cm-1]
Wavenumber (cm-1) 0 0.12 0.05 0.1 2000 1800 1600 1400 1200 1000 Abs Wavenumber [cm-1] proteins27 1500-1600 cm-1, it is shown that shoulders appear in the 1636 cm-1 band of water. These shoulder correspond to amide I and amide II band of proteins, as it can be evidenced after substraction according to equation A2-1 (Figure A2-2b).
Protein difference spectrum = Protein raw spectrum - water spectrum (eq. A2-1)
(a) (b) 0 0.12 0.05 0.1 2000 1800 1600 1400 1200 1000 Abs Wavenumber [cm-1]Wavenumber (cm-1) -0.005 0.015 0 0.005 0.01 2000 1800 1600 1400 1200 100 Abs Wavenumber [cm-1]Wavenumber (cm-1) Amide I Amide II
28 Figure A1-2: FTIR-ATR spectra in the 2000-1000 cm-1 region. (a) raw spectra of water and protein solution at 50 g.L-1– (b) difference spectrum obtained according to equation A2-1.
The use of equation A2-1 is correct as a first estimation and for qualitative purpose. But in order to have a better accuracy on the height of protein bands for quantitative purpose, the equation must be modified by introducing a corrective term, further called γ, leading at least to
equation A2-2 (similar to eq. 6 in the full paper).
Protein difference spectrum = Protein raw spectrum – γ water spectrum (eq. A2-2)
The value of γ is determined from the simultaneous cancellation of both the 3333 and 1636 cm-1 bands of the raw spectra attributed to water. Figure A2-3 illustrates the impact of γ choice that is adjusted up to obtain a difference spectrum as flat as possible in the regions of interest. (a) (b) -0.1 0.3 0 0.1 0.2 3700 3000 2000 1000 Abs Wavenumber [cm-1]Wavenumber (cm-1)
29 (c)
(d)
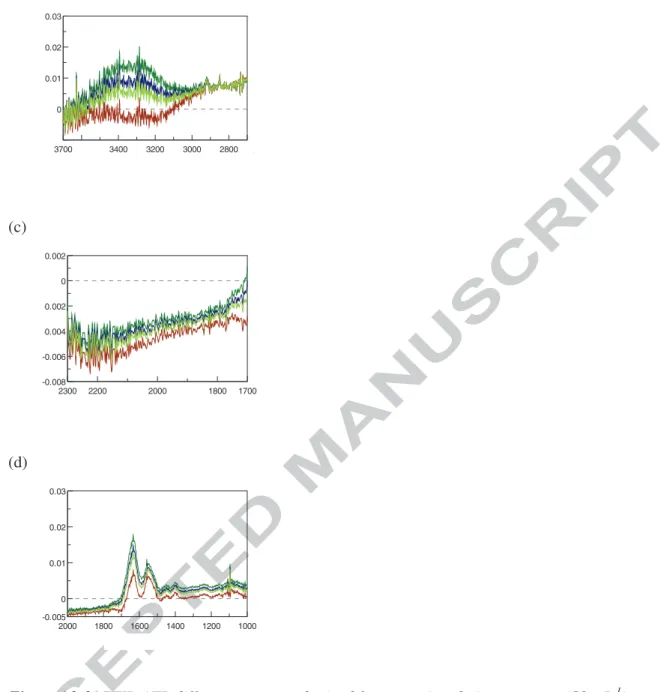
Figure A2-3: FTIR-ATR difference spectra obtained from protein solution spectrum (50 g.L-1) and water spectrum according to equation A2 with various γ value in the range 0.95 – 1.05- (a) 3700-1000 cm-1 range- (b) zoom in the 3700-2800 cm-1 region to evidence cancellation of the 3333 cm-1 water band –(c) zoom in the 2300-1700 cm-1 region and (d) zoom in the 2000-1000 cm-1 region to evidence cancellation of the 1661 cm-1 water band and the appearance of amide I and amide II protein bands.
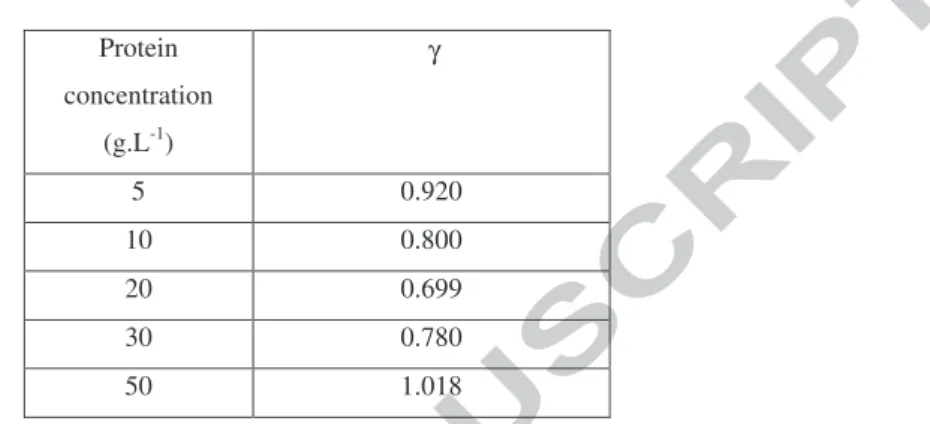
Such determination have been done for the different protein concentration. Table A2-1 shows the optimized γ values for spectrum used in this study.
-0.01 0.03 0 0.01 0.02 3700 3400 3200 3000 28002700 Abs Wavenumber [cm-1] -0.008 0.002 -0.006 -0.004 -0.002 0 2300 2200 2000 1800 1700 Abs Wavenumber [cm-1] -0.005 0.03 0 0.01 0.02 2000 1800 1600 1400 1200 1000 Abs Wavenumber [cm-1]
30 Table A2-1. Optimised γ value for difference spectrum (according to equation A2) for each protein solution. : Protein concentration (g.L-1) γ 5 0.920 10 0.800 20 0.699 30 0.780 50 1.018
Appendix 3: Attempt of correlation between PVP and PES degradation
The aim is to evidence possible correlation between the disappearance of PVP and the degradation of PES (Figure A3-1). None is found.
0.00
0.10
0.20
0.30
0.40
0.50
0.60
0.00
0.02
0.04
0.06
0.08
0.10
0.12
0.14
(H
1 0 3 0/H
1 2 4 0 P E S)
fi n a l-(H
1 0 3 0/H
1 2 4 0 P E S)
in it ia l(H
1661PVP/H
31 Figure A3-1: Increase of 1030cm-1 band (according to FTIR-ATR, pristine membrane value is 0.04) versus decrease of PVP (according to FTIR-ATR, pristine membrane value is 0.14) - (spectra acquired on 334 samples of CIP-3 spiral membrane)
Appendix 4: FTIR-ATR supporting data corresponding to Figures 10 (A4-1), 11 (A4-2), 12 (A4-3), 13 (A4-4).
F1C1 F1C2
Inlet Outlet Inlet Outlet TMP(bar) TMP(bar) 5.0 5.0 68 71 57 55 59 54 57 64 ! 60 58 54 49 57 59 53 51 "" 58 56 58 53 54 58 53 52 ! 54 61 53 49 49 43 50 52 # 52 51 53 49 48 46 50 47 $ 53 52 51 48 50 57 48 44 % 51 50 49 53 62 46 42 47 &' 49 55 49 46 42 52 48 61 '& 47 49 48 46 47 43 42 33 % 51 48 58 47 57 34 42 38 $ 37 37 42 39 25 25 26 26
permeate axis permeate axis 4.5 3.9 3.4 4.5 3.9 3.4
32
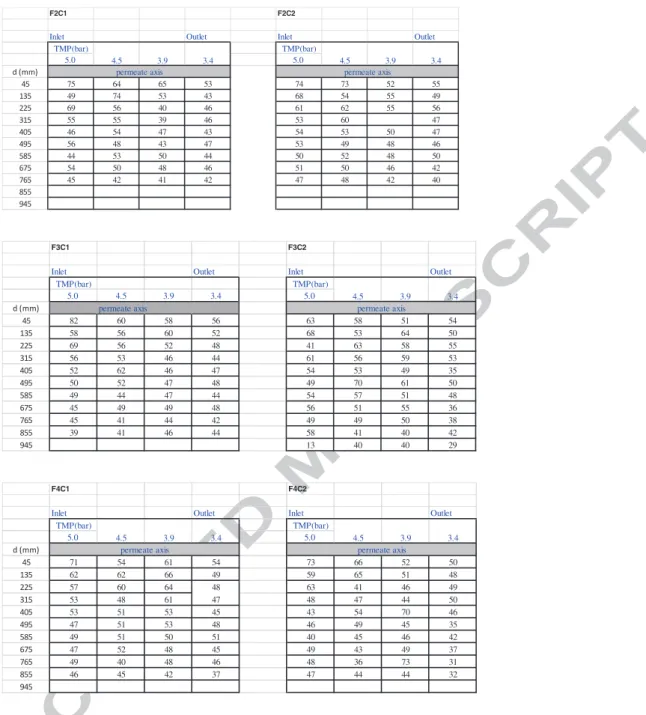
Figure A4-1. Mapping of the protein irreversible deposit in the spiral membrane determined
from FTIR-ATR quantification (protein amount in µg.cm-2) according to the location in the spiral membrane. The local TMP is calculated from the assumption of a linear pressure drop decrease. The membrane labels are defined on Figure 8. (white = not determined)
F2C1 F2C2
Inlet Outlet Inlet Outlet TMP(bar) TMP(bar) 5.0 5.0 75 64 65 53 74 73 52 55 ! 49 74 53 43 68 54 55 49 "" 69 56 40 46 61 62 55 56 ! 55 55 39 46 53 60 47 # 46 54 47 43 54 53 50 47 $ 56 48 43 47 53 49 48 46 % 44 53 50 44 50 52 48 50 &' 54 50 48 46 51 50 46 42 '& 45 42 41 42 47 48 42 40 % $
permeate axis permeate axis
4.5 3.9 3.4 4.5 3.9 3.4
F3C1 F3C2
Inlet Outlet Inlet Outlet TMP(bar) TMP(bar) 5.0 4.5 3.9 3.4 5.0 permeate axis ! 82 60 58 56 63 58 51 54 "#! 58 56 60 52 68 53 64 50 $$! 69 56 52 48 41 63 58 55 #"! 56 53 46 44 61 56 59 53 %! 52 62 46 47 54 53 49 35 &! 50 52 47 48 49 70 61 50 !'! 49 44 47 44 54 57 51 48 ()! 45 49 49 48 56 51 55 36 )(! 45 41 44 42 49 49 50 38 '!! 39 41 46 44 58 41 40 42 & ! 13 40 40 29 4.5 3.9 3.4 permeate axis F4C1 F4C2
Inlet Outlet Inlet Outlet TMP(bar) TMP(bar) 5.0 5.0 71 54 61 54 73 66 52 50 ! 62 62 66 49 59 65 51 48 "" 57 60 64 48 63 41 46 49 ! 53 48 61 47 48 47 44 50 # 53 51 53 45 43 54 70 46 $ 47 51 53 48 46 49 45 35 % 49 51 50 51 40 45 46 42 &' 47 52 48 45 49 43 49 37 '& 49 40 48 46 48 36 73 31 % 46 45 42 37 47 44 44 32 $
permeate axis permeate axis
33
F1C1 F1C2
Inlet Outlet Inlet Outlet TMP(bar) TMP(bar) 5.0 5.0 0.306 0.316 0.268 0.257 0.283 0.272 0.242 0.261 ! 0.269 0.274 0.252 0.248 0.283 0.280 0.263 0.258 "" 0.276 0.267 0.274 0.251 0.268 0.279 0.268 0.244 ! 0.248 0.259 0.255 0.235 0.235 0.222 0.257 0.230 # 0.251 0.249 0.260 0.239 0.237 0.221 0.254 0.244 $ 0.261 0.256 0.255 0.232 0.236 0.255 0.245 0.226 % 0.242 0.250 0.242 0.248 0.234 0.242 0.206 0.241 &' 0.240 0.250 0.239 0.235 0.194 0.254 0.238 0.221 '& 0.236 0.243 0.242 0.233 0.215 0.219 0.237 0.173 % 0.253 0.237 0.258 0.234 0.117 0.205 0.218 0.196 $ 0.197 0.202 0.219 0.194 0.139 0.150 0.158 0.150
permeate axis permeate axis
34
Figure A4-2 Mapping of H1661raw spectra/H1240PES obtained from FTIR-ATR according to the location in the spiral membrane. The local TMP is calculated from the assumption of a linear pressure drop decrease. The membrane labels are defined on Figure 8. (white = not determined)
F2C1 F2C2
Inlet Outlet Inlet Outlet TMP(bar) TMP(bar) 5.0 5.0 0.333 0.297 0.289 0.253 0.303 0.289 0.248 0.250 ! 0.250 0.336 0.260 0.228 0.295 0.266 0.263 0.252 "" 0.264 0.267 0.215 0.234 0.287 0.281 0.252 0.248 ! 0.257 0.251 0.204 0.214 0.255 0.286 # 0.239 $ 0.233 0.259 0.240 0.221 0.260 0.254 0.248 0.240 % 0.256 0.232 0.222 0.228 0.264 0.252 0.245 0.239 & 0.221 0.256 0.237 0.211 0.255 0.195 0.247 0.240 '( 0.255 0.249 0.239 0.233 0.259 0.255 0.243 0.223 (' 0.220 0.214 0.217 0.214 0.242 0.244 0.222 0.206 & %
permeate axis permeate axis
4.5 3.9 3.4 4.5 3.9 3.4
F3C1 F3C2
Inlet Outlet Inlet Outlet TMP(bar) TMP(bar) 5.0 5.0 0.335 0.302 0.261 0.270 0.272 0.270 0.240 0.267 ! 0.275 0.271 0.279 0.248 0.309 0.274 0.272 0.255 "" 0.285 0.275 0.268 0.248 0.262 0.281 0.280 0.261 ! 0.262 0.259 0.233 0.243 0.271 0.267 0.262 0.246 # 0.257 0.268 0.235 0.231 0.259 0.269 0.247 0.230 $ 0.246 0.263 0.242 0.240 0.259 0.288 0.265 0.253 % 0.243 0.231 0.244 0.233 0.256 0.257 0.259 0.248 &' 0.233 0.235 0.245 0.251 0.250 0.261 0.223 '& 0.256 0.221 0.228 0.222 0.242 0.247 0.254 0.227 % 0.218 0.220 0.234 0.229 0.271 0.227 0.235 0.220 $ 0.138 0.205 0.217 0.172
permeate axis permeate axis
4.5 3.9 3.4 4.5 3.9 3.4
F4C1 F4C2
Inlet Outlet Inlet Outlet TMP(bar) TMP(bar) 5.0 5.0 0.316 0.265 0.283 0.239 0.274 0.290 0.255 0.251 ! 0.275 0.278 0.264 0.246 0.275 0.251 0.204 0.235 "" 0.266 0.273 0.297 0.239 0.289 0.213 0.235 0.251 ! 0.255 0.235 0.274 0.228 0.248 0.237 0.212 0.231 # 0.257 0.257 0.240 0.231 0.213 0.266 0.272 0.221 $ 0.244 0.253 0.265 0.234 0.230 0.217 0.216 0.189 % 0.243 0.240 0.244 0.228 0.211 0.225 0.227 & '( 0.232 0.249 0.220 0.215 0.229 0.225 0.232 0.186 (' 0.256 0.206 0.231 0.243 0.250 0.205 0.244 0.192 % 0.227 0.225 0.199 0.191 0.220 0.201 0.226 0.176 $
permeate axis permeate axis
35
F1C1 F1C2
Inlet Outlet Inlet Outlet TMP(bar) TMP(bar) 5.0 5.0 0.090 0.091 0.085 0.079 0.092 0.098 0.059 0.058 ! 0.078 0.089 0.077 0.086 0.099 0.089 0.091 0.092 "" 0.089 0.085 0.086 0.078 0.093 0.092 0.094 0.073 ! 0.073 0.063 0.082 0.075 0.074 0.079 0.095 0.062 # 0.069 0.048 0.075 0.078 0.081 0.069 0.092 0.090 $ 0.088 0.086 0.088 0.075 0.072 0.071 0.089 0.080 % 0.078 0.087 0.082 0.076 0.037 0.085 0.067 0.087 &' 0.080 0.073 0.079 0.082 0.055 0.086 0.081 0.026 '& 0.081 0.083 0.084 0.081 0.060 0.077 0.096 0.060 % 0.088 0.079 0.072 0.080 # 0.088 0.077 0.069 $ 0.071 0.077 0.080 0.064 0.051 0.059 0.064 0.058
permeate axis permeate axis 4.5 3.9 3.4 4.5 3.9 3.4
F2C1 F2C2
Inlet Outlet Inlet Outlet TMP(bar) TMP(bar) 5.0 5.0 0.096 0.093 0.081 0.082 0.068 0.058 0.079 0.073 ! 0.091 0.102 0.087 0.087 0.078 0.089 0.086 0.092 "" 0.046 0.086 0.081 0.082 0.092 0.083 0.074 0.067 ! 0.079 0.073 0.072 0.061 0.083 0.092 0.085 # 0.083 0.083 0.087 0.079 0.085 0.081 0.085 0.084 $ 0.076 0.074 0.081 0.072 0.091 0.091 0.087 0.086 % 0.075 0.084 0.074 0.066 0.091 0.026 0.089 0.077 &' 0.081 0.086 0.083 0.082 0.092 0.091 0.090 0.084 '& 0.072 0.072 0.079 0.074 0.086 0.087 0.081 0.073 % $
permeate axis permeate axis 4.5 3.9 3.4 4.5 3.9 3.4
F3C1 F3C2
Inlet Outlet Inlet Outlet TMP(bar) TMP(bar) 5.0 5.0 0.077 0.107 0.075 0.090 0.070 0.082 0.073 0.092 ! 0.089 0.088 0.086 0.078 0.094 0.101 0.068 0.093 "" 0.066 0.095 0.097 0.090 0.126 0.081 0.094 0.083 ! 0.082 0.088 0.080 0.096 0.076 0.086 0.072 0.075 # 0.087 0.071 0.084 0.078 0.085 0.098 0.087 0.111 $ 0.082 0.093 0.086 0.083 0.098 0.065 0.071 0.089 % 0.083 0.086 0.090 0.087 0.082 0.072 0.093 0.092 &' 0.085 0.075 0.084 0.071 0.083 0.082 0.100 '& 0.107 0.085 0.083 0.081 0.081 0.086 0.091 0.100 % 0.087 0.083 0.082 0.083 0.085 0.089 0.102 0.079 $ 0.082 0.071 0.082 0.069
permeate axis permeate axis 4.5 3.9 3.4 4.5 3.9 3.4
F4C1 F4C2
Inlet Outlet Inlet Outlet TMP(bar) TMP(bar) 5.0 5.0 0.092 0.088 0.089 0.064 0.042 0.080 0.086 0.086 ! 0.081 0.055 0.087 0.081 0.086 0.042 0.038 0.078 "" 0.082 0.092 0.083 0.083 0.087 0.075 0.082 0.090 ! 0.077 0.078 0.073 0.084 0.090 0.081 0.065 0.068 # 0.090 0.069 0.083 0.090 0.071 0.092 0.052 0.070 $ 0.087 0.092 0.075 0.084 0.080 0.057 0.066 0.069 % 0.074 0.080 0.062 0.078 0.078 0.077 0.075 &' 0.080 0.064 0.066 0.094 0.068 0.081 0.071 0.060 '& 0.071 0.074 0.091 0.077 0.092 0.083 0.013 0.085 % 0.077 0.059 0.065 0.077 0.067 0.054 0.080 0.064 $
permeate axis permeate axis
36
Figure A4-3. Mapping of H1661 PVP/H1240 PES obtained from equation 3 according to the location in the spiral membrane. The local TMP is calculated from the assumption of a linear pressure drop decrease. The membrane labels are defined on Figure 8. (white = not determined)
37
F1 C1 F1 C2
Inlet Outlet Inlet Outlet TMP (bar) TMP (bar)
5.0 5.0
permeate axis permeate axis
! 0.124 0.126 0.108 0.121 0.264 0.136 0.283 0.234 "#! 0.110 0.112 0.106 0.092 0.415 0.125 0.155 0.117 $$! 0.111 0.105 0.114 0.118 0.127 0.138 0.113 0.144 #"! 0.103 0.108 0.109 0.096 0.141 0.171 0.099 0.149 %! 0.101 0.096 0.100 0.100 0.121 0.178 0.098 0.092 &! 0.101 0.103 0.099 0.107 0.167 0.448 0.094 0.119 !'! 0.096 0.098 0.116 0.097 0.262 0.132 0.115 0.088 ()! 0.103 0.097 0.100 0.088 0.140 0.104 0.255 0.307 )(! 0.099 0.108 0.101 0.109 0.167 0.162 0.110 0.117 '!! 0.104 0.104 0.102 0.104 0.098 0.120 0.093 0.117 & ! 0.087 0.091 0.092 0.112 0.095 0.098 0.087 0.124 4.5 3.9 3.4 4.5 3.9 3.4 F2 C1 F2 C2
Inlet Outlet Inlet Outlet TMP (bar) TMP (bar)
5.0 5.0
permeate axis permeate axis
! 0.163 0.119 0.178 0.127 0.204 0.384 0.153 0.124 "#! 0.124 0.130 0.104 0.084 0.122 0.120 0.114 0.096 $$! 0.222 0.094 0.152 0.096 0.116 0.114 0.121 0.100 #"! 0.100 0.096 0.098 0.114 0.144 0.111 0.091 %! 0.091 0.134 0.089 0.098 0.100 0.119 0.098 0.105 &! 0.104 0.115 0.091 0.086 0.100 0.094 0.091 0.110 !'! 0.124 0.135 0.091 0.110 0.100 0.254 0.101 0.161 ()! 0.099 0.091 0.105 0.086 0.095 0.098 0.095 0.098 )(! 0.098 0.111 0.093 0.086 0.108 0.099 0.097 0.092 '!! & ! 3.4 4.5 3.9 3.4 4.5 3.9 F3 C1 F3 C2
Inlet Outlet Inlet Outlet TMP (bar) TMP (bar)
5.0 5.0
permeate axis permeate axis
! 0.127 0.104 0.135 0.106 0.232 0.136 0.125 0.146 "#! 0.096 0.106 0.099 0.117 0.117 0.127 0.127 0.105 $$! 0.217 0.109 0.095 0.098 0.107 0.141 0.101 0.115 #"! 0.111 0.099 0.080 0.083 0.164 0.201 0.150 0.098 %! 0.114 0.103 0.101 0.102 0.109 0.127 0.116 0.125 &! 0.092 0.092 0.090 0.091 0.098 0.137 0.112 0.098 !'! 0.094 0.095 0.090 0.087 0.098 0.148 0.094 0.091 ()! 0.090 0.098 0.093 0.110 0.208 0.119 0.096 )(! 0.104 0.089 0.085 0.094 0.107 0.109 0.094 0.114 '!! 0.082 0.082 0.090 0.084 0.101 0.105 0.097 0.097 & ! 0.069 0.118 0.086 0.102 4.5 3.9 3.4 4.5 3.9 3.4 F4 C1 F4 C2
Inlet Outlet Inlet Outlet
TMP (bar) TMP (bar)
5.0 5.0
permeate axis permeate axis
! 0.131 0.116 0.122 0.120 0.222 0.137 0.110 0.111 "#! 0.140 0.186 0.467 0.097 0.126 0.121 0.329 0.157 $$! 0.160 0.137 0.169 0.101 0.154 0.173 0.103 0.099 #"! 0.128 0.147 0.160 0.141 0.102 0.101 0.164 0.180 %! 0.106 0.101 0.146 0.096 0.096 0.139 0.281 0.154 &! 0.082 0.110 0.093 0.155 0.186 0.115 0.102 0.260 !'! 0.102 0.119 0.115 0.197 0.116 0.136 0.130 ()! 0.103 0.099 0.259 0.161 0.092 0.119 0.140 0.116 )(! 0.093 0.096 0.111 0.092 0.091 0.083 0.570 0.167 '!! 0.098 0.106 0.139 0.138 0.096 0.115 0.096 0.099 & ! 4.5 3.9 3.4 4.5 3.9 3.4
38
Figure A4-4. Mapping of H1030/H1240PES according to the location in the spiral membrane. The local TMP is calculated from the assumption of a linear pressure drop decrease. The membrane labels are defined on Figure 8. (white = not determined).
Tables
Table 1. Conditions of membrane accelerated ageing, FTIR-ATR characteristics and protein
amount further adsorbed on (aged) membrane surface.
Ageing time (min) (micro-waves)
FTIR-ATR*
H1661PVP/H1240PES
Range of protein deposit on membrane surface (µg.cm-2) Pristine membrane 0 0.14 ± 0.01 (n=6) 0 – 208 Ageing by NaOCl 210 0.10 ± 0.01 (n=6) 0 - 76 Ageing by NaOCl 480 0.07 ± 0.01 (n=6) 0- 82 *
H1661 PVP is the height of the band located at 1661 cm-1 and attributed to PVP in the pristine membrane whereas H1240 PES is the height of the band located at 1240 cm-1 and attributed to PES in the pristine membrane.
39
Table 2. Description of the three FTIR-ATR spectrometers used in this study
Spectrometer 1 Spectrometer 2 Spectrometer 3
Paragon 1000 FT/IR-4100 Spectrum 100
Perkin-Elmer Jasco Perkin Elmer
ATR accessory
ZnSe crystal ZnSe crystal Diamond crystal incidence angle: 45° incidence angle: 45° incidence angle: 45° 12 reflections 1 reflection 1 reflection
Crystal dimension
2 cm x 5 cm 1.8 mm diameter 2 mm diameter
Software Spectrum for windows 5
Spectra Manager II Spectrum for windows 6
Acquisition conditions
spectral domain : spectral domain : spectral domain : 4000-600 cm-1 3700-600 cm-1 4000-600 cm-1 resolution : 2 cm-1 resolution : 2 cm-1 resolution : 2 cm-1
20 scans 128 scans 20 scans