HAL Id: hal-01360003
https://hal.archives-ouvertes.fr/hal-01360003
Submitted on 5 Sep 2016
HAL is a multi-disciplinary open access
archive for the deposit and dissemination of
sci-entific research documents, whether they are
pub-lished or not. The documents may come from
teaching and research institutions in France or
abroad, or from public or private research centers.
L’archive ouverte pluridisciplinaire HAL, est
destinée au dépôt et à la diffusion de documents
scientifiques de niveau recherche, publiés ou non,
émanant des établissements d’enseignement et de
recherche français ou étrangers, des laboratoires
publics ou privés.
Multiple electron transfer systems in oxygen reducing
biocathodes revealed by different conditions of
aeration/agitation
Mickaël Rimboud, Alain Bergel, Benjamin Erable
To cite this version:
Mickaël Rimboud, Alain Bergel, Benjamin Erable. Multiple electron transfer systems in oxygen
reduc-ing biocathodes revealed by different conditions of aeration/agitation. Bioelectrochemistry, Elsevier,
2016, vol. 110, pp. 46-51. �10.1016/j.bioelechem.2016.03.002�. �hal-01360003�
O
pen
A
rchive
T
OULOUSE
A
rchive
O
uverte (
OATAO
)
OATAO is an open access repository that collects the work of Toulouse researchers and
makes it freely available over the web where possible.
This is an author-deposited version published in :
http://oatao.univ-toulouse.fr/
Eprints ID : 15712
To link to this article : DOI : 10.1016/j.bioelechem.2016.03.002
URL :
http://dx.doi.org/10.1016/j.bioelechem.2016.03.002
To cite this version :
Rimboud, Mickaël and Bergel, Alain and
Erable, Benjamin Multiple electron transfer systems in oxygen
reducing biocathodes revealed by different conditions of
aeration/agitation. (2016) Bioelectrochemistry, vol. 110. pp. 46-51.
ISSN 1567-5394
Any correspondence concerning this service should be sent to the repository
administrator:
staff-oatao@listes-diff.inp-toulouse.fr
Multiple electron transfer systems in oxygen reducing biocathodes
revealed by different conditions of aeration/agitation
Mickaël Rimboud, Alain Bergel, Benjamin Erable
⁎
Laboratoire de Génie Chimique, CNRS-Université de Toulouse, 4 Allée Emile Monso, 31432 Toulouse Cedex 04, France
a b s t r a c t
Oxygen reducing biocathodes were formed at −0.2 V/SCE (+0.04 V/SHE) from compost leachate. Depending on whether aeration was implemented or not, two different redox systems responsible for the electrocatalysis of ox-ygen reduction were evidenced. System I was observed at low potential (−0.03 V/SHE) on cyclic voltammetries (CVs). It appeared during the early formation of the biocathode (few hours) and resisted the hydrodynamic con-ditions induced by the aeration. System II was observed at higher potential on CV (+0.46 V/SHE); it required a longer lag time (up to 10 days) and quiescent conditions to produce an electrochemical signal. The hydrodynamic effects produced by the forced aeration led to its extinction. From their different behaviors and examples in the literature, system I was identified as being a membrane-bound cytochrome-related molecule, while system II was identified as a soluble redox mediator excreted by the biofilm. This study highlighted the importance of con-trolling the local hydrodynamics to design efficient oxygen reducing biocathodes able to operate at high potential.
Keywords: Biocathode Oxygen reduction Microbial fuel cell Aeration Hydrodynamics Cyclic voltammetry
1. Introduction
Because it is abundantly available in the environment and because its complete reduction only produces water, molecular oxygen has been targeted as the final electron acceptor in fuel cells, including mi-crobial fuel cells (MFCs). This particular kind of fuel cell relies on bacte-rial biofilms that are developed on anodes and are able to catalyze the oxidation of various kinds of organic and/or inorganic matter, which makes these devices of great combined economic and environmental interest[1].
The vast majority of MFCs presented in the literature rely on abiotic oxygen reducing (OR) cathodes[2,3]. These cathodes often use expen-sive catalysts, e.g. derivatives of platinum-based chemicals, and are sen-sitive to poisoning and biofouling in natural media like the sludge or sediments used to feed MFCs. These drawbacks make them difficult to scale up for industrial applications and OR-biocathodes would consti-tute worthwhile alternatives.
Electroactive bacteria coming from many different natural environ-ments have been reported in OR-biocathodes, the most used inocula being aerobic sludge[4–8], seawater or marine sediment[9–14], and, to a lesser extent, soils [15,16]. The majority of studies on OR-biocathodes have implemented multispecies environmental consortia and studies using pure cultures of a single bacterium remain scarce[9, 11,17].
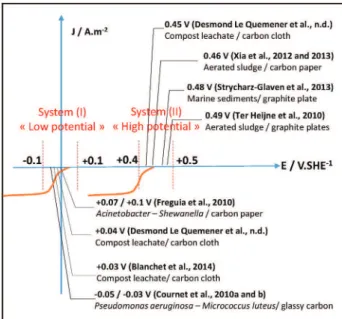
Various set-ups and methodologies have been used for developing OR biocathodes but analytical investigation of electron transfer mecha-nisms ultimately calls upon cyclic voltammetry. Different values of oxy-gen reduction reaction (ORR) half-wave potential (read on the reductive scan) have been obtained by various authors using this tech-nique. As ORR potential depends on pH, values reported in works real-ized at unusually acidic[18] or alkaline pH[19] that would have changed the ORR potential are omitted here. Only values obtained in studies realized at neutral pH are presented inSchematic 1.
The reported potentials can be clustered in two different groups. In a first group, ORR catalysis was observed at rather low potentials, ranging between −0.1 and 0.1 V/SHE. In a second group, signals for ORR were observed at higher potentials, ranging between 0.4 and 0.5 V/SHE. Ex-amples of “high potential” signals were notably found by Ter Heijne et al., who compared the performances of biocathodes developed from aerated sludge using different, but deliberately high, polarization poten-tials: 0.255, 0.355 and 0.455 V/SHE[8]. They described an identical voltammetric ORR signal centered at 0.49 V/SHE, whatever the polariza-tion potential. The main difference between the biocathodes resided in a faster start-up time with the reactors polarized at lower potential (0.255 and 0.355 V/SHE). Xia et al. conducted a similar experiment to compare the behavior of OR-biocathodes designed at 0.142, 0.302 and 0.442 V/ SHE[5]. The cyclic voltammograms showed an ORR signal at 0.46 V/ SHE with a mature biocathode. They identified 0.302 V/SHE as the best polarization potential, resulting from a compromise between fast start-up and high current densities, and consequently used a similar po-tential, 0.311 V/SHE to design efficient OR-biocathodes for an MFC ap-plication in a subsequent report. Strycharz-Glaven et al. found a
⁎ Corresponding author.
E-mail address:benjamin.erable@ensiacet.fr(B. Erable).
voltammetric signal centered on 0.48 V/SHE with an OR-biocathode in a microbial solar cell inoculated with marine sediments[10].
Compared to high-potential signals, low-potential signals are more often encountered in the literature. Such signals were observed by Freguia et al. working with Acinetobacter calcoaceticus and Shewanella
putrefaciens[20]and by Cournet et al. when testing the ORR activity of 14 different bacterial strains, among them Micrococcus luteus, a Gram positive bacterium and Pseudomonas aeruginosa, a Gram negative one
[21]. ORR signals were observed at −0.05 and −0.03 V/SHE, respec-tively, with these bacteria[21,22]. Marine biofilms formed with[9,11]
or without[23]prior polarization produced low potential signals and voltammetric tests performed on pure strain bacteria isolated from such biofilms also presented low potential signals[9,24]. Blanchet et al. observed an ORR signal at + 0.03 V/SHE during the cathodic phase of reversible bioelectrodes designed from garden compost[25]. A similar signal, centered on + 0.04 V/SHE was observed during the straightforward formation of OR-biocathodes[15].
In conclusion, the data, presented inFig. 1, revealed that:
- The low and high potential signals were observed with marine[9, 10,24]or soil inocula[15,25]. Both types of signal were also observed when using the same electrode material, for example carbon cloth[15, 25]or carbon paper[6,20]. In consequence, low or high potential signals are correlated neither with the inoculum source nor with the electrode material.
- Signals at low potential were recorded mainly with pure strain cul-tures [9,20,22,21], when no polarization was applied prior to voltammetric experiments[20,22,21], or, at the most, a polarization at low potential (maximum −0.04 V/SHE in Desmond-Le Quemener et al.[15]).
- Low potential signals appeared quickly after the experiment began (a few hours up to 2 days for Desmond-Le Quemener et al., whereas high potential signals needed a higher polarization potential (minimum 0.142 V/SHE, in[6]) and more time to develop (up to 15 days in Ter Heijne's experiments[8]).
The importance of the polarization potential was particularly highlighted by Desmond-Le Quemener et al. Using two different polar-ization potentials, they experienced the coexistence of both low and high potential signals when the biocathode was formed at 0.34 V/SHE, but only the low potential signal for biocathodes formed at −0.16 V/ SHE.
The poor solubility of oxygen can be an important rate limiting factor of OR-cathodes operating in aqueous media. Controlling the aeration conditions is thus a crucial element for a better understanding of OR-biocathode behavior. Accordingly, different conditions of aeration were tested in this work in order to better understand the relative de-velopments of low and high potential signals for oxygen reduction by microbial biofilms. OR-biocathodes were designed using compost leachate as the medium, under constant polarization. In a first experi-mental run, OR-biocathodes were either in reactors exposed to perma-nent forced aeration using a vigorous air flux or had no forced aeration. In the second experimental run, biocathodes initially designed under quiescent conditions were later exposed to different aeration condi-tions, using air or nitrogen fluxes. The electrochemical behavior of the different biocathodes was characterized by chronoamperometry (CA) and cyclic voltammetry (CV). The structures of the biofilms developed on the electrodes were imaged by epifluorescence microscopy. 2. Experimental
2.1. Experimental medium: garden compost leachate
The leachate used as medium and source of electroactive microor-ganisms was produced from commercially available garden compost (Eco-Terre) using the method described elsewhere[26]. The leachate was supplemented with 20 mM KCl in order to insure a minimum con-ductivity (4 mS·cm− 1). Its initial pH was 7.8.
2.2. Electrochemical set-up and tests
The electrochemical reactors were designed from Schott bottles, filled with 650 mL garden compost leachate, which left around 40 mL gas headspace. The reactors were closed by four-hole caps. Three holes were used to connect the electrodes and the fourth was devolved to the gas supplier. The working electrode was a 6 cm2piece of carbon
cloth (Paxitech, Grenoble, France) connected to a platinum wire. The counter electrode was a 10 cm2platinum grid (Héraeus, France)
con-nected to a platinum wire. Potential was controlled and expressed ver-sus a saturated calomel reference electrode (SCE, E0= 0.24 V/SHE,
Biologic, France), which was regularly checked versus another SCE throughout the experiment. The electrode saturation was maintained by addition of KCl crystals to the electrode compartment to avoid any drift of the potential. Gas supply (air or nitrogen) was achieved with a glass tube ending in a porous fritted glass tip. Gas fluxes were adjusted to produce gentle bubbling. Air supply brought the oxygen concentra-tion up from 5.4 ± 0.3 to 6.5 ± 0.1 mg L− 1. Ten minutes of N
2flux
re-duced the oxygen concentration to below 0.5 mg L− 1. Oxygen
concentration was measured using an optical dissolved oxygen meter (Multi 3410, WTW GmbH, Germany). Temperature in the reactors was maintained at 40 °C using a thermostatic bath. All experiments
Schematic 1. Oxygen reduction half-wave potentials recorded by voltammetry on the reductive scan at neutral pH for various biocathodes described in the literature.
Fig. 1. Chronoamperometries at −0.2 V/SCE (+0.04 V/SHE) recorded with (black) and without (gray) forced aeration in the electrochemical reactor. Encroachments in the records were caused by interruption of polarization for CV recording.
were performed at least in duplicate. For clarity, only one set of data per experiment is presented below.
Electrochemical experiments were carried out using a multichannel potentiostat and the EC-Lab software (Biologic, France). OR-biocathodes were designed under polarization (chronoamperometry, CA) at −0.2 V/ SCE (+0.04 V/SHE), a potential high enough to develop both low- and high-potential signals[15]. Punctually, biocathode polarization was stopped for 30 min to allow the biocathodes to reach a stable open cir-cuit potential (OCP) before cyclic voltammetry (CV) was performed. CVs were recorded from OCP up to 0.4 V/SCE and then down to − 0.7 V/SCE, at a scan rate of 1 mV s− 1. Each CV recording consisted of three successive scans, which were generally identical. For clarity, only the second scans are presented here. CVs were recorded at t = 0, prior to biofilm establishment, and at the end of the experiments with new, uncolonized electrodes, which served as abiotic controls.
2.3. Epifluorescence imaging
The electrodes were extracted from the reactors and washed care-fully with sterile physiological water to remove all soluble and solid ma-terials except the attached biofilms. Bioelectrodes were stained with 0.03% acridine orange (A6014, Sigma) for 10 min, rinsed with sterile physiological water and then left to dry at room temperature. Biofilms were imaged with a Carl Zeiss Axio Imager-M2 microscope equipped for epifluorescence with an HXP 200 C light source and the Zeiss 09 filter (excitor HP450e 490, reflector FT 10, barrier filter LP520). Images were acquired with a digital camera (Zeiss AxioCam MRm) every 0.5 μm along the Z-axis and the set of images was processed with the Zen® software. The biovolume was calculated by the automated image analy-sis of the Zen® software on an acquisition stack that was representative of the colonization observed at various locations of the electrode surface.
3. Results and discussion
3.1. Effect of permanent air flux 3.1.1. Electrochemistry
Chronoamperometries at −0.2 V/SCE (+0.04 V/SHE) were per-formed in parallel in four reactors. Reactors R1 and R2 were run with permanent forced aeration, while reactors R3 and R4 remained under quiescent conditions up to day 20, when forced air flux was introduced (Fig. 1).
Similar mean current densities of −0.029 ± 0.006 and −0.030 ± 0.010 A m− 2were measured initially between day 0 and day 5 whether
the reactors were exposed to forced aeration or not. In the presence of forced aeration, the reduction current density remained barely higher, around −0.038 ± 0.008 A m− 2, up to the end of experiment. In
con-trast, under quiescent conditions, the reduction current started to in-crease strongly after 6.5 days of polarization. A stable maximal current density of −0.31 ± 0.02 A m− 2was reached between day 11 and day
19. Finally, when air was forced into the electrochemical reactor on day 20, the reduction current rose back to its initial value of around − 0.035 A m− 2within 10 h. Two stable but different current densities were thus experienced here, depending on the aeration of the electro-chemical reactor.
The CV recorded with the biocathodes formed under quiescent con-ditions showed a reduction wave around +0.22 V/SCE (+0.46 V/SHE) (noted II onFig. 2). The CV recorded with the same biocathodes after ex-posing them to 24 h forced aeration showed a very different reduction wave, around −0.27 V/SCE (−0.03 V/SHE) (reduction wave noted I onFig. 2). The biocathodes formed under permanent forced aeration displayed similar CV with the reduction wave at −0.28 V/SCE (−0.04 V/SHE) (wave I). The abiotic control CV carried out before the development of the biofilm was different from voltammograms with wave I and wave II. It evidenced their biotic origin.
The shape of wave II – a reduction peak followed by a plateau – was previously observed by researchers working with enzymatic OR-biocathodes under quiescent conditions[14,27]. It was the signature of a mass-transport limited reaction. Similar maximal current densities were observed with waves I and II, around −0.44 A m− 2, indicating that
both waves were limited by oxygen mass transport. The two different kinds of waves, I and II, corresponded to two different redox systems re-sponsible for OR-catalysis and for the two different stable current den-sities evidenced under polarization at +0.04 V/SHE.
3.1.2. Biofilm morphology
The forced aeration of the solution bulk with continuous bubbling of fine gas bubbles induced a shear stress on the electrode surface that had significant impact on their colonization and the morphology of biofilms (Fig. 3).
Under continuous air flux (R1 and R2), electroactive biofilms were diffuse, in the form of dispersed colonies. The cell density was sparse and areas of the carbon fibers making up the carbon cloth electrode were still visible even after 3 full weeks of biofilm development. In con-trast, electroactive biofilms obtained without bubbling (R3 and R4) were much thicker; the carbon fibers were no longer visible in the three-dimensional biofilm images. The determination of biomass quan-tity by image analysis of the z-stack acquisition reported a ratio of 40 be-tween the volume of biofilm (bio-volume) calculated on electrodes R3 and R4 and that calculated on electrodes R1 and R2. In conclusion, the shear stress induced by the forced aeration had a considerable negative impact on the colonization of the carbon cloth electrodes.
3.2. Effects of air and N2fluxes
Four OR-biocathodes were developed in independent electrochemi-cal reactors under quiescent conditions. After 12 days of polarization, when the chronoamperometric response was maximal, two reactors were exposed to air flux for 24 h and the other two to nitrogen flux for 3 h (Fig. 4). Both gas fluxes led to a fast decrease in the reduction current.
Stationary electrochemical responses of the OR-biocathodes before gas bubbling were mostly identical, each displaying −0.166 ± 0.009 A m− 2between days 10 and 12. The current was mainly due to
redox system II, which was the only system detected on CV performed at this time (red CVs,Fig. 5).
When nitrogen gas was forced into the medium (Fig. 4, gray line), re-ductive current density immediately fell to zero and neither system I nor system II was detected by CV as long as the bubbling lasted, because oxygen was completely chased out of the medium (Fig. 5A, gray line
Fig. 2. Characterization of the biocathodes by cyclic voltammetry at 1 mV s−1. Red curve:
CV of the biocathode formed under permanent forced aeration (reactors R1 and R2) at the end of experiment (day 21). Air flux was stopped just during CV recording. The two blue curves were recorded with the biocathodes formed in quiescent conditions (reactors R3 and R4) before (plain blue curve) and after (dotted blue curve) aeration had been applied for 24 h between days 20 and 21. Control voltammograms (black dotted line) were recorded at the beginning of the experiments before polarization started.
CV). This confirmed that both systems catalyzed oxygen reduction. When the nitrogen flux stopped, oxygen reduction resumed immedi-ately (Fig. 4, gray line), producing a current density of −0.025 A m− 2
that corresponded to the redox activity of system I only (Fig. 5A, blue line CV). The presence of system II was not detected on CV immediately after N2flux was stopped. The chronoamperometry showed that it
started to produce current again only later, after day 15.
When air was flushed through the medium (Fig. 4, black line), OR current density at + 0.04 V/SHE was immediately enhanced, to − 0.35 A m− 2for a few minutes, due to oxygen concentration increase and the higher convection. This enhancement was transient and the re-duction current density decreased thereafter as the forced aeration con-tinued. It stabilized at around −0.05 A m− 2
after the air flux stopped. CV recorded when quiescent conditions resumed revealed that the re-duction current was due to the activity of redox system I alone (Fig. 5B, blue curve). Oxygen reducing activity of system II progressively re-sumed from day 15, as visible on the CV recorded at the end of the ex-periment (green line inFig. 5B).
3.3. Discussion
The two redox systems evidenced here corresponded well with the two signals previously experienced by[15]. Their respective character-istics fitted those of low- and high-potential signals shown in the liter-ature (see introduction). Redox system I, observed around −0.27 V/ SCE (−0.03 V/SHE), demonstrated similar behavior to low-potential signals: fast development and a relative independence from the poten-tial at which the biocathode was formed[15]. A contrario, redox system II, observed around +0.22 V/SCE (+0.46 V/SHE), needed more polari-zation time to establish itself (up to 10 days) and to show an electro-chemical response.
Neither of the two systems displayed an electrochemical response during nitrogen flux, which confirmed that they were both related to oxygen reduction (Figs. 4 and 5A). However, they behaved differently under air flux. The air flux never altered the signal produced by redox system I, which showed OR-activity under permanent air supply (Figs. 1 and 2). This system demonstrated an enduring OR-activity when air was supplied in reactors previously conditioned in quiescent conditions (Figs. 4 and 5B). The OR-signal due to system II was observed only under quiescent conditions and, after a brief enhancement, it vanished when air was supplied in the reactors (Figs. 1, 2, 4 and 5B). Forced aeration brought more oxygen into the reactor and enhanced signal II for a brief moment but it ultimately led to its extinction. Due to its oxidative properties, oxygen at high concentrations could be toxic for microbial cells. However, its concentration only changed from 5.4 ± 0.3 to 6.5 ± 0.1 mg L− 1during air flux, and this moderate increase is unlikely
to have been responsible for the loss of signal II through oxygen toxicity. Forced aeration induced shear forces on the electrode surface, which impacted the electrode colonization (Fig. 3). Shear forces are known to strongly influence the settlement, the structure and the morphology of biofilms[28,29]. Other studies on the formation of biofilms from natural consortia or pure microbial strains under various hydrodynamic condi-tions have shown that the thickness, the amount of fixed biomass, the nature and amount of exopolymeric substances produced and the dis-tribution of bacterial colonies vary widely depending on the shear mode applied[30,31]. It is generally agreed that the greater the physical
Fig. 3. Epifluorescence microscopy of biocathodes formed under constant polarization at −0.2 V/SCE (+0.04 V/SHE) under quiescent conditions or forced aeration.
Fig. 4. Chronoamperograms at −0.2 V/SCE (+0.04 V/SHE) recorded under quiescent conditions and exposed to air (black) and nitrogen (gray) bubbling on day 12. Cyclic voltammetries were recorded before, during and immediately after forced gas fluxes, and at the end of experiment on day 23, after gas flux had been stopped for several days.
force applied to the biofilm is, the more resistant, compact and thin the biofilm becomes[32,33]. Under high shear stress, biofilm detachment could occur via erosion, resulting in thinner biofilms that are rather smooth and rich in microbial cells in the colonized areas. Here, such a phenomenon of biofilm erosion should impact redox systems I and II similarly. If erosion was responsible for the disappearance of system II observed under forced aeration, it would similarly cause the destruction of system I. Consequently, biofilm erosion cannot explain the behavior of the biocathodes under forced aeration.
The most likely explanation of the difference between the two redox system behaviors is that they constituted two different mechanisms for external electron transfer (EET) from the electrode to oxygen. Different types of EET mechanisms from cathodes to various final electron accep-tors were reported in the literature reviewed by Rosenbaum et al.[34]. The CV characteristics of system I were very close to those previously reported by Blanchet et al., who worked with the same inoculum (com-post leachate) and polarization potential (+0.04 V/SHE)[25]. Actually, system I characteristics were similar to many low-potential signals re-ported in other works performed with other media and/or inocula[24, 22,21]. The voltammograms presented in these works showed charac-teristics (potential, current density, fast development even without po-larization) that may link them to redox system I observed here. Parot et al. demonstrated a close similarity between CVs recorded with
marine bacterial strains and those of an iron porphyrin adsorbed on the electrode surface[24]. Iron porphyrins are redox molecular sub-structures present in numerous proteins such as cytochromes. Cyto-chromes have been proven to achieve direct external electron transfer between bacteria and electrodes[35]. They are generally anchored in cellular membranes and are consequently not removed from the biofilm by hydrodynamic effects. Therefore, all these observations led us to pos-tulate that redox system I may be related to membrane-bound cytochromes.
Another known EET pathway relies on the secretion of soluble medi-ators used for shuttling electrons. A large variety of bacterial extracellu-lar redox mediators have been identified in both bioanodes and biocathodes. Among them are phenazines such as piocyanine[36], fla-vin derivatives such as riboflafla-vin [37], or quinones such as pirroloquinoline quinone and 2-amino-3-dicarboxy-1,4-naphtoquinone[20,38]. Such molecules are usually locally concentrated inside the biofilm, which ensures proximity between bacteria and elec-trodes and facilitates the electrochemical transfer. The soluble media-tors are subjected to mass transport; they can be dispersed in the bulk in presence of increased hydrodynamic forces and thus lose the possi-bility to play their electron mediator function. As redox system II behav-ior fitted this description in all respects, it probably corresponded to a diffusible extracellular redox mediator that was poorly linked to the bio-film and was easily released to the bulk by hydrodynamic conditions.
The nature of the soluble redox mediator postulated here for system II cannot be enlarged to all similar high-potential systems reported in the literature, because they have shown different sensitivities to the hy-drodynamics. The high-potential system observed by Desmond-Le Quemener et al. using the same inoculum (compost leachate) was not sensitive to hydrodynamics[15]. This difference may have come from the higher polarization potential they used to form their biocathode (+ 0.34 V instead of + 0.04 V/SHE), which may have resulted in selecting other electron exchange pathways between electrode and bio-film. Xia et al. used a continuously-fed electrochemical cell with forced aeration to form the biocathode, but prevented problems caused by the hydrodynamic conditions by interposing a plastic plate in the ca-thodic compartment[6,5]. Ter Heijne et al. used an electrochemical cell in continuous mode[8]. This operating mode may imply a certain degree of shear stress on the cathode surface, but it did not impact the electrochemical behavior of their system. Moreover, increasing the flow rate from 0 to 21 L h− 1led to increased current densities for OR
from 40 to 270 mA m− 2. Strycharz-Glaven et al. identified the presence
of immobilized cofactors inside the biofilms, which achieved a direct, non-mediated EET[10].
Due to its higher redox potential, system II is of greater interest than system I if the objective is to design efficient OR-biocathodes for MFC applications. The results presented here, and the past works referred to, recall that high potential oxygen reductive systems are observed when rather high polarization potentials are applied to form the OR-biocathodes. This highlights the benefit of designing OR-biocathodes under polarization. However, as reflected by the discussion above, the nature of redox system II may hinder the development of practical ap-plications. Its sensitivity to turbulence may restrict its application to sys-tems in which quiescent conditions are ensured. Continuous flow MFCs, for example, may be suitable provided that high retention time and low flow rate are used to mitigate the possible release of the redox mediator from the biofilm. Precautions as implemented by Xia et al., i.e. a plastic plate interposed between the aeration source and the biocathode, would certainly be of interest[6,5]. The use of a small-volume cathodic compartment in order to limit the dilution effect of the mediator in the solution bulk would also merit attention.
4. Conclusions
Oxygen-reduction biocathodes formed from compost leachate under constant polarization at + 0.04 V/SHE showed two different
Fig. 5. Cyclic voltammograms recorded with reactors exposed to nitrogen (A) or air (B) fluxes. Red and blue CVs were recorded before and after gas fluxes respectively. Green CVs were recorded at the end of experiment. Gray CV (Fig. 6a) was recorded during N2supply. Corresponding abiotic control CVs are available in supplementary data
redox systems linked to oxygen reduction. A low-potential system (I) was detected in all biocathodes, whatever the experimental condi-tions, and ensured a basal oxygen reduction activity. A high-potential system (II) developed only under quiescent conditions and vanished when the solution was stirred. In the light of the literature, system I was probably a cytochrome derived compound, firmly attached in the biofilm. System II behavior was characteristic of a soluble redox media-tor, the chemical nature of which remains to be determined. Its solubil-ity made it sensitive to turbulence inside the reactor. This work shows that implementing efficient oxygen-reducing biocathodes in MFCs re-quires careful control of the local hydrodynamics in order to favor the development of the high-potential redox system.
Acknowledgments
This work was part of the BioCathInox project, funded by the French ANR (ANR-11-JS09-016-01).
Appendix A. Supplementary data
Supplementary data to this article can be found online athttp://dx. doi.org/10.1016/j.bioelechem.2016.03.002.
References
[1] S.V. Mohan, G. Velvizhi, J.A. Modestra, S. Srikanth, Microbial fuel cell: critical factors regulating bio-catalyzed electrochemical process and recent advancements, Renew. Sust. Energ. Rev. 40 (2014) 779–797,http://dx.doi.org/10.1016/j.rser.2014.07.109. [2] L. Huang, J.M. Regan, X. Quan, Electron transfer mechanisms, new applications, and
performance of biocathode microbial fuel cells, Bioresour. Technol. 102 (2011) 316–323.
[3] B. Erable, D. Feron, A. Bergel, Microbial catalysis of the oxygen reduction reaction for microbial fuel cells: a review, ChemSusChem 5 (2012) 975–987,http://dx.doi.org/ 10.1002/cssc.201100836.
[4] M. Rothballer, M. Picot, T. Sieper, J.B.A. Arends, M. Schmid, A. Hartmann, et al., Monophyletic group of unclassified gamma-proteobacteria dominates in mixed cul-ture biofilm of high-performing oxygen reducing biocathode, Bioelectrochemistry Amst. Neth. 106 (2015) 167–176,http://dx.doi.org/10.1016/j.bioelechem.2015.04. 004.
[5] X. Xia, J.C. Tokash, F. Zhang, P. Liang, X. Huang, B.E. Logan, Oxygen-reducing biocathodes operating with passive oxygen transfer in microbial fuel cells, Environ. Sci. Technol. 47 (2013) 2085–2091,http://dx.doi.org/10.1021/es3027659. [6] X. Xia, Y. Sun, P. Liang, X. Huang, Long-term effect of set potential on biocathodes in
microbial fuel cells: electrochemical and phylogenetic characterization, Bioresour. Technol. 120 (2012) 26–33,http://dx.doi.org/10.1016/j.biortech.2012.06.017. [7] A. Ter Heijne, O. Schaetzle, S. Gimenez, F. Fabregat-Santiago, J. Bisquert, D.P.B.T.B.
Strik, et al., Identifying charge and mass transfer resistances of an oxygen reducing biocathode, Energy Environ. Sci. 4 (2011) 5035–5043,http://dx.doi.org/10.1039/ c1ee02131a.
[8] A. Ter Heijne, D.P.B.T.B. Strik, H.V.M. Hamelers, C.J.N. Buisman, Cathode potential and mass transfer determine performance of oxygen reducing biocathodes in mi-crobial fuel cells, Environ. Sci. Technol. 44 (2010) 7151–7156,http://dx.doi.org/10. 1021/es100950t.
[9] S. Debuy, S. Pecastaings, A. Bergel, B. Erable, Oxygen-reducing biocathodes designed with pure cultures of microbial strains isolated from seawater biofilms, Int. Biodeterior. Biodegrad. 103 (2015) 16–22,http://dx.doi.org/10.1016/j.ibiod.2015. 03.028.
[10] S.M. Strycharz-Glaven, R.H. Glaven, Z. Wang, J. Zhou, G.J. Vora, L.M. Tender, Electro-chemical investigation of a microbial solar cell reveals a nonphotosynthetic biocathode catalyst, Appl. Environ. Microbiol. 79 (2013) 3933–3942,http://dx.doi. org/10.1128/AEM.00431-13.
[11] B. Erable, I. Vandecandelaere, M. Faimali, M.-L. Delia, L. Etcheverry, P. Vandamme, et al., Marine aerobic biofilm as biocathode catalyst, Bioelectrochemistry 78 (2010) 51–56,http://dx.doi.org/10.1016/j.bioelechem.2009.06.006.
[12] M. Faimali, E. Chelossi, G. Pavanello, A. Benedetti, I. Vandecandelaere, P. De Vos, et al., Electrochemical activity and bacterial diversity of natural marine biofilm in laboratory closed-systems, Bioelectrochemistry 78 (2010) 30–38,http://dx.doi. org/10.1016/j.bioelechem.2009.04.012.
[13] I. Vandecandelaere, O. Nercessian, M. Faimali, E. Segaert, A. Mollica, W. Achouak, et al., Bacterial diversity of the cultivable fraction of a marine electroactive biofilm, Bioelectrochemistry 78 (2010) 62–66,http://dx.doi.org/10.1016/j.bioelechem. 2009.07.004.
[14] A. Bergel, D. Feron, A. Mollica, Catalysis of oxygen reduction in PEM fuel cell by sea-water biofilm, Electrochem. Commun. 7 (2005) 900–904,http://dx.doi.org/10.1016/ j.elecom.2005.06.006.
[15] E. Desmond-Le Quéméner, M. Rimboud, A. Bridier, C. Madigou, B. Erable, A. Bergel, et al., Biocathodes reducing O2at high potential select biofilms dominated by
Ectothiorhodospiraceae populations harboring a specific association of genes, (Sub-mitted manuscript).
[16] Z. Chen, Y. Huang, J. Liang, F. Zhao, Y. Zhu, A novel sediment microbial fuel cell with a biocathode in the rice rhizosphere, Bioresour. Technol. 108 (2012) 55–59,http://dx. doi.org/10.1016/j.biortech.2011.10.040.
[17] K. Rabaey, S.T. Read, P. Clauwaert, S. Freguia, P.L. Bond, L.L. Blackall, et al., Cathodic oxygen reduction catalyzed by bacteria in microbial fuel cells, Isme J. 2 (2008) 519–527,http://dx.doi.org/10.1038/ismej.2008.1.
[18] S. Carbajosa, M. Malki, R. Caillard, M.F. Lopez, F.J. Palomares, J.A. Martin-Gago, et al., Electrochemical growth of Acidithiobacillus ferroxidans on a graphite electrode for obtaining a biocathode for direct electrocatalytic reduction of oxygen, Biosens. Bioelectron. 26 (2010) 877–880.
[19] M. Rimboud, E. Desmond-Le Quemener, B. Erable, T. Bouchez, A. Bergel, The current provided by oxygen-reducing microbial cathodes is related to the composition of their bacterial community, Bioelectrochemistry 102 (2015) 42–49,http://dx.doi. org/10.1016/j.bioelechem.2014.11.006.
[20] S. Freguia, S. Tsujimura, K. Kano, Electron transfer pathways in microbial oxygen biocathodes, Electrochimica Acta 55 (2010) 813–818,http://dx.doi.org/10.1016/j. electacta.2009.09.027.
[21] A. Cournet, M.-L. Delia, A. Bergel, C. Roques, M. Berge, Electrochemical reduction of oxygen catalyzed by a wide range of bacteria including gram-positive, Electrochem. Commun. 12 (2010) 505–508,http://dx.doi.org/10.1016/j.elecom.2010.01.026. [22] A. Cournet, M. Berge, C. Roques, A. Bergel, M.-L. Delia, Electrochemical reduction of
oxygen catalyzed by Pseudomonas aeruginosa, Electrochimica Acta. 55 (2010) 4902–4908,http://dx.doi.org/10.1016/j.electacta.2010.03.085.
[23] F. Xu, J. Duan, B. Hou, Electron transfer process from marine biofilms to graphite electrodes in seawater, Fundam. Microb. Power Plants Electrochem. Act. Biofilms 78 (2010) 92–95,http://dx.doi.org/10.1016/j.bioelechem.2009.09.010.
[24] S. Parot, I. Vandecandelaere, A. Cournet, M.-L. Délia, P. Vandamme, M. Bergé, et al., Catalysis of the electrochemical reduction of oxygen by bacteria isolated from electro-active biofilms formed in seawater, Bioresour. Technol. 102 (2011) 304–311.
[25] E. Blanchet, S. Pécastaings, B. Erable, C. Roques, A. Bergel, Protons accumulation dur-ing anodic phase turned to advantage for oxygen reduction durdur-ing cathodic phase in reversible bioelectrodes, Bioresour. Technol. 173 (2014) 224–230,http://dx.doi.org/ 10.1016/j.biortech.2014.09.076.
[26] B. Cercado, N. Byrne, M. Bertrand, D. Pocaznoi, M. Rimboud, W. Achouak, et al., Gar-den compost inoculum leads to microbial bioanodes with potential-indepenGar-dent characteristics, Bioresour. Technol. 134 (2013) 276–284.
[27] J. Urban, A. Zloczewska, W. Stryczniewicz, M. Jönsson-Niedziolka, Enzymatic oxygen reduction under quiescent conditions — the importance of convection, Electrochem. Commun. 34 (2013) 94–97,http://dx.doi.org/10.1016/j.elecom.2013.05.030. [28] J.W. Costerton, Introduction to biofilm, Int. J. Antimicrob. Agents 11 (1999)
217–221,http://dx.doi.org/10.1016/S0924-8579(99)00018-7.
[29] J.-C. Ochoa, C. Coufort, R. Escudié, A. Liné, E. Paul, Influence of non-uniform distribu-tion of shear stress on aerobic biofilms, Chem. Eng. Sci. 62 (2007) 3672–3684,
http://dx.doi.org/10.1016/j.ces.2007.03.023.
[30] D. Celmer, J.A. Oleszkiewicz, N. Cicek, Impact of shear force on the biofilm structure and performance of a membrane biofilm reactor for tertiary hydrogen-driven deni-trification of municipal wastewater, Water Res. 42 (2008) 3057–3065,http://dx.doi. org/10.1016/j.watres.2008.02.031.
[31] P. Stoodley, Z. Lewandowski, J.D. Boyle, H.M. Lappin-Scott, Oscillation characteristics of biofilm streamers in turbulent flowing water as related to drag and pressure drop, Biotechnol. Bioeng. 57 (1998) 536–544, http://dx.doi.org/10.1002/(SICI)1097-0290(19980305)57:5b536::AID-BIT5N3.0.CO;2-H.
[32] W.K. Kwok, C. Picioreanu, S.L. Ong, M.C.M. van Loosdrecht, W.J. Ng, J.J. Heijnen, Influ-ence of biomass production and detachment forces on biofilm structures in a biofilm airlift suspension reactor, Biotechnol. Bioeng. 58 (1998) 400–407,http://dx.doi.org/ 10.1002/(SICI)1097-0290(19980520)58:4b400::AID-BIT7N3.0.CO;2-N.
[33] L.F. Melo, M.J. Vieira, Physical stability and biological activity of biofilms under tur-bulent flow and low substrate concentration, Bioprocess Eng. 20 (1999) 363–368, ,http://dx.doi.org/10.1007/s004490050604.
[34] M. Rosenbaum, F. Aulenta, M. Villano, L.T. Angenent, Cathodes as electron donors for microbial metabolism: which extracellular electron transfer mechanisms are in-volved? Spec. Issue Biofuels - II Algal Biofuels Microb. Fuel Cells 102 (2011) 324–333,http://dx.doi.org/10.1016/j.biortech.2010.07.008.
[35] H. Richter, K.P. Nevin, H. Jia, D.A. Lowy, D.R. Lovley, L.M. Tender, Cyclic voltammetry of biofilms of wild type and mutant geobacter sulfurreducens on fuel cell anodes in-dicates possible roles of OmcB, OmcZ, type IV pili, and protons in extracellular elec-tron transfer, Energy Environ. Sci. 2 (2009) 506–516,http://dx.doi.org/10.1039/ b816647a.
[36]A. Venkataraman, M. Rosenbaum, J.B.A. Arends, R. Halitschke, L.T. Angenent, Quo-rum sensing regulates electric current generation of Pseudomonas aeruginosa PA14 in bioelectrochemical systems, Electrochem. Commun. 12 (2010) 459–462.
[37] E. Marsili, D.B. Baron, I.D. Shikhare, D. Coursolle, J.A. Gralnick, D.R. Bond, Shewanella secretes flavins that mediate extracellular electron transfer, Proc. Natl. Acad. Sci. U. S. A. 105 (2008) 3968–3973.
[38] S. Freguia, M. Masuda, S. Tsujimura, K. Kano, Lactococcus lactis catalyses electricity generation at microbial fuel cell anodes via excretion of a soluble quinone, Bioelectrochemistry 76 (2009) 14–18,http://dx.doi.org/10.1016/j.bioelechem. 2009.04.001.