HAL Id: inria-00617547
https://hal.inria.fr/inria-00617547
Submitted on 29 Aug 2011
HAL is a multi-disciplinary open access
archive for the deposit and dissemination of
sci-entific research documents, whether they are
pub-lished or not. The documents may come from
teaching and research institutions in France or
abroad, or from public or private research centers.
L’archive ouverte pluridisciplinaire HAL, est
destinée au dépôt et à la diffusion de documents
scientifiques de niveau recherche, publiés ou non,
émanant des établissements d’enseignement et de
recherche français ou étrangers, des laboratoires
publics ou privés.
PORGY: Interactive and Visual Reasoning with Graph
Rewriting Systems
Bruno Pinaud, Jonathan Dubois, Guy Melançon
To cite this version:
Bruno Pinaud, Jonathan Dubois, Guy Melançon.
PORGY: Interactive and Visual
Reason-ing with Graph RewritReason-ing Systems.
Conf.
on Visual Analytics Science and Technology
(VAST), 2011 IEEE (Poster Abstract), Oct 2011, Providence, United States. pp.293-294, 2011,
�10.1109/VAST.2011.6102480�. �inria-00617547�
PORGY: Interactive and Visual Reasoning with Graph Rewriting Systems
Bruno Pinaud, Jonathan Dubois and Guy Melançon∗ University of Bordeaux and INRIA Bordeaux Sud-Ouest, France
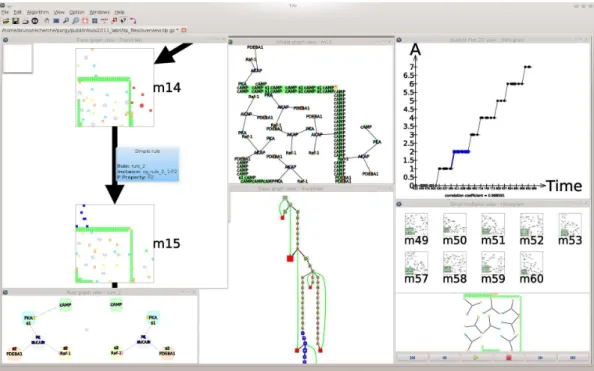
Figure 1: Overview of the PORGY graph rewriting framework allowing end-users (here biologists) to explore, study and simulate a model for biochemical calculus. Graphs describing the states and bindings of molecules are being transformed through the application of rewriting rules. The simulation is driven from the visualization, where rules are seen as elementary programming instructions.
Graph rewriting systems are easily described and explained. They can be seen as a game where one iterates transformation rules on an initial graph, until some condition is met. A rule describes a local pattern (i.e. a subgraph) that must be identified in a graph and specifies how to transform this subgraph. The graph rewriting formalism is at the same time extremely rich and complex, making the study of a model expressed in terms of graph rewriting quite challenging. For instance, predicting whether rules can be applied in any order is often difficult. When modelling complex systems, graphical formalisms have clear advantages: they are more intu-itive and make it easier to visualize a system and convey intuitions about it. This work focuses on the design of an interactive visual graph rewriting system which supports graphical manipulations and computation to reason and simulate on a system. PORGY has been designed based on regular exchanges with graph rewriting systems experts and users over the past three years. The design choices relied on a careful methodology inspired from Munzner’s nested
∗
E-mail: {bruno.pinaud, jonathan.dubois, guy.melancon}@labri.fr. This work was funded through the INRIA’s Associate Team Porgy (see http: //gravite.labri.fr/?Projects_%2F_Grants:Porgy) in col-laboration with King’s College London and by a grant from the French Na-tional Research Agency (EVIDEN project, ANR-10-JCJC-0201).
process model for visualization design and validation [4].
1 GRAPHREWRITINGBASICS
Each available or allowed modification (topology, node/edge’s at-tributes) on a given graph G is called a rewriting rule. It cap-tures the knowledge of experts about the system they study and describes how a (small) subgraph of G can be modified or rewrit-ten. More complex modifications are realized by combining se-quence of rules into expressions with various operators affecting rules applications called rewriting strategies. Strategies specify which/how/when/where rules apply (see [5] for more details). For-mally speaking, a rewriting rule is of the form ri: Li→Riwhere
Liand Riare graphs, respectively called the left-hand side (lhs) and
right-hand side (rhs) of the rule ri. Fig. 1 shows an example of such
a rule in the bottom left panel. One of its effect is easily deduced from the drawing: assuming a graph contains a subgraph with five nodes in the given configuration, the edge connecting the blue and green nodes is deleted. The top left panel of Fig. 1 shows an exam-ple of application. Nodes of the subgraph being rewritten are red (top), the nodes of the output subgraph (below) are blue.
2 USERS’ REQUIREMENTS
The first requirement of our users was to be able to graphically design rules. The main challenge is whether the rules adequately model the system’s behavior. As a consequence, the second re-quirement was to be able to easily run a simulation after defining a
rewriting strategy to observe the evolution of the system. The com-puting history of the calculus is managed using a derivation tree (bottom center panel of Fig. 1) which appears as a living scrapbook the user plays with. Its nodes hold all the graphs that can be de-rived by applying rules. Black edges show single rule applications while green curved edges correspond to the application of a strat-egy. Strategies may be applied from any already computed graph to produce a new branch in the tree. For the rest of this paper, the term graph will be reserved to talk about those graphs on which rules are applied, unless stated otherwise. The complexity of the rewriting system is, in a sense, captured within the derivation tree which obviously forms a central object to study the rewriting sys-tem. Needless to say, viewing and manipulating the derivation tree became the next strong priority expressed by our users.
The study of a rewriting system requires to oscillate between lo-cal views (rules, graphs), and a global view of the derivation tree. The main challenge is to understand how the behavior of the system at a global scale emerges from rules specifying how local modifica-tions operate. It is precisely by looking at the graphs in the deriva-tion tree, both at a local and global scale, that a domain expert can judge of the model’s adequacy or check postulated properties.
3 CASESTUDY: BIOCHEMICALNETWORK
We show how to use PORGY for modelling and reasoning about a biochemical network composed of different types of molecules at different concentrations who interact to maintain a regulation mech-anism. The biologists’ challenge is to come up with a model for the dynamic of molecules to explain this mechanism. Knowledge gained from (wet)lab experiments suggests: 1) the overall process is controlled through only four chemical reactions and 2) the regu-lation works if there is alternating short periods of time where the concentration of a specific molecule called A increases, and oth-ers where it remains constant [1]. Graph rewriting appears as a natural device to build the model. At each time step, the state of the biological system is given as a graph where nodes correspond to molecules and edges correspond to physical bindings that took place. The chemical reactions are described as rewriting rules.
First, rules and the initial graph G are drawn and laid out us-ing a visual graph editor. Next, after combinus-ing the rewritus-ing rules into a strategy, the biologists can apply it to simulate this in silico biological system. The applicability of a strategy is computed in real-time to provide a visual feedback. Finally, the overall behav-ior of the system requires to be validated, by for instance making a plot of the evolution of the concentration of A molecules. The staircase shape of the plot (the top right panel of Fig. 1) confirms that the rules (biochemical reactions), the strategy (conditions) and the initial molecule concentration combine well to reproduce the expected behavior. Now, since all PORGY views are synchronized and because nodes are embedded into the plot, the user may select (in blue) part of the plot and query the derivation tree to visualize the time at which a given state is reached. Generally speaking, to ease the work of the user, most of the interactions are visual and interactive. We use drag and drop operations as often as possible.
4 IMPLEMENTATIONDETAILS
Porgy is built on top of the Graph Visualization framework Tulip [2]. A first difficulty comes from the capability of showing a compound derivation tree. The tree acts as a top level structure, and nodes of the tree themselves contain graphs (on which rules apply). The tree structure encapsulates the computation history, where each branch is induced from a sequence of rule applications. Each node must therefore refer to a graph resulting from the application of a rule on its parent graph. Each edge stores the necessary information to recover the rule that was applied. In a sense, the paradigm we are dealing with is that of a dynamic graph which evolves in many ways according to rewriting rules. However, on the data structure level,
we must have access to every single graph that was derived from the original graph. This imposes that all graphs derived from the initial graph share nodes, edges and their respective attributes to insure coherence and achieve scalability.
One basic task the system needs to perform is to find instances of the lhs of a rule. Indeed, applying a rule r : L → R to a graph G requires that we first identify a sub-graph H ⊂ G that is isomorphic to L. Hence, a rule r applies to a graph G if there exists at least a subgraph H ⊂ G such that L is isomorphic to H. Now, although the subgraph isomorphism problem is known to be NP-Complete over the class of unlabelled graphs, it becomes tractable in our case be-cause we deal with labelled graphs. The implemented algorithm is inspired from [3]. Subgraph isomorphism search is also triggered to contract the derivation tree into a quotient graph after isomor-phic graphs are merged into a single node, called a metanode, and the edges are induced from edges of the derivation tree. As a con-sequence, the quotient graph may for instance contain cycles (the system returns to a previous state) or multiples black edges may point to the same metanode (local confluence).
Although the graphs are drawn using a force-directed layout, they may need to be drawn according to specific graphical conven-tions. As a consequence, our system can use any layout algorithm thanks to the Tulip plug-ins system. The layout of rules also re-quired some attention. Most authors in graph rewriting theory use symmetry as a central aesthetics to emphasize the changes operated by a rule. The overall heuristics we implemented is to layout the rhs first to optimize its aesthetics and then try to symmetrically match the lhs as much as possible. Finally, care must be taken to draw the derivation tree. Although we referred to it as a tree, the presence of green edges for strategies turns it into a directed acyclic graph. Thus, we use a Sugiyama-typed [6] layout where each node is being assigned to a layer coinciding with its depth in the tree.
5 CONCLUSION ANDFUTUREWORKS
This work took place within the context of a project involving end-users and computer scientists. This opportunity allowed us to run several interviews and observe actual uses of early prototypes to converge towards domain problems characterization, and for choos-ing specific views and interactions to support tasks identified in ear-lier phases of the work. The PORGY framework is available to the graph rewriting community since about a year and we may expect users to provide more feedback and suggest improvements. We al-ready have identified a variety of issues that need to be studied like dynamic graph drawing for graphs as they evolve through a multi-scenario scheme just as if a same graph would be part of different sequences of time stamped graphs. PORGY should also soon mi-grate towards other application domains.
REFERENCES
[1] O. Andrei and M. Calder. A Model and Analysis of the AKAP Scaffold. In J. Krivine and A. Troina, editors, Elec. Notes in Theo. Computer Science (Proc. of CS2Bio’10), volume 268, pages 3–15, 2010. [2] D. Auber. Tulip - a huge graph visualization framework. In P. Mutzel
and M. Jünger, editors, Graph Drawing Software, Mathematics and Vi-sualization Series. Springer Verlag, 2003.
[3] L. P. Cordella, P. Foggia, C. Sansone, and M. Vento. A (sub)graph iso-morphism algorithm for matching large graphs. IEEE Trans. on Pattern Analysis and Machine Intelligence, 26(10):1367–1372, 2004. [4] T. Munzner. A nested process model for visualization design and
vali-dation. IEEE Trans. on Visualization and Computer Graphics, 15:921– 928, 2009.
[5] O. Namet, M. Fernandez, and H. Kirchner. A strategy language for graph rewriting. In Logic-Based Program Synthesis and Transforma-tion, (LOPSTR 2011), 2011. To appear.
[6] K. Sugiyama, S. Tagawa, and M. Toda. Methods for visual understand-ing of hierarchical systems structures. IEEE Transactions on Systems, Man and Cybernetics, 11(2):109–125, 1981.