Publisher’s version / Version de l'éditeur:
Energy and Buildings, 35, June 5, pp. 441-461, 2003-06-01
READ THESE TERMS AND CONDITIONS CAREFULLY BEFORE USING THIS WEBSITE. https://nrc-publications.canada.ca/eng/copyright
Vous avez des questions? Nous pouvons vous aider. Pour communiquer directement avec un auteur, consultez la
première page de la revue dans laquelle son article a été publié afin de trouver ses coordonnées. Si vous n’arrivez pas à les repérer, communiquez avec nous à [email protected].
Questions? Contact the NRC Publications Archive team at
[email protected]. If you wish to email the authors directly, please see the first page of the publication for their contact information.
NRC Publications Archive
Archives des publications du CNRC
This publication could be one of several versions: author’s original, accepted manuscript or the publisher’s version. / La version de cette publication peut être l’une des suivantes : la version prépublication de l’auteur, la version acceptée du manuscrit ou la version de l’éditeur.
Access and use of this website and the material on it are subject to the Terms and Conditions set forth at
Energy performance of daylight-linked automatic lighting control
systems in large atrium spaces: report on two field-monitored case
studies
Atif, M. R.; Galasiu, A. D.
https://publications-cnrc.canada.ca/fra/droits
L’accès à ce site Web et l’utilisation de son contenu sont assujettis aux conditions présentées dans le site LISEZ CES CONDITIONS ATTENTIVEMENT AVANT D’UTILISER CE SITE WEB.
NRC Publications Record / Notice d'Archives des publications de CNRC:
https://nrc-publications.canada.ca/eng/view/object/?id=939e5954-e3cb-472a-bded-f0dd5786dec8 https://publications-cnrc.canada.ca/fra/voir/objet/?id=939e5954-e3cb-472a-bded-f0dd5786dec8
Energy performance of daylight-linked automatic
lighting control systems in large atrium spaces:
report on two field-monitored case studies
Atif, M.R.; Galasiu, A.D.
A version of this document is published in / Une version de ce document se trouve dans : Energy and Buildings, v. 35, no. 5, June 2003, pp. 441-461
www.nrc.ca/irc/ircpubs
ENERGY PERFORMANCE OF DAYLIGHT-LINKED AUTOMATIC LIGHTING CONTROL SYSTEMS IN LARGE ATRIUM SPACES:
REPORT ON TWO FIELD-MONITORED CASE STUDIES
Morad R. Atif and Anca D. Galasiu*
Indoor Environment Research Program
Institute for Research in Construction
National Research Council Canada
1200 Montreal Road,
Ottawa, Ontario,
Canada, K1A 0R6
*Corresponding author
Fax: +1 613 954 3733
ABSTRACT
This paper presents the field-measured energy performance of two common types of daylight-linked
lighting control systems, continuous dimming and automatic on/off installed in two existing large
atrium spaces located in Canada. The daylighting performance was evaluated based on the daylight
contribution to the indoor illuminance and the amount of electrical lighting displaced by daylighting via
the daylight-linked lighting control systems. Measured daylighting contribution to the space indicates
that significant lighting energy savings can be achieved in atrium spaces if the daylight-linked lighting
control system is appropriately selected, installed and commissioned throughout its existence.
Results extrapolated from measurements collected during summer and winter indicate that as
installed, the continuous dimming lighting control system provides 46% annual savings in electrical
lighting consumption, while the automatic on/off saves between 11-17% in lighting energy. These
savings account for 68% of the lighting energy consumed during main occupancy for the continuous
dimming system, and 31.5% for the automatic on/off. Operation irregularities such as a reduced
dimming linearity and an incorrect adjustment of the phases of the dimming control system, as well
as the inadequate location of the photocell controlling the automatic on/off lighting system, the
improper maintenance of the skylight during winter and the oversizing of the lighting system reduced
the energy efficiency of the lighting control systems by 30-65%.
INTRODUCTION
Daylighting has often been claimed as a source of energy savings in buildings in general, and in
atrium buildings in particular. The hypothesis suggests that there is an abundance of daylight
contribution to the atrium ground floor and into the adjacent spaces that displaces a large portion of
the electric lighting consumption. The purpose of this study was to investigate this hypothesis by
monitoring the daylight contribution and electric lighting consumption of two real atrium buildings, one
equipped with a photocontrolled continuous dimming lighting system and the other equipped with a
Past research1-7 indicates that daylight-linked lighting systems can reduce electric energy
consumption by as much as 30-60%. However, in many cases claimed performance has been
estimated based only on computer modeling or under ideal, controlled conditions, and has not been
substantiated by results obtained in real-life settings with real installers and real occupants. This work
provides information on the real performance of two types of common, commercially available
daylight-linked lighting control systems, as a first step towards the development of guidelines for
proper installation, calibration and operation. Nevertheless, the results of this study should not be
interpreted as a comparison between two different types of lighting control systems mainly because
the buildings in which they are installed are rather different. The main intent of this work was to gather
hard-fact data on the magnitude of the savings that can realistically be expected when incorporating
such systems in real-world applications.
The specific objectives of the study were:
• To evaluate the magnitude of the daylight contribution to the indoor illuminance of the real atrium spaces; no attempt was made to address the measurement of lighting quality performance
indicators, except for the illuminance distribution throughout the space.
• To analyze the performance of the daylight-linked lighting control systems by evaluating the real electrical energy savings generated by the use of such systems in existing atrium buildings that do
not necessarily incorporate specialized daylighting features and design; both lighting control
systems were monitored as originally installed, calibrated and commissioned by the buildings’
design and construction teams.
• To identify procedures to improve the savings potential of the photocontrolled lighting systems. .
DESCRIPTION OF THE CASE STUDIES
Two existing large atrium spaces incorporating photocontrolled electric lighting were selected for the
investigation. One building (Case Study 1) is located in Québec City (latitude 46.48°, longitude 71.23°, altitude 75 m) and incorporates a continuous dimming lighting control system. The other
building (Case Study 2) is located in Ottawa (latitude 45.24°, longitude 75.43°, altitude 125 m) and incorporates an automatic on/off lighting control system.
Description of Case Study 1: Continuous Dimming
The building incorporating the continuous dimming lighting control system is a six-story rectangular
structure with exterior dimensions of 139 x 87 m and a maximum height of 28 m. The monitored
atrium space is located in the center of the building and is primarily used for circulation to different
locations within the building. Walkways surround the atrium and connect to interior offices. The
atrium has a maximum height of 22 m, extending from the ground floor to the fourth floor. The north
and east sides of the space are entirely bordered by offices which extend to one floor higher than the
roof level of the atrium space. The ground floor area of the atrium is 1300 m2 and the total floor area
of the surrounding walkways is 2000 m2. Figure 1 shows a plan view of the ground floor and a
section view of the building through the east-west axis. The monitored atrium is highlighted by the
shaded regions. The walls and ceiling inside the atrium have an estimated reflectance of 50-60%, and
the atrium floor and the walkways surrounding the atrium have an estimated reflectance of 30-45%8.
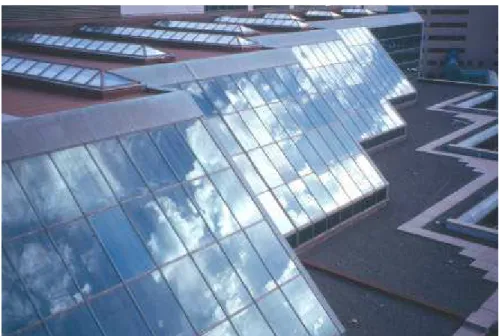
Rows of horizontal glazing of varying lengths run along the east-west width of the atrium roof. Each
row is 1.5 m wide and is separated from the other rows by 7.2 m of roofing. The horizontal glazing
area is about 17% of the total projected roof area and its measured average net-visible transmittance
varied between 3-16% under clear sky, and was 5% under overcast sky. Daylight also enters the
atrium space from a west-facing sloped glazing, which covers open terraces on the west end of the
third floor, and extends up to the ceiling of the atrium space on the fourth floor. Vertical glazing
borders the far-south region of the atrium space at every level. All fenestration is green tinted, double
glazed and has a manufacturer stated visible transmittance of 14%. Figure 2 shows exterior and
interior views of the atrium fenestration.
A total of 646, 40-watt recessed fluorescent fixtures are uniformly distributed along the walkways
three-phase continuous dimming system and are set off between midnight and 7 AM. The lighting
system also includes 56 175-watt mercury lamps located at the atrium perimeter railings on the
ground and second floors. These lights are used to supplement lighting to the atrium floor from 4 PM
to 8 PM and are manually controlled. Several mercury-bulb spotlights are also scattered throughout
the atrium space and are used primarily for decorative purposes. The maximum power consumption
of the three-phase lighting system is 28.9 kW and the lighting power density in the atrium and the
surrounding walkways is 10.8 W/m2.
The photocontrolled continuous dimming lighting system incorporates a total of 20 ceiling-mounted
photosensors distributed along the walkways surrounding the atrium space. These photosensors are
grouped in two zones (13 on the south-eastern side and 7 on the north-eastern side) and
proportionally to the illumination striking them, they generate an electric signal which is sent to the
two zone-controllers that vary the light output of the electric lights. According to the manufacturer
specifications, the system dimming range is between 20-100%.
Description of Case Study 2: Automatic On/Off
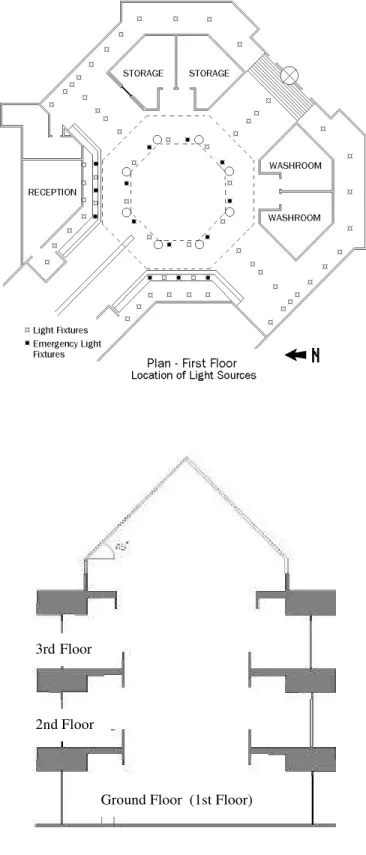
The second case study is a three-storey octagonal construction located at the main entrance of an
office complex which incorporates seven more atria. The monitored atrium is surrounded by
walkways leading to adjacent offices and meeting rooms. The ground floor houses the main building
entrance and reception desk and has a floor area of 151 m2. The second and third floors include
offices and conference rooms adjacent to the atrium and have floor areas of 91 m2 each. The
adjacent rooms were not designed to receive daylight from the atrium and have their own exterior
fenestration. Figure 3 shows the ground floor plan and a section view of the building. The reflectance
of the walls and ceilings inside the atrium has been estimated to be 60-70%. The walkways
surrounding the atrium are covered with a textile carpet, patterned with red and green strips, with an
estimated reflectance of 20-35%. The atrium ground floor has a polished marble surface with an
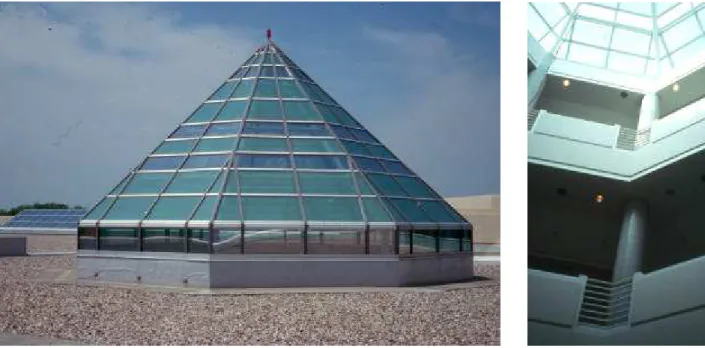
The atrium skylight has a pyramidal shape and a total area of 161 m2 (including the frame). Figure 4
shows exterior and interior views of the atrium skylight. The glazing along the skylight area is not
uniform and consists of three types of triple-glazed systems, alternating clear, tinted and patterned
glass with opaque horizontal lines applied across it, which reduces the overall glazing area by about
20%. The average measured net-visible transmittance of the skylight varied between 23-36% under
overcast sky and was between 18-41% under clear sky.
Primary artificial illumination on each floor is provided by 16, 150-watt recessed incandescent fixtures.
Every second fixture provides emergency lighting and is always on. The remaining 8 fixtures per floor
are controlled by a single daylight sensor located below the skylight of another atrium part of the
same facility. The same sensor also controls eight 500-watt recessed incandescent fixtures located
on the second floor, which are directed towards the center of the atrium ground floor for decoration.
The atrium lighting system also includes 10 continually powered 75-watt recessed incandescent
tasklighting fixtures located above two reception counters on the ground floor, 8, 175-watt manually
operated fixtures for floodlighting of the roofline glazing, and 12, 19-watt manually operated wallwash
fixtures located in the ground floor reception area for accent lighting. Excluding the manually operated
lighting which was always off during the monitoring, the total power consumption of the atrium lighting
is 11.95 kW and the lighting power density is 35.82 W/m2. The photocontrolled lighting system
accounts for 7.6 kW and has a lighting power density of 22.8 W/m2.
FIELD MEASUREMENTS
Monitoring of the daylighting performance of the two atrium spaces was conducted in two phases to
address both summer and winter conditions and to meet extreme sun angles, number of daylight
hours and outdoor illuminance9. The atrium incorporating the automatic on/off lighting system was
monitored in June and December 1995, while the space equipped with the dimming control system
was monitored in February and July 199610-11 . Measured parameters included indoor horizontal
illuminance at various locations distributed uniformly throughout the atrium space as shown in Figures
monitored daily from 7 AM to 7 PM in the atrium incorporating the automatic on/off lighting control,
and 39 test-points were monitored in the atrium with continuous dimming lighting control.
Horizontal indoor illuminance measurements were collected under clear, partly cloudy and overcast
sky conditions for 10 days in June and 5 days in December, 1995 in the atrium incorporating the
on/off lighting system, and for 6 days in February and 3 days in July 1996 for the atrium equipped
with the continuous dimming control system. On each atrium floor the measurements were collected
hourly at a height of one meter from the floor, at selected points in the north, south, east and west
directions to address the daylighting contribution next (inner test-points) and away (outer test-points)
from the atrium perimeter. The outer test points were usually located at 3.5 meters away from the
atrium perimeter to observe the illuminance reduction and the daylight contribution into the spaces
adjacent to the atrium perimeter. Measurements were also collected at night, with all lights on and
with continually powered lighting on, which were used to calculate the real contribution of daylighting
to the space, by subtracting accordingly the illuminance provided by the electrical lighting from the
daytime measured values of illuminance. In both atrium spaces the time-of-use of the electric lighting
system and the power profile were continually monitored for the entire month of June and December
1995, and February and December 1996.
RESULTS
CASE STUDY 1 (Continuous Dimming)
Daylight contribution to the atrium space
Figures 7 and 8 show the distribution over time of the indoor illuminance from daylighting for all
test-points during winter and summer. Evaluation of daylight contribution to the space was based on 200
lux, the illuminance recommendation for general lighting of spaces where visual tasks are only
Winter measurements
The horizontal illuminance at the atrium perimeter on the ground floor (inner test-points) was above
200 lux for at least 3.5 hours a day, from about 10 AM to 1:30 PM, during the entire winter monitoring.
However, the illuminance was always below 200 lux at the test-points located at 3.5 m from the
atrium perimeter (outer test-points) suggesting that potential daylight contribution into the adjacent
spaces is not significant, especially under partly cloudy and overcast skies. Measurements collected
under a clear sky show that the illuminance reached a maximum of 650 lux at the atrium center
around noon. In general, the illuminance in the center of the atrium floor was between 2 to 6 times
higher than that recorded 3.5 m away from the atrium perimeter. The maximum of 650 lux measured
in the center of the atrium ground floor and the relatively low illuminance recorded in the adjacent
space just 3.5 m away from the atrium perimeter suggests the need for additional electric lighting to
accommodate for potential high brightness ratios under clear sky conditions between the center of the
atrium, the adjacent spaces and the outdoors. The illuminance profiles indicate that the illuminance
on the atrium ground floor was not affected by direct sun in the winter because of the low sun angle
and duration.
The horizontal illuminance was mostly above 200 lux between 9 AM and 2 PM at the atrium perimeter
on the second and third floor of the atrium space, especially under clear and partly cloudy skies. This
is because there were no walkways above them and therefore, they received a larger amount of
direct daylight from the sloped western glazing. The daylight contribution to the horizontal illuminance
was the least significant on the fourth floor and the northern side of any given floor. These areas
received daylight mostly from the atrium skylight, which was showed to have a very low net-visible
transmittance.
In general, the results suggest that while the illuminance from daylighting at the atrium perimeter
usually exceeded the recommended illuminance under clear sky, the sharp drop of illuminance at the
other end of the walkways suggests that additional electric lighting will always be required in the
seems to be an appropriate technique to maximize lighting energy savings. The daylight contribution
to the illuminance in the adjacent spaces on all floors was not significant enough for total dependency
on daylighting.
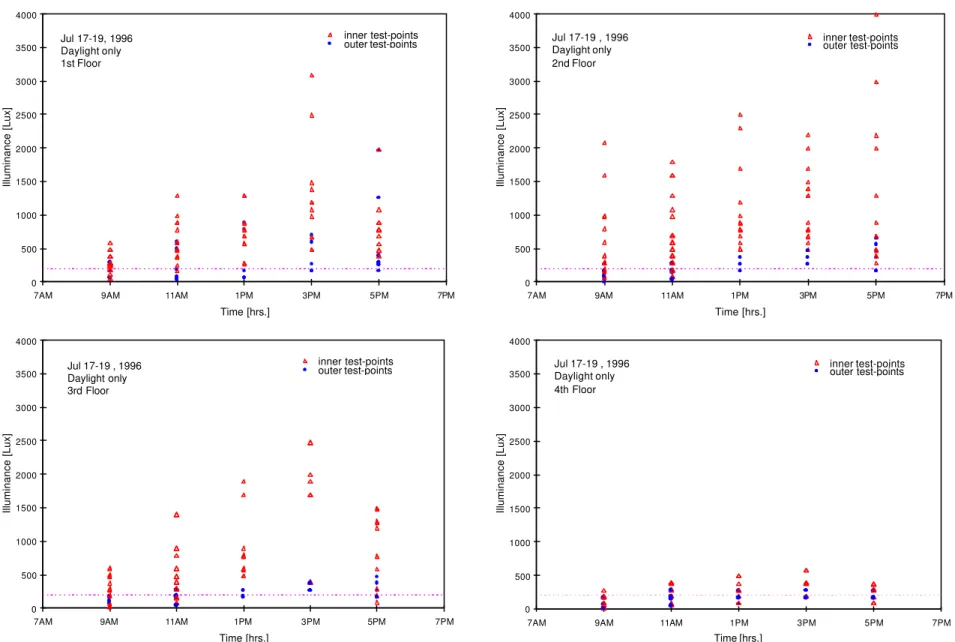
Summer measurements
The summer monitoring included mostly partly cloudy and clear sky days. The horizontal illuminance
at the perimeter of the atrium ground floor was mostly above 500 lux from 9 AM to 5 PM. The
illuminance was mostly below 200 lux at 3.5 m from the atrium perimeter and, generally, the
illuminance at the atrium perimeter was 3 to 14 times higher than the illuminance measured at 3.5 m
away from the perimeter. This indicates a potential for higher brightness ratios between the atrium
perimeter and the adjacent spaces in the summer than in the winter.
Figure 8 shows that the illuminance distribution was roughly similar on the atrium ground, second,
and third floors. However, due to the west-facing sloped glazing on the west end of the third floor
there was a higher potential daylight contribution into the adjacent spaces located on the second and
third floors. In general, data suggests that there is no significant potential for daylighting contribution
into the adjacent spaces of the ground floor. The illuminance on the fourth floor was always the
lowest due to the low net-visible transmittance of the top horizontal fenestration and the fact that the
third-floor sloped-glazing had no impact on the illuminance of the fourth floor.
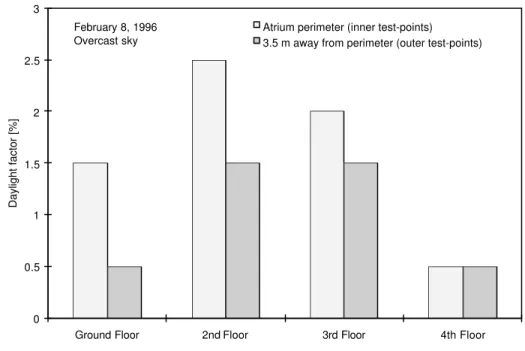
Daylight factor distribution
The daylight factor (DF) was calculated for every test-point based on measurements collected on
February 8, 1996 under a completely overcast sky. Figure 9 shows the daylight factor distribution for
each floor. Considering the atrium size, the daylight factor did not vary significantly throughout the
floors. This was due to the low-transmittance horizontal fenestration and the relatively high daylight
availability on the second and third floors. The average daylight factor at the atrium perimeter (inner
test-points) varied from 0.5% on the fourth floor, to 2% on the third floor, 2.5% on the second floor,
(outer test-points) varied from 0.5% on the fourth and ground floors, to 1.5% on the second and third
floors. It is interesting to notice that the lowest daylight factors were at the top-floor, which is unusual
for top-lit atriums. The low daylight factors confirm the fact that daylight contribution is not significant
under overcast sky conditions, especially in the winter. This also suggests that the daylight
contribution to indoor illuminance in the adjacent spaces is very insignificant.
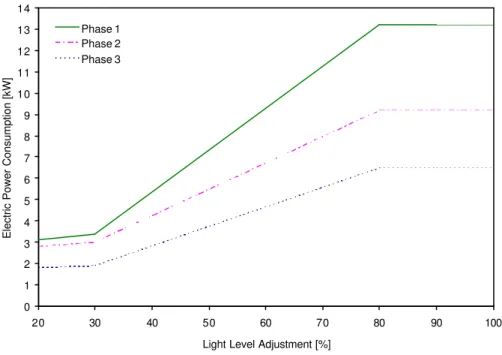
Energy performance of the continuous dimming lighting control system
The performance of the photocontrolled lighting system was evaluated through the analysis of the
system’s linearity, time-of-use and power consumption patterns. The system’s linearity was
determined by manually operating the zone-controllers independent of the electric signals received
from the ceiling mounted photosensors. As shown in Figure 10, it was found that the dimming was
linear only between 30 and 80%, despite the fact that the manufacturer specifications stated this
range to be between 20 and 100%. At a light level adjustment of 50%, the power output of each
phase was about 60% of its maximum power load.
Winter measurements
Figure 11 shows a typical daily dimming profile for two partly cloudy days in February 1996, along
with the corresponding electrical power load for each phase of the lighting system. Data shows that
during the entire winter monitoring, the photocontrolled lighting was turned off from midnight to
approximately 7 AM every day. During daylight hours, the dimming percentage related closely to the
amount of natural light present in the space, allowing the power load to drop to a minimum of 23% of
the maximum load on each phase of the control system. From dusk to midnight, lighting served by
phase 3 operated at 60% of the maximum power, while lighting served by phases 1 and 2 operated at
full capacity, despite an adjustment of the central control panel to allow a maximum 60% power load
on all three phases of the lighting system. During night-time, the dimming level of phase 2 never
dropped below 38% of full load. A complete shut-down of the control panel over the night would have
To estimate the energy savings of the continuous dimming system, the measured electric energy
consumption of the dimming system was compared to the energy consumption of all lights operating
at full capacity for 17 hours a day (7 AM to midnight). The total measured electric lighting
consumption in February 1996 was 8584 kWh. If the lights were to operate at full power for 17
hours/day, the lighting consumption in would have been 14248 kWh/month [28.9 kW x 17 h/day x 29
days/month], which shows that, as installed, the dimming control system achieved lighting energy
savings of 40%. The savings in lighting energy use were also calculated based on occupancy hours
only, from 8 AM to 6 PM. During this time frame, the electric lighting consumption for the lights
operating at full power would have been 8381 kWh/month [28.9 kW x 10 h/day x 29 days/month],
while the dimming system used only 3351 kWh/month. This shows that during occupancy hours, the
energy savings generated by the utilization of the photocontrolled lighting were 60%.
Summer measurements
The night-time lighting schedule during the summer was similar to the winter schedule. The
photocontrolled lighting fixtures were turned off from midnight to approximately 7 AM every day.
Figure 12 shows the daily dimming profile along with the corresponding electrical power load
measured for each of the three phases of the photocontrolled system on two partly cloudy days in
July 1996. The power load varied on all three phases closely related to the daylight availability,
reaching a minimum of 19% of full power consumption on phase 1, 17% on phase 2, and 23% on
phase 3. Similarly to the operation of the lighting system in the winter, from dusk to midnight, lighting
served by phase 3 operated at 60% of the maximum power, while lighting served by phases 1 and 2
operated at full capacity, despite the fact that the central control panel was adjusted to allow a
maximum 60% load on all three phases of the lighting system. During night-time, the power load on
phase 2 never dropped below 41%. As installed, the dimming system achieved in July 1996 lighting
energy savings of 52% (actual lighting consumption of 7136 kWh/month compared to 14739
kWh/month with lights operating at full power for 17 hours/day). During main occupancy, from 8 AM
to 6 PM, the photocontrolled lighting system saved 74% in lighting energy (2221 kWh/month
power load on this phase to zero through a complete shut-down of the control panel over the night,
would have provided additional savings of 9% in lighting energy.
Extrapolated annual energy performance
Two methods were used to estimate the annual energy consumption. The first method was based on
the average energy consumption recorded during the one-month winter and summer monitoring. The
second estimation was obtained by extrapolating the behavior of the photocontrolled lighting system
during February and July 1996 to the remaining ten months of the year, based on the daily number of
sunshine hours published by Environment Canada12.
A total lighting consumption of 8584 kWh was measured on all three phases of the photocontrolled
lighting system during 697 continuous lighting hours in the winter, and 7136 kWh were measured
during 720 continuous hours in the summer. This translates into an average annual lighting energy
consumption of about 97450 kWh for 8784 hours in 1996. A very close result was obtained by
extrapolating the behavior of the photocontrolled lighting system during February and July 1996 to the
remaining ten months of the year, based on the daily number of sunshine hours recorded by
Environment Canada for 1996. The energy consumption was 8548 kWh for 116.2 bright sunshine
hours in February 1996, and 7136 kWh for 218.8 bright sunshine hours in July 1996. The annual
number of bright sunshine hours was 1910 in 1996. By extrapolating the February 1996 performance
of the lighting control system to the entire year we obtain an estimated electric energy consumption of
141097 kWh/year [(8548 kWh / 116.2h) * 1910 h]. Should the lighting control system have performed
over the entire year as it did in July 1996, an estimated electric energy consumption of 62293
kWh/year would be obtained [(7136 kWh / 218.8h ) * 1910 h]. This translates into an average annual
lighting energy consumption of about 101695 kWh in 1996, which is only 4.35% higher than the value
estimated by the first method.
Compared to an annual energy consumption of 179325 kWh needed by all lights to operate at full
energy use may be achieved through the utilization of the photocontrolled lighting system, as
installed. During main occupancy the annual energy savings would be about 68%.
Adjustments to the operation of the photocontrolled lighting system could increase the savings even
further. As mentioned before, despite the adjustment of the central control panel to allow a maximum
60% load on all three phases of the lighting system from dusk to midnight, lighting served by phases
1 and 2 operated at full capacity, while lighting served by phase 3 operated adequately, at 60% of the
maximum power. A correct adjustment of phases 1 and 2 to operate at 60% load after dusk would
lead to 18% additional savings compared to the actual case. Additional savings of 9% would be
obtained through a complete shut-down of the dimming system over the night (from 12 AM to 7 PM).
Figure 13 shows the extrapolated annual energy consumption of the case study versus alternative
lighting control strategies. To calculate the cost an electricity rate of 0.08 $/kWh was considered. The
following abbreviations were used: no control - annual energy consumption and the cost that would
result without daylight-linked electric lighting controls; actual case - annual energy consumption and
cost of the case study as “measured”; phases at 60% - annual energy consumption and the cost that
would result if all three phases of the electric lighting system would operate at 60% load after dusk;
night off - annual energy consumption and the cost that would result if the dimming control panel
would be completely shut-down over the night.
CASE STUDY 2 (Automatic On/Off)
Daylight contribution to the atrium space
Figures 14 and 15 show scattered plots of the indoor illuminance from daylighting for all the
test-points during summer and winter. Similarly to Case Study 1, evaluation of daylight contribution to the
space was based on 200 lux, the illuminance recommended for general lighting of spaces where
Summer measurements
During the summer monitoring, at the test-points directly surrounding the atrium ground floor
perimeter (inner test-points), the horizontal illuminance was above 200 lux for 9 hours/day. At the
test-points situated next to the adjacent spaces (outer test-points), which were 3.5 m away from the
inner test-points, the illuminance rarely dropped below 100 lux. The two-week monitoring period
included mainly clear and partly cloudy skies. At the atrium perimeter the illuminance from daylighting
was 7 to 18 times higher than 3.5 m away from the perimeter. This was because the daylight
received around the atrium perimeter included both direct sun and diffuse daylight components,
whereas the amount of daylight received 3.5 m away from the perimeter was mostly inter-reflected
daylight. The horizontal illuminance recorded between 9 AM and 4 PM at the atrium perimeter was
between 800 and 2000 lux, while the horizontal illuminance measured next to the adjacent spaces
was between 80 and 300 lux.
On the second and third floors, the horizontal illuminance measured at the atrium perimeter and next
to the adjacent spaces never dropped below 200 lux. On the second floor, the illuminance at the
atrium perimeter was 4 to 10 times higher than that recorded 3.5 m away from the perimeter. This
range is smaller than that measured on the atrium ground floor because the amount of daylight
received 3.5 m away from the atrium perimeter did not “go” through as many inter-reflections as that
on the ground floor. The illuminance recorded between 9 AM to 4 PM at the perimeter was between
1000 and 2700 lux, while the illuminance measured next to the adjacent spaces was between 200
and 500 lux. On the third floor, the illuminance was 4 to 6 times higher at the atrium perimeter than
that next to the adjacent spaces. The illuminance recorded between 9 AM and 4 PM at the perimeter
was between 3000 and 6000 lux, while the illuminance measured 3.5 m away from the perimeter was
between 700 and 1500 lux.
In general, data shows that there is a sharp illuminance reduction just 3.5 m away from the atrium
perimeter, which suggests that potential daylight contribution to adjacent spaces on all floors is not
the third floor was still high enough (700-1500 lux) to provide useful contribution 3.5 m away from the
atrium perimeter. The summer data also suggests that the illuminance from daylighting has met even
a 500 lux target in the middle of the second and third floors for 7 hours a day.
Winter measurements
During the winter monitoring the horizontal illuminance rarely dropped below 200 lux at the atrium
perimeter on the ground floor. When it occasionally did, it was either in the early morning or late
afternoon hours. Regardless of the sky condition, the illuminance was mostly below 100 lux at all the
test-points located 3.5 m from the atrium perimeter. The winter monitoring period included clear,
partly cloudy and overcast skies.
The illuminance from daylighting was generally 4 to 30 times higher at the atrium perimeter than that
measured 3.5 m away from the perimeter. In the center of the atrium floor, the illuminance was
usually twice that recorded at the perimeter, being most of the time above 500 lux even under
overcast sky. On the second floor, the illuminance was 6 to 15 times higher at the atrium perimeter
than that recorded 3.5 m away from the perimeter. On the third floor, this reduction was reduced to 4
to 6 times. As mentioned before, this is because the test-points next to the adjacent spaces on the
third floor received more direct daylight than those located on the second floor.
In general, the illuminance from daylighting recorded during the winter was about 2 to 3 times lower in
relative magnitude than that measured during the summer, especially on the ground and second
floors. However, the important drop of illuminance from the atrium perimeter to 3.5 m away from the
perimeter occurred on all floors during both summer and winter. Nevertheless, the illuminance next
to the adjacent spaces on the third floor was higher than 500 lux under clear sky from 9 AM to 3 PM
during both seasons, which suggests a high potential daylight contribution to the adjacent spaces
situated at this level. Both summer and winter data suggested the need for an automatic lighting
control system per floor to accommodate for the drop in illuminance levels from the top to the bottom
Daylight factor distribution
The daylight factor was calculated for every test-point based on measurements collected on
December 15, 1995 under a completely overcast sky. Figure 16 shows the distribution of the average
daylight factor on each floor, which at the atrium perimeter (inner test-points) varied from 12.5% on
the third floor to 3% on the ground floor. The average daylight factor at 3.5 m away from the atrium
perimeter (outer test-points) varied from 2.5% on the top floor to 0.5% on the ground floor. The
daylight factor profile also showed an important reduction from the atrium perimeter to 3.5 m away
towards the adjacent spaces on every floor, which confirms once again that the daylighting
contribution into the adjacent spaces is significant only at the top floor of the building. The need for an
automatic control system zoned per floor to accommodate for the reduction in daylight levels with the
atrium height is also obvious. This would improve the energy efficiency of the lighting system and the
vertical uniformity of illuminance in the atrium space.
Energy performance of the automatic on/off lighting control system
Similarly to Case Study 1, the performance of the photocontrolled lighting system was evaluated
through the analysis of the system’s operation, time-of-use and power consumption patterns during
Summer measurements
The efficiency of the automatic on/off lighting system was analyzed by relating the measured
illuminance to the time-of-use of the automatic on/off lighting system. If the operation of the
photocontrolled lighting were based on the recommended illuminance of 200 lux, the photocontrolled
system should have been turned off for about 12 hours/day in June 1995. In reality, the
photocontrolled lighting system was off for about 10 to 12 hours a day and this operation schedule
was typical during the entire month. This suggests that the on/off system performed adequately
during summer days. Figure 17 shows the time-of-use profile of the photocontrolled lighting recorded
in June, 1995.
The mean time-of-use of the photocontrolled lighting was used to calculate the average lighting
energy consumption. Data shows that the photocontrolled lighting fixtures were turned off for an
average of 11.5 hours/day during the entire month of June. The mean daily on-time over 24 hours for
the photocontrolled lighting over the month of June was 53.85%. This translates into a total average
consumption of 202.6 kWh/day [(0.5385 x 7.6 kW + 4.35 kW) x 24 h/day], as compared to 286.8
kWh/day [11.95 kW x 24 h/day] for all the lights on, and 104.4 kWh/day [4.35 kW x 24 h/day] for the
emergency and reception lighting only. This suggests that the daylight-linked lighting system
generated savings of 29.3% over the total electrical lighting energy consumption. If only the
continually powered emergency and reception lighting have been used, the savings would have been
63.6%. Lighting power density calculations presented later on show that this assumption is
reasonable, since the lighting density from the emergency and reception lighting is close to the
ASHRAE /IESNA 90.1 recommendations. During the main occupancy period from 7 AM to 7 PM, the
daily mean on-time of the photocontrolled lighting was 11%. With the emergency lighting being on
continuously, the energy savings generated by the photocontrolled lighting over the 12-hour
Winter measurements
During the winter monitoring, the contribution of daylighting and emergency lighting at the atrium
perimeter on all three floors was much higher than the recommended 200 lux for at least 4 hours/day.
Similarly to the summer period, the mean time-of-use of the photocontrolled lighting was used to
calculate the average energy consumption. Data presented in Figure 17 shows that the mean daily
on-time over 24 hours for the photocontrolled lighting was 92.6% during the entire month of
December. This poor performance was due to the location of the photocell controlling the lighting
system below another atrium skylight covered by heavy snow and frost. Whenever the snow build-up
cleared off during thaw periods, the photocontrolled lighting turned off automatically.
The mean daily on-time over 24 hours for the photocontrolled lighting translated into a total average
consumption of 273.3 kWh/day [(0.926 x 7.6 kW + 4.35 kW) x 24 h/day] for the month of December,
as compared to 286.8 kWh/day for all the lights on, and 104.4 kWh/day for the emergency and
reception lights only. The photocell location and poor exposure to daylight has prevented significant
energy savings and the electric lighting control system generated savings of only 4.7%. Data also
shows that during main occupancy the daily mean on-time of the photocontrolled lighting system was
90%. The energy savings from the use of the photocontrolled lighting over the 12-hour occupancy
period were only 6.36%.
Extrapolated annual energy performance
As previously, two methods were used to estimate the annual energy consumption based on real
seasonal measurements. The first method was based on the average electrical lighting energy
consumption measured during June 1995 (202.6 kWh/day) and December 1995 (273.3 kWh/day).
This translates into an average daily consumption of 237.95 kWh/day, or an estimated annual
consumption of 86,852 kWh/year. Compared to the annual energy consumption of all lighting fixtures
of 104,682 kWh (24 hours/day on-time), the daylight-linked electrical lighting system as installed was
estimated to generate savings of 17% in lighting energy consumption ($5135.8/year versus
The second estimation was obtained by extrapolating the behavior of the photocontrolled lighting
system during June and December 1995 to the remaining ten months of the year, based on the daily
number of sunshine hours published by Environment Canada for the year of 199512. An estimated
electric energy consumption of 87,459 kWh/year was obtained by extrapolating the June 1995
performance of the on/off lighting control system (46.15% mean off-time of the photocontrolled
lighting, and a total of 312.4 sunshine hours) to the entire year. Compared to the annual energy
consumption of all lighting fixtures of 104,682 kWh (24 hours/day on-time), the daylight-linked lighting
system would generate savings of 16.5% in lighting energy consumption (0.7% difference from the
above estimate). An estimated electric energy consumption of 92,626 kWh/year was obtained by
extrapolating the December 1995 performance of the on/off lighting control 1995 (7.4% mean off-time
of the photocontrolled lighting, and a total of 78.5 sunshine hours) to the entire year. Compared to
the annual energy consumption of all lighting fixtures of 104,682 kWh (24 hours/day on-time), the
daylight-linked lighting system would generate savings of 11.5% in lighting energy consumption.
Both calculation methods suggest that the annual savings in lighting energy consumption were
between 11.5 and 17%. If the emergency and reception lighting fixtures were to generate enough
light for ambient lighting (as per ASHRAE /IESNA power density and illuminance requirements),
savings of 63.5% in lighting energy could be realized. During main occupancy from 7 AM to 7 PM,
the annual lighting energy savings resulting from the use of the photocontrolled lighting system were
31.5%. Figure 18 shows the lighting power density for the entire atrium per floor and compares it with
the ASHRAE /IESNA 90.1 recommended values13. The installed power density for the atrium
(including emergency lighting which was always on) was approximately 2.5 to 3.5 times that of
recommended values. As well, the automatically controlled lighting system had an installed power
density of approximately 2 to 2.5 times that of the recommended values. The emergency and
CONCLUSIONS
Savings in electrical lighting energy from the use of daylight-linked lighting control systems in atrium
spaces depend greatly on an adequate understanding of the daylight distribution throughout the
space and the type of automated lighting system selected. Even though it is clearly acknowledged
that the entire process for good daylit buildings starts at the design stage, this study focused on the
feasibility of installing photocontrolled lighting systems in existing atrium buildings, which were not
expressly designed with specific or specialized daylighting features. Measured data from the two
atrium spaces investigated suggests that the general assumption that there is an abundance of
daylight contribution to the atrium ground floor and into the adjacent spaces that automatically
displaces a large portion of the electrical lighting consumption is not always true. In both atrium
spaces, data showed a high daylight contribution at the atrium perimeter on all levels of the space.
However, a considerable illuminance reduction from the atrium perimeter to only 3.5 m away from the
perimeter was recorded. This suggests that the daylight contribution into the spaces located at a
rather close distance from the atrium perimeter is not always significant, especially at lower levels of
the space. Data showed a significant drop in daylight illuminance between the upper and the lower
levels, reduction that was large enough to justify the utilization of an automatic lighting control
systems per floor to accommodate for the daylight distribution with the atrium height. This would
improve both the savings and the uniformity of illumination in the space.
The on/off automatic lighting control systems can be an efficient energy saving technique if attention
is paid to adequate zoning and its calibration is based on the space daylight availability. In this study,
the daylighting performance of the automatic on/off lighting control system was substantially altered
especially in the winter by the inadequate location of the control photocell. Measured daylighting
contribution to the space indicates that larger energy savings could have been achieved, had the
snow built-up been removed periodically of the skylight under which the photocell was located. The
lighting system. In the investigated space annual lighting energy savings of up to 63.5% could have
been achieved only by reducing the installed lighting power density to the minimum standard
requirements.
The continuous dimming lighting control system proved to be an economical energy saving technique
in the building considered. The dimming percentage of the lighting control system, as installed,
related closely to the amount of natural light present in the space and based on two-month field
measurements average annual savings of 46% were estimated. These savings account for 68% of
the lighting energy consumed during main occupancy hours. However, in this case also, operation
irregularities such as a reduced dimming linearity and an incorrect adjustment of the phases of
lighting system reduced the energy efficiency and saving potential of the photocontrolled lighting.
Adjustments of the lighting control system would have increased the savings by 27%, bringing the
total annual energy savings to 73%.
ACKNOWLEDGMENTS
This research has been financially supported by the following organizations: La Sociétée Immobilière
du Québec, Public Works and Government Services Canada, Natural Resources Canada/CANMET,
Hydro-Québec, and the Institute for Research in Construction of the National Research Council
Canada. The electrical lighting consumption was measured by Benoit Bergevin, Pierre Hosatte and
Don Heath. Technical officers Robert MacDonald and Marcel Brouzes implemented the experiments.
Co-op students Hugo Carriere, Dion Hanrahan, Jacques Vincelette and David Venditti assisted in the
REFERENCES
1. Benton, C., Fountain, M., Selkowitz, S., Jewell, J. “Control System Performance in a Modern
Daylighted Office Building”. Proceedings of the 22nd session of the CIE, vol. 1, Melbourne, 1991.
pp.31-24.
2. Brekke, B., Hansen, E. H., “Energy Saving in Lighting Installations by Utilizing Daylight”, CADDET
Energy Efficiency, Newsletter no.1, 1997.
3. Engineering Interface Limited. “Feasibility Study of Potential for Electrical Energy Savings in
Canadian Office Buildings Using Controls to Dim Perimeter Lights”. Research Report for
NRCan/CANMET, Ottawa, Canada, 1994.
4. Floyd, D.B., Parker, D. S., “Field Commissioning of a Daylight-Dimming Lighting System”,
Proceedings of the 3rd European Conference on Energy-Efficient Lighting – Right Light 3,
Newcastle, England, 1995.
5. Li, D.H.W, Lam, J.C., “Evaluation of Lighting Performance in Office Buildings with Daylighting
Controls”, Energy and Buildings, Vol. 33., pp. 793-803, 2001.
6. McHugh, J., Burns. P.J., Hittle. D.C., “The Energy Impact of Daylighting”, ASHRAE Journal. May
1998.
7. Opdal, K. Brekke, B., “Energy Savings in Lighting by Utilization of Daylight”, Proceedings of the
3rd European Conference on Energy-Efficient Lighting – Right Light 3, Newcastle, England, 1995.
8. IESNA Lighting Handbook, Reference & Application Volume, Illuminating Engineering Society of
North America, 1993.
9. Atif M R, Love A J, Littlefair P, Daylighting Monitoring Protocols and Procedures for Buildings,
IEA Solar Heating & Cooling Program Task 21 / Annex 29: Daylight in Buildings, 1997.
10. Atif M R, Galasiu A D, Monitoring Results of an Enclosed Atrium Space, Part II: Daylighting
Performance of an Automatic Lighting Control System, National Research Council Canada,
Report A-3538.B.Dy, 1998.
11. Atif M R, Galasiu A D, MacDonald R A, Monitoring Results of a Large Atrium Space, Part II:
Daylighting Performance of a Continuous Dimming Lighting Control System, National Research
Council Canada, Report A-3538.C.Dy, 1998.
12. Environment Canada, Atmospheric Environment Service, Monthly and Annual Meteorological
Summary for Ottawa, 1995, and Québec City, 1996.
13. ASHRAE / IESNA 90.1, Energy Efficient Design of New Buildings Except Low-Rise Residential
Figure 1 CASE STUDY 1: Plan and section view of the atrium space with continuous dimming lighting control
Ground Floor (1st Floor) 6th Floor
Figure 3 CASE STUDY 2: Plan and section view of the atrium space with automatic on-off lighting control
Ground Floor (1st Floor) 2nd Floor
Ground Floor (1st Floor)
2nd and 3rd Floors
0 500 1000 1500 2000 2500 3000 3500 4000
8AM 9AM 10AM 11AM 12PM 1PM 2PM 3PM 4PM 5PM
Time [hrs.] Illuminance [Lux] inner test-points outer test-points atrium perimeter Feb. 7-12 , 1996 Daylight only 1st Floor 0 500 1000 1500 2000 2500 3000 3500 4000
8AM 9AM 10AM 11AM 12PM 1PM 2PM 3PM 4PM 5PM
Time [hrs.] Illuminance [Lux] inner test-points outer test-points N1 Feb. 7-12 , 1996 Daylight only 2nd Floor 0 500 1000 1500 2000 2500 3000 3500 4000
8AM 9AM 10AM 11AM 12PM 1PM 2PM 3PM 4PM 5PM
Time [hrs.] Illuminance [Lux] inner test-points outer test-points N1 Feb. 7-12 , 1996 Daylight only 3rd Floor 0 500 1000 1500 2000 2500 3000 3500 4000
8AM 9AM 10AM 11AM 12PM 1PM 2PM 3PM 4PM 5PM
Time [hrs.] Illuminance [Lux] inner test-points outer test-points N1 Feb. 7-12 , 1996 Daylight only 4th Floor
0 500 1000 1500 2000 2500 3000 3500 4000
7AM 9AM 11AM 1PM 3PM 5PM 7PM
Time [hrs.] Illuminance [Lux] inner test-points outer test-points N1 Jul 17-19, 1996 Daylight only 1st Floor 0 500 1000 1500 2000 2500 3000 3500 4000
7AM 9AM 11AM 1PM 3PM 5PM 7PM
Time [hrs.] Illuminance [Lux] inner test-points outer test-points N1 Jul 17-19 , 1996 Daylight only 2nd Floor 0 500 1000 1500 2000 2500 3000 3500 4000
7AM 9AM 11AM 1PM 3PM 5PM 7PM
Time [hrs.] Illuminance [Lux] inner test-points outer test-points N1 Jul 17-19 , 1996 Daylight only 3rd Floor 0 500 1000 1500 2000 2500 3000 3500 4000
7AM 9AM 11AM 1PM 3PM 5PM 7PM
Time [hrs.] Illuminance [Lux] inner test-points outer test-points N1 Jul 17-19 , 1996 Daylight only 4th Floor
0 0.5 1 1.5 2 2.5 3
Ground Floor 2nd Floor 3rd Floor 4th Floor
Daylight factor [%]
Atrium perimeter (inner test-points) 3.5 m away from perimeter (outer test-points) February 8, 1996
Overcast sky
0 1 2 3 4 5 6 7 8 9 10 11 12 13 14 20 30 40 50 60 70 80 90 100
Light Level Adjustment [%]
Electric Power Consumption [kW]
Phase 1 Phase 2 Phase 3
Figure 10 CASE STUDY 1: Typical power output for various dimming levels of phases 1, 2 and 3
0 20 40 60 80 100 120 0 2 4 6 8 10 12 14 16 18 20 22 0 2 4 6 8 10 12 14 16 18 20 22 0 Time [hrs.] Dimming [%] 0 2 4 6 8 10 12 14 Power demand [kW]
Feb.7 & Feb.8, 1996 Phase 1 0 20 40 60 80 100 120 0 2 4 6 8 10 12 14 16 18 20 22 0 2 4 6 8 10 12 14 16 18 20 22 0 Time [hrs.] Dimming [%] 0 2 4 6 8 10 Power demand [kW]
Feb.7 & Feb.8, 1996 Phase 2 0 20 40 60 80 100 120 0 2 4 6 8 10 12 14 16 18 20 22 0 2 4 6 8 10 12 14 16 18 20 22 0 Time [hrs.] Dimming [%] 0 1 2 3 4 5 6 7 Power demand [kW]
Feb.7 & Feb.8, 1996 Phase 3
Figure 11 CASE STUDY 1: Typical daily power profiles of the continuous dimming lighting control system for February 1996 - Phases 1, 2 and 3.
0 20 40 60 80 100 120 0 2 4 6 8 10 12 14 16 18 20 22 0 2 4 6 8 10 12 14 16 18 20 22 0 Time [hrs.] Dimming [%] 0 2 4 6 8 10 12 14 Power demand [kW]
July 17 & July 18, 1996 Phase 1 0 20 40 60 80 100 120 0 2 4 6 8 10 12 14 16 18 20 22 0 2 4 6 8 10 12 14 16 18 20 22 0 Time [hrs.] Dimming [%] 0 2 4 6 8 10 Power demand [kW]
July 17 & July 18, 1996 Phase 2 0 20 40 60 80 100 120 0 2 4 6 8 10 12 14 16 18 20 22 0 2 4 6 8 10 12 14 16 18 20 22 0 Time [hrs.] Dimming [%] 0 1 2 3 4 5 6 7 Power demand [kW]
July 17 & July 18, 1996 Phase 3
Figure 12 CASE STUDY 1: Typical daily power profiles of the continuous dimming lighting control system for July 1996 - Phases 1, 2 and 3.
0 20,000 40,000 60,000 80,000 100,000 120,000 140,000 160,000 180,000 200,000
no control actual case night off phases at 60 %
Annual electric energy consumption [kWh]
0 2,000 4,000 6,000 8,000 10,000 12,000 14,000
Annual electric energy cost [$]
Figure 13 CASE STUDY 1: Impact of alternative lighting control strategies on the annual energy consumption for atrium lighting
0 500 1000 1500 2000 2500 3000 3500 4000
8AM 9AM 10AM 11AM 12PM 1PM 2PM 3PM 4PM 5PM 6PM 7PM
Time [hrs.] Illuminance [Lux] inner test-points outer test-points target illumin. June 5 - 14, 1995 Daylight only 1st Floor 0 500 1000 1500 2000 2500 3000 3500 4000
8AM 9AM 10AM 11AM 12PM 1PM 2PM 3PM 4PM 5PM 6PM 7PM
Time [hrs.] Illuminance [Lux] inner test-points outer test-points target illumin. June 5 - 14, 1995 Daylight only 2nd Floor 0 500 1000 1500 2000 2500 3000 3500 4000
8AM 9AM 10AM 11AM 12PM 1PM 2PM 3PM 4PM 5PM 6PM 7PM
Time [hrs.] Illuminance [Lux] inner test-points outer test-points target illumin. June 5 - 14, 1995 Daylight only 3rd Floor
0 500 1000 1500 2000 2500 3000 3500 4000
7AM 8AM 9AM 10AM 11AM 12PM 1PM 2PM 3PM 4PM 5PM
Time [hrs.] Illuminance [Lux] inner test-points outer test-points target illumin. December 4-8, 1995 Daylight only 1st Floor 0 500 1000 1500 2000 2500 3000 3500 4000
7AM 8AM 9AM 10AM 11AM 12PM 1PM 2PM 3PM 4PM 5PM
Time [hrs.] Illuminance [Lux] inner test-points outer test-points target illumin. December 4-8, 1995 Daylight only 2nd Floor 0 500 1000 1500 2000 2500 3000 3500 4000
7AM 8AM 9AM 10AM 11AM 12PM 1PM 2PM 3PM 4PM 5PM
Time [hrs.] Illuminance [Lux] inner test-points outer test-points target illumin. December 4-8, 1995 Daylight only 3rd Floor
0 3 6 9 12 15
3rd Floor 2nd Floor Ground Floor
Daylight factor [%]
atrium perimeter (inner test-points) 3.5 m away from perimeter (outer test-points) December 15, 1995
Overcast sky
Figure 17 CASE STUDY 2: Time-of-use for the automatic on/off lighting system in June and December 1995
0 5 10 15 20 25 30 35 40 45 50
First Floor Second Floor Third Floor
Lighting Power Density [W/m2]
All Lights On Photocontrolled On Emerg.&Recept. Lights On
Recommended Range ASHRAE / IES 90.1