CHASING THE IDENTIFICATION OF ASCA GALACTIC OBJECTS
(ChIcAGO): AN X-RAY SURVEY OF UNIDENTIFIED SOURCES IN
THE GALACTIC PLANE. I. SOURCE SAMPLE AND INITIAL RESULTS
The MIT Faculty has made this article openly available.
Please share
how this access benefits you. Your story matters.
Citation
Anderson, Gemma E., B. M. Gaensler, David L. Kaplan, Patrick
O. Slane, Michael P. Muno, Bettina Posselt, Jaesub Hong, et al.
“ CHASING THE IDENTIFICATION OF ASCA GALACTIC OBJECTS
(ChIcAGO): AN X-RAY SURVEY OF UNIDENTIFIED SOURCES IN THE
GALACTIC PLANE. I. SOURCE SAMPLE AND INITIAL RESULTS .” The
Astrophysical Journal Supplement Series 212, no. 1 (May 1, 2014):
13.
As Published
http://dx.doi.org/10.1088/0067-0049/212/1/13
Publisher
American Astronomical Society
Version
Author's final manuscript
Citable link
http://hdl.handle.net/1721.1/88269
Terms of Use
Creative Commons Attribution-Noncommercial-Share Alike
Preprint typeset using LATEX style emulateapj v. 12/16/11
CHASING THE IDENTIFICATION OF ASCA GALACTIC OBJECTS (CHICAGO) - AN X-RAY SURVEY OF UNIDENTIFIED SOURCES IN THE GALACTIC PLANE. I: SOURCE SAMPLE AND INITIAL RESULTS
GEMMAE. ANDERSON1, †, B. M. GAENSLER1, DAVIDL. KAPLAN2, PATRICKO. SLANE3, MICHAELP. MUNO4, ‡, BETTINAPOSSELT5,
JAESUBHONG3, STEPHENS. MURRAY6, DANNYT. H. STEEGHS7CRYSTALL. BROGAN8, JEREMYJ. DRAKE3, SEANA. FARRELL1,
ROBERTA. BENJAMIN9, DEEPTOCHAKRABARTY10, JANETE. DREW11, JOHNP. FINLEY12, JONATHANE. GRINDLAY3, T. JOSEPHW.
LAZIO13, JULIAC. LEE3, JONC. MAUERHAN14, MARTENH.VANKERKWIJK15
ACCEPTED TOAPJ: February 28, 2014
ABSTRACT
We present the Chasing the Identification of ASCA Galactic Objects (ChIcAGO) survey, which is designed to identify the unknown X-ray sources discovered during the ASCA Galactic Plane Survey (AGPS). Little is known about most of the AGPS sources, especially those that emit primarily in hard X-rays (2 − 10 keV) within the Fx∼ 10−13to 10−11erg cm−2s−1X-ray flux range. In ChIcAGO, the subarcsecond localization capabilities
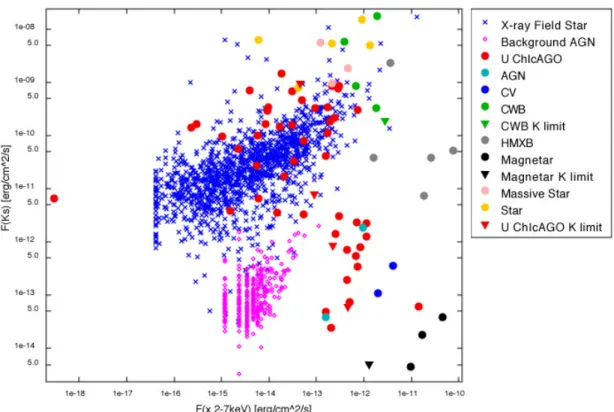
of Chandra have been combined with a detailed multi-wavelength follow-up program, with the ultimate goal of classifying the > 100 unidentified sources in the AGPS. Overall to date, 93 unidentified AGPS sources have been observed with Chandra as part of the ChIcAGO survey. A total of 253 X-ray point sources have been detected in these Chandra observations within 30 of the original ASCA positions. We have identified infrared and optical counterparts to the majority of these sources, using both new observations and catalogs from existing Galactic plane surveys. X-ray and infrared population statistics for the X-ray point sources detected in the Chandra observations reveal that the primary populations of Galactic plane X-ray sources that emit in the Fx∼ 10−13to 10−11 erg cm−2 s−1 flux range are active stellar coronae, massive stars with strong
stellar winds that are possibly in colliding-wind binaries, X-ray binaries, and magnetars. There is also a fifth population that is still unidentified but, based on its X-ray and infrared properties, likely comprise partly of Galactic sources and partly of active galactic nuclei.
Keywords:surveys – X-rays: general – X-rays: binaries – X-rays: galaxies – X-rays: stars
1. INTRODUCTION
1Sydney Institute for Astronomy, School of Physics, The University of
Sydney, NSW 2006, Australia: gemma.anderson@astro.ox.ac.uk
2Department of Physics, University of Wisconsin, Milwaukee, WI 53201,
USA
3Harvard-Smithsonian Center for Astrophysics, Cambridge, MA 02138,
USA
4Space Radiation Laboratory, California Institute of Technology,
Pasadena, CA 91125, USA
5Department of Astronomy and Astrophysics, Pennsylvania State
Univer-sity, PA 16802, USA
6Department of Physics and Astronomy, John Hopkins University,
Balti-more, MD 21218, USA
7Department of Physics, University of Warwick, Coventry CV4 7AL, UK 8National Radio Astronomy Observatory, Charlottesville, VA 22903,
USA
9Department of Physics, University of Wisconsin, Whitewater, WI 53190,
USA
10MIT Kavli Institute for Astrophysics and Space Research and
Depart-ment of Physics, Massachusetts Institute of Technology, Cambridge, MA 02139, USA
11Centre for Astrophysics Research, STRI, University of Hertfordshire,
Hatfield AL10 9AB, UK
12Department of Physics, Purdue University, West Lafayette, IN 47907,
USA
13Jet Propulsion Laboratory, California Institute of Technology, Pasadena,
CA 91109, USA
14Spitzer Science Center, California Institute of Technology, Pasadena,
CA 91125, USA
15Department of Astronomy and Astrophysics, University of Toronto,
Toronto, ON M5S 3H4, Canada
†Current address: Department of Physics, Astrophysics, University of
Ox-ford, Denys Wilkinson Building, OxOx-ford, OX1 3RH, UK
‡Current address: Lincoln Laboratory, Massachusetts Institute of
Tech-nology, Lexington, MA 02420-9108, USA
From 1996 to 1999, the Advanced Satellite for Cosmology and Astrophysics(ASCA) performed the ASCA Galactic plane sur-vey (AGPS), which was designed to study 40 deg2 of the X-ray sky, over the Galactic coordinates |l|. 45◦and |b|. 0◦.4, in the 0.7 − 10 keV energy range (Sugizaki et al. 2001). This survey resulted in a catalog of 163 discrete X-ray sources with X-ray fluxes between Fx∼ 10−13and 10−11erg cm−2s−1, many
of which are much harder and more absorbed than any other X-ray source previously detected in the Galactic plane. While the AGPS yielded the first ever log N − log S distribution of hard (2 − 10 keV) Galactic plane X-ray sources, ASCA’s lim-ited spatial resolution (30) and large positional uncertainty (10) left > 100 of the AGPS sources unidentified. Even in the era of the Chandra X-ray Observatory and the XMM-Newton tele-scope, a substantial fraction of the AGPS source catalog, and therefore a large fraction of the Galactic plane X-ray popula-tion, still remain unidentified.
For the last few years, new and archival multi-wavelength data have been used to improve the general understanding of the Galactic X-ray sources detected in the AGPS. Recent work has demonstrated that unidentified ASCA sources represent a whole range of unusual objects. For example Gelfand & Gaensler (2007) used new and archival Chandra and XMM observations to identify the AGPS source AX J155052–5418 (also known as 1E 1547.0–5408) as a magnetar sitting at the center of a faint and small, previously unidentified, radio su-pernova remnant (SNR) called G327.24–0.13. Investigations of archival XMM data allowed Kaplan et al. (2007) to iden-tify the AGPS source AX J183528–0737 as a likely
biotic X-ray binary (SyXB) comprising of a late-type giant or supergiant and a neutron star (NS) with a 112s pulse pe-riod. Gaensler et al. (2008) identified the AGPS source AX J172105–3726 as the X-ray emission associated with the ra-dio SNR G350.1–0.3. The XMM X-ray spectrum, combined with the presence of non-thermal, polarized, radio emission, showed G350.1–0.3 to be a very young and luminous SNR. A central compact object was also resolved in these X-ray ob-servations and identified as a NS. XMM (Funk et al. 2007) and Chandra (Lemiere et al. 2009) observations have demon-strated that the AGPS source AX J164042–4632 is an X-ray pulsar wind nebula (PWN) located at the center of the radio SNR G338.3–0.0. Chandra results, discussed in An-derson et al. (2011), have revealed that two AGPS sources, AX J163252–4746 and AX J184738–0156, are massive stars in colliding wind binaries (CWBs). New Chandra, XMM, and ATCA observations have also been used to identify the AGPS source AX J162246–4946 as the radio and X-ray emit-ting magnetar, PSR J1622–4950, and have exposed the likely X-ray transient nature of this source (Anderson et al. 2012). These identifications over the last 8 years have therefore demonstrated that many of the unidentified AGPS sources are unusual and rare Galactic plane X-ray objects.
The most comprehensive X-ray survey to-date, in terms of area coverage, was performed by the ROSAT X-ray Satel-lite (for example see Voges et al. 1999), which mapped the soft X-ray source population (0.1 − 2.4 keV) down to a flux sensitivity of a few 10−13 erg cm−2 s−1. Projects that
fo-cused on the ROSAT data covering the Galactic plane (e.g. the ROSAT Galactic Plane Survey; Motch et al. 1997, 1998) demonstrated that stars and AGN dominate the soft X-ray sky. However, performing a similar Galactic plane survey to include those sources with energies up to 10 keV, sensi-tive to the Fx∼ 10−13to ∼ 10−11 erg cm−2 s−1 flux range,
would be impractical to achieve with the current X-ray tele-scopes Chandra and XMM due to their limited fields of view. Astronomers have therefore had to rely upon characterizing the distribution of the harder X-ray source populations within much smaller regions of the Galactic plane (e.g. Hands et al. 2004; Ebisawa et al. 2005; Grindlay et al. 2005). For exam-ple, Motch et al. (2010) used the XGPS (Hands et al. 2004) to determine the contributions of active stellar coronae and accreting X-ray source populations in the Galactic plane for Fx. 10−12erg cm−2s−1. The Chandra Multiwavelength Plane
survey (ChaMPlane; Grindlay et al. 2005) has now surveyed 7 deg2of the Galactic plane and bulge with Chandra (van den
Berg et al. 2012), identifying the contributions of magnetic cataclysmic variables (CVs) to the Galactic ridge X-ray emis-sion (Hong 2012).
The key to obtaining a complete understanding of the Galac-tic plane X-ray source populations, from 0.3 − 10 keV, that make up the Fx∼ 10−13to 10−11erg cm−2s−1X-ray flux range
is to identify the unidentified AGPS sources, as ASCA cov-ered a much larger area of the Galactic plane (∼ 40 deg2) than
other X-ray surveys (for example the XGPS and ChaMPlane; Hands et al. 2004; Motch et al. 2010; Grindlay et al. 2005; van den Berg et al. 2012). In order to identify the AGPS sources, the Chasing the Identification of ASCA Galactic Objects(ChIcAGO) survey was conceived. In this survey the subarcsecond capabilities of Chandra are used to localize the unidentified AGPS sources listed by Sugizaki et al. (2001). Once the positions of these sources have been determined,
an extensive multi-wavelength program is activated, which is aimed at determining the identities of the sources and the na-ture of their X-ray emission.
In this paper, we present the results of Chandra observa-tions of 93 unidentified AGPS sources, along with the multi-wavelength follow-up that has allowed the identification of optical, infrared and radio counterparts. Section 2 explains the Chandra observing strategy employed to localize the unidentified AGPS sources. To begin the identification pro-cess, we automated the Chandra data analysis and prelim-inary multi-wavelength follow-up, which involves compar-isons with existing optical, near-infrared (NIR) and infrared (IR) surveys. X-ray spectral modeling using “quantile analy-sis” (Hong et al. 2004) and Cash (1979) statistics, and further multi-wavelength observations in the optical, infrared and ra-dio bands required to ultimately classify each source, are also described. Section 3 details the results of each AGPS posi-tion observed with Chandra. These results include details on the individual X-ray sources detected, the parameters of their likely X-ray spectral shapes, and the names and magnitudes of their infrared, optical and radio counterparts. The possi-bility of short term variapossi-bility or periodicity is also explored. In Section 4, we discuss the AGPS sources that have been identified through a visual inspection of radio Galactic plane surveys. The X-ray fluxes and NIR and IR magnitudes of the remaining unidentified sources, reported in Section 3, are then used to conduct X-ray and infrared population statistics. Re-sulting flux and color-color diagrams allow the identification of likely Galactic plane X-ray populations with infrared coun-terparts. This analysis is followed by a discussion of particu-larly interesting individual sources that have been identified as a result of this work. The final part of this section includes a tabulated summary of all the 163 AGPS sources along with their confirmed identifications (obtained from the literature and the present paper) or their tentative identifications that are based on our ChIcAGO survey statistical results. In Section 5 we summarize the results from this paper, with a particular focus on our statistical findings.
2. METHOD
2.1. Chandra Observations
The main goal of the ChIcAGO survey is to localize the positions of the unidentified AGPS sources, so that multi-wavelength follow-up can be used to identify them. It is there-fore necessary to design an experiment that will allow each source to be localized precisely enough to identify counter-parts in the crowded Galactic plane. Chandra can provide subarcsecond localization as it has an intrinsic astrometric precision accuracy of 0.006 at 90% confidence within 20of the aim-point (Weisskopf et al. 2003).
For all but the brightest targets, Chandra’s Advanced CCD Imaging Spectrometer (ACIS; Garmire et al. 2003) was used as it provides simultaneous positional, temporal and spectro-scopic information. The ACIS-S configuration was chosen as it fully encompasses the AGPS positional uncertainties of up to 30(Sugizaki et al. 2001). (The aimpoint of the ACIS-I con-figuration is near a chip gap.) The High Resolution Camera (HRC; Murray 2000) in the I focal plane array was used to observe those sources with a predicted ACIS count-rate > 0.2 counts s−1, to avoid positional, spectral, and temporal
At Chandra’s high angular resolution, only a small number of X-ray counts are required to localize each source suffi-ciently to overcome confusion from IR field stars in the Galac-tic plane. We first considered the number density of such stars in the Ks-band at low Galactic latitudes. Figure 24 of
Kaplan et al. (2004) shows that 0.2 stars arcsec−2 are
ex-pected with a magnitude Ks. 19. For there to be a < 25%
chance of random alignment of the Chandra source with an infrared field star of this magnitude, a total astrometric er-ror < 0.007 is required. Using 2MASS as a guide, given its extremely high positional precision (0.001 1σ error) and Chan-dra’s 90% absolute astrometry error of 0.006, a centroiding er-ror of < 0.004 with 95% accuracy is required for Chandra. The ChandraInteractive Analysis of Observations (CIAO)18
soft-ware tool wavdetect (Freeman et al. 2002) was chosen to detect the point sources in our fields. Equation (5) of Hong et al. (2005) provides the 95% confidence position error cir-cle of a point source detected with wavdetect for a given number of source counts at a given off axis angle. At the maximum off-axis angle expected for an ASCA source local-ization (< 30), ∼ 100 X-ray counts are required to ensure that a source’s centroiding error is below 0.004.
Using the count rates and power-law spectral fits calculated by Sugizaki et al. (2001) for each AGPS source and the Chandra Proposal Planning Toolkit (PIMMS)19, the exposure time re-quired to detect ∼ 100 counts with Chandra for each source was estimated. For those AGPS sources that were too faint for Sugizaki et al. (2001) to calculate spectral fit parameters, an absorbed power-law model with a photon index Γ = 2 and an absorption NH= 1022cm−2was used, which are
representa-tive values of a non-thermal X-ray source and typical Galactic plane absorption.
In order to select the AGPS source candidates to be ob-served with Chandra, each source was investigated individu-ally. First those AGPS sources that have already been conclu-sively identified, either by Sugizaki et al. (2001) or by other groups in the literature, were removed from the Chandra tar-get list. Based on this criteria, a total of 43 AGPS sources were identified and therefore rejected for Chandra follow-up (these sources are described in Appendix A). The ASCA im-ages of each of the remaining unidentified AGPS sources were then studied to determine if any sources appeared to be too ex-tended for Chandra to successfully localize in a short amount of time. These sources were also rejected for Chandra follow-up. The remaining, unidentified AGPS sources, were then pri-oritized for Chandra follow-up based on their absorbed X-ray flux or count-rate that was listed by Sugizaki et al. (2001). A total of 93 AGPS sources have been observed with Chan-draas part of the ChIcAGO survey, of which 84 were imaged with ACIS-S and 9 were imaged with HRC-I. The ChIcAGO Chandraobservations took place over a three and a half year period, from 2007 January to 2010 July. The Chandra expo-sure times ranged from ∼ 1 − 10 ks. All the details of these Chandraobservations are listed in Table 1. The initial auto-mated analysis of these Chandra observations was conducted using the ChIcAGO Multi-wavelength Analysis Pipeline, de-scribed in Section 2.2. We then performed a more detailed X-ray analysis and counterpart study for those 74 sources with > 20 X-ray counts, as such sources are approximately within
18http://cxc.harvard.edu/ciao/index.html 19http://cxc.harvard.edu/toolkit/pimms.jsp
the original AGPS sources X-ray flux range (see Sections 3.2 and 3.3).
2.2. ChIcAGO Multi-wavelength Analysis Pipeline (MAP) It is crucial to the efficiency of the project to automate the analysis of the Chandra observations, such as the detection and extraction of sources, as well as the search for multi-wavelength counterparts. We therefore created the ChIcAGO Multi-wavelength Analysis Pipeline (MAP) for this task. ChIcAGO MAP takes the ACIS-S or HRC-I Chandra obser-vation of an AGPS source field and detects and analyzes all point sources within 30, equivalent to the largest likely po-sition error, for the original AGPS source popo-sitions supplied by Sugizaki et al. (2001). From hereon we refer to all point sources detected in the Chandra observations of the AGPS fields as “ChIcAGO sources”. The X-ray analysis compo-nent of this pipeline uses the CIAO software, version 4.3, with CALDB version 4.5.5, and follows standard reduction recipes given in the online CIAO 4.3 Science Threads.20
ChIcAGO MAP carries out the following steps, all of which are explained in more detail below. These steps apply to both ACIS-S and HRC-I datasets unless otherwise stated.
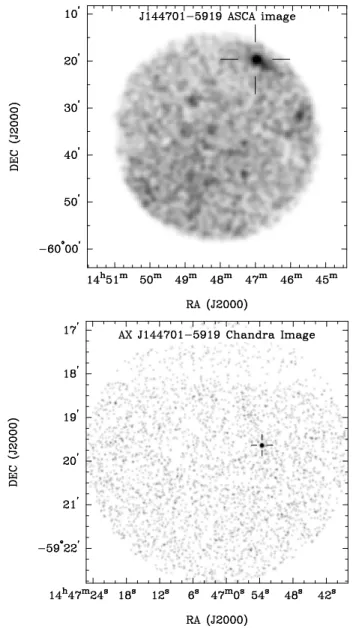
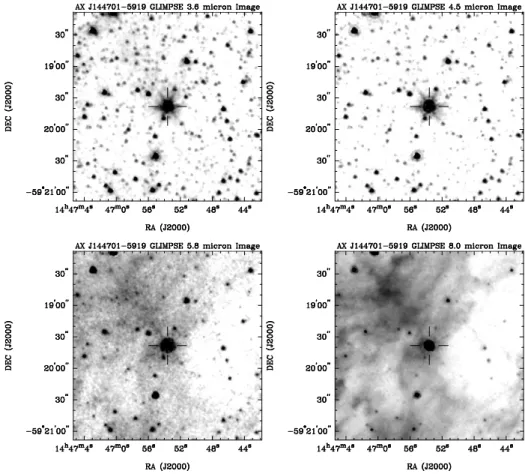
• An image of the original ASCA detection of the AGPS source is created (for example see the top image of Fig-ure 1).
• The CIAO tool chandra_repro is run to reprocess the Chandra data.
• The new event file is filtered to only include photons with energies in the range 0.3 − 8.0 keV.
• The CIAO tool wavdetect is used to detect all X-ray point sources (ChIcAGO sources) within 30 of the AGPS position. A Chandra image is then created for each ChIcAGO source (for example see the bottom im-age of Figure 1). If no sources are detected, ChIcAGO MAP ends.
• The position, source counts, and associated errors are calculated for each ChIcAGO source detected. If the dataset is an ACIS-S observation then the total counts are obtained in the 0.3 − 8.0, 0.5 − 2.0, and 2.0 − 8.0 keV energy ranges, and the energy quartiles (E25, E50, and
E75), which are used in quantile analysis (see Section
2.3.1), are calculated.21
• The CIAO tool specextract is run on ACIS-S datasets to obtain the source and background spectrum files and their corresponding redistribution matrix file (RMF) and the ancillary response file (ARF) for each ChIcAGO source. These files are used in quantile anal-ysis and spectral modelling (see Section 2.3).
• A timing analysis is conducted on each ChIcAGO source (detected with either the ACIS or HRC instru-ments) to search for short term variability and periodic-ity.
20http://cxc.harvard.edu/ciao4.3/threads/index.html
21The HRC instrument has very poor spectral resolution so this, and the
– A light-curve with 8 bins is constructed using the CIAOtool dmextract. The χ2is calculated for
this light-curve in order to test for short-term vari-ability (e.g. Figure 2).
– The Z2
1 statistic is calculated to search for
sinu-soidal periodicity (Buccheri et al. 1983). This process creates a power spectrum and folded light curve (e.g. Figure 3), which predicts the most likely pulsed frequency, its corresponding power, and the probability that the power is random noise.
• Multi-wavelength follow-up and catalog searches are conducted to identify likely optical, infrared, and radio counterparts to each ChIcAGO source.
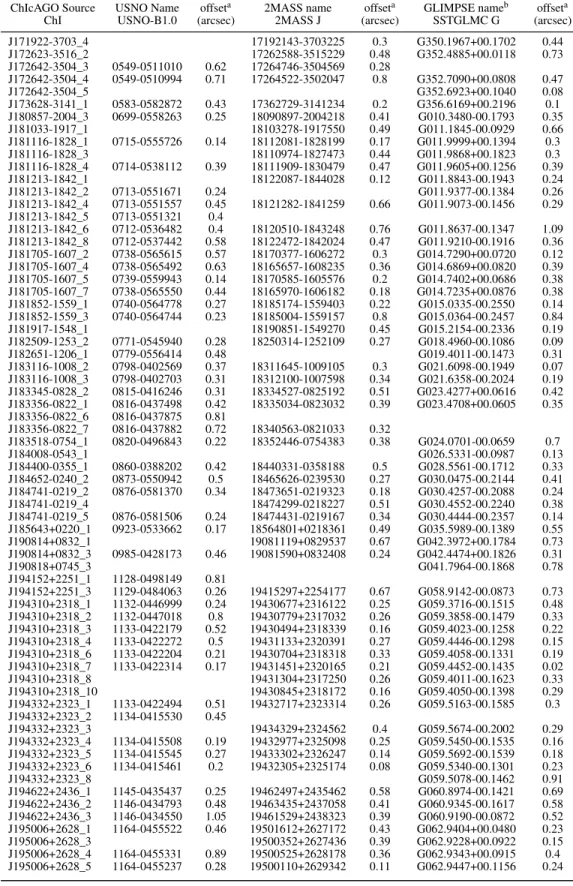
– The USNO B1 (Monet et al. 2003), 2MASS PSC (Skrutskie et al. 2006), and GLIMPSE I and II (Benjamin et al. 2003) catalogs are accessed to obtain a list of all optical and infrared sources within 400of the ChIcAGO source’s wavdetect position.
– Small sized (60 by 60) image cutouts, centered on the ChIcAGO source’s wavdetect position, are obtained from the 2nd Digitized Sky Survey (Red: DSS2R and Blue: DSS2B; McLean et al. 2000), 2MASS, and the GLIMPSE I and II sur-veys. A 300by 300radio image cutout is obtained from the Sydney University Molonglo Sky Survey (SUMSS; Bock et al. 1999). Examples of all the image cutouts can be found in Figures 4 and 5. ChIcAGO MAP first generates an image of the AGPS source as originally detected by the Gas Imaging Spectrometer (GIS; Ohashi et al. 1996) onboard ASCA. The GIS has a circular field-of-view with a 500 diameter. The top image of Fig-ure 1 shows the ASCA GIS detection of the AGPS source AX J144701–5919. We have chosen AX J144701–5919 as the example source for illustrating the output of ChIcAGO MAP because it was the first AGPS source observed with Chan-draas part of the ChIcAGO survey, and it is also an interest-ing source with a bright counterpart (as demonstrated by its identification as an X-ray emitting WR star in Anderson et al. 2011).
ChIcAGO MAP reprocesses all of the Chandra observations, both ACIS and HRC, using the CIAO chandra_repro script, which creates a new level=2 event file and bad pixel file. The Chandra ACIS data are filtered to only include events with energies in the range 0.3 − 8.0 keV in order to avoid high-energy and cosmic ray particle backgrounds. We have chosen to optimize ChIcAGO MAP for the detection of point sources as our short Chandra observations (< 10 ks) are not very sensitive to extended sources. ChIcAGO MAP uses the CIAO wavelet detection algorithm, wavdetect, which we have set to search for all sources with wavelet scales of radii 1, 2, 4, 8 and 16 pixels. This does, however, introduce a source selection bias as it is possible that AGPS sources that were unresolved with the ASCA PSF could be extended, and therefore resolvable with Chandra. Re-running ChIcAGO MAP using wavdetect with larger scales more appropriate for extended sources, or using the CIAO Voronoi Tessella-tion and PercolaTessella-tion source detecTessella-tion algorithm vtdetect
Figure 1. X-ray images of AX J144701–5919 as output by ChIcAGO MAP. Top: The ASCA GIS detection of the AGPS source AX J144701–5919. The circular field-of-view has a 500diameter and the position of this AGPS source, as listed by Sugizaki et al. (2001), is indicated by the black cross-hair. Bottom: The 30radius field-of-view of the Chandra observation of AX J144701–5919, which is centered on the position of this AGPS source listed by Sugizaki et al. (2001). The one ChIcAGO source detected in this field is indicated by a black cross-hair, and is likely the Chandra counterpart to AX J144701–5919.
(Ebeling & Wiedenmann 1993), could be conducted in the future to detect extended sources in the ChIcAGO Chandra images.
ChIcAGO MAP utilizes wavdetect to detect all sources within 30of the original ASCA position (for example see the Chandradetection of AX J144701–5919 in the bottom image of Figure 1). This search radius is based on the position ac-curacy and spatial resolution of ASCA and therefore designed to ensure that the majority of contributing X-ray sources are encompassed. (However, it is also possible that there are as-sociated X-ray sources beyond 30 from the AGPS position. This could be due to the inaccuracy of the ASCA positions of those sources that are blended or near the edge of the field-of-view. This is further explored in Section 3.1 and Appendix B.)
In many cases more than one X-ray source could have been contributing to the total X-ray flux from an AGPS source orig-inally detected with ASCA. (Note this is not the case for the example of AX J144701–5919.) The positional accuracy of wavdetecthas been well investigated and tested in previ-ous Chandra surveys (i.e. ChaMPlane; Hong et al. 2005). The position of each ChIcAGO source as output by wavdetect is obtained and Equation (5) of Hong et al. (2005) is used to calculate the 95% confidence position error circle.22 This wavdetect error is then added in quadrature
to the absolute astrometry error of Chandra to obtain the total position error of each ChIcAGO source.
The source regions used to calculate the total number of source counts, which are centered on the source position as output by wavdetect, have a radius equivalent to 95% of the point-spread function (PSF) at 1.5 keV. The background subtraction is performed using an annulus whose size is be-tween two and five times the above 95% PSF radius, centered on the source position. Given the low number of counts de-tected, usually < 100, the 1σ lower and upper confidence lim-its of the total number of counts are calculated using Gehrels (1986) statistics. The following energy based analysis is then performed on the ACIS-S observations. The total number of counts are calculated for the 0.3 − 8.0, 0.5 − 2.0, and 2.0 − 8.0 keV energy ranges. ChIcAGO MAP then uses the extracted ACIS-S counts and corresponding energies to calculate the 25%, 50% and 75% photon fractions (E25, E50 and E75), the
energies below which 25%, 50% and 75% of the photon ener-gies are found, respectively. These median (E50) and quartile
(E25 and E75) values can immediately characterize the
hard-ness of a source without using conventional hardhard-ness ratios, which are not versatile enough to account for diverse X-ray spectral types in the Galactic plane. These quartile fractions can then be used to employ quantile analysis (Hong et al. 2004), which uses a quantile based color-color diagram to classify spectral features and shapes of low count sources (see Section 2.3.1).
The CIAO tool, specextract, is also run on the ACIS-S detected ChIcAGO sources to generate source and back-ground spectrum files and their corresponding RMF and the ARF. These files are used to perform spectral interpolation with quantile analysis and to conduct spectral modelling and fitting with the CIAO package Sherpa. Further details on the spectral investigations of the ChIcAGO sources can be found in Section 2.3
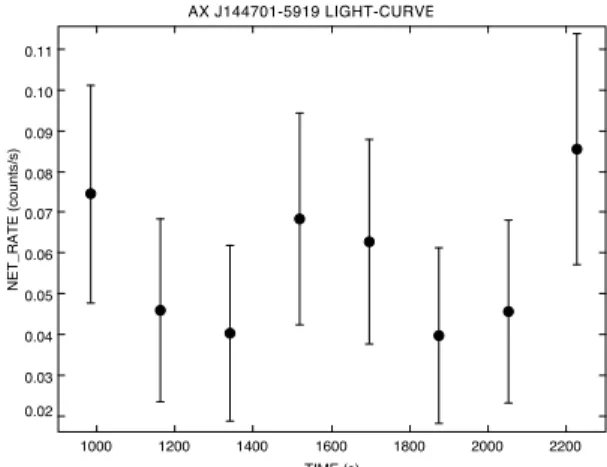
ChIcAGO MAP then performs a timing analysis on all the ChIcAGO sources, detected with either the ACIS or HRC in-struments, to search for evidence for short term variability and periodicity. In each case a light-curve is extracted using dmextract where the counts are divided into 8 bins (for example see Figure 2). The Gehrels approximation to con-fidence limits for a Poisson distribution is used to estimate the errors as there are < 20 X-ray counts in each bin. The χ2 statistics are adopted to test for variability (for example
see Gaensler & Hunstead 2000). (It should be noted that as dmextractuses the upper (larger) Gehrels confidence limit
22This equation was constructed by running wavdetect on ACIS-I and
ACIS-S data. It is therefore unknown whether this position error equation is applicable to the positions calculated from running wavdetect on HRC data sets. However, since the wavdetect algorithm is not instrument spe-cific, it is likely that this equation estimates reasonable errors for sources detected in HRC observations.
to estimate the count-rate errors, the resulting χ2 output by ChIcAGO MAP may be underestimated.) For 7 degrees of freedom, χ2& 24.3 is required for a source to be considered variable at 99.9% confidence. 0.02 0.03 0.04 0.05 0.06 0.07 0.08 0.09 0.10 0.11 1000 1200 1400 1600 1800 2000 2200 TIME (s) N ET _ R AT E (co u n ts/ s) AX J144701-5919 LIGHT-CURVE
Figure 2. The Chandra ACIS-S light-curve of the ChIcAGO source AX J144701–5919 as output by ChIcAGO MAP. This ChIcAGO source does not exhibit evidence for short-term variability as its resulting χ2= 3.4 for 7
de-grees of freedom is below the confidence threshold of 99.9%.
After correcting the photon arrival times to the Solar System barycenter, the target source is then investigated for evidence of periodicity using the Z2
n test (Buccheri et al. 1983),
equiv-alent to the Rayleigh statistic when n, the chosen number of harmonics, is set to 1. ChIcAGO MAP uses n = 1 for the sake of simplicity and because such a test is sensitive to sinusoidal distributions. Z12has a probability density function equivalent to the χ2statistic with 2 degrees of freedom. ChIcAGO MAP
searched for periodicity down to 6.48s (twice the frame-time resolution; Weisskopf et al. 2003) for sources detected with ACIS, and down to 0.01s for sources detected with HRC.23A
power spectrum (power vs. frequency) and folded light curve (counts per bin vs. phase) of each source is generated, pre-dicting the pulsed frequency of the highest Z2
1 power, and the
probability that this power was random noise for a given num-ber of trials (for example see Figure 3). A 99.9% confidence was required for a source to have a significant level of pe-riodicity, which corresponds approximately to Z21 & 26 and Z2
1& 36 for ACIS and HRC observations, respectively.
It is also possible that many of the AGPS sources are tran-sient or undergo long-term variability, so have changed signif-icantly in flux since the original ASCA observations. The de-tailed analysis of any periodic, variable, and transient sources is beyond the scope of this paper. We only flag those source that may fit into one of the above categories for the purpose of future investigations.
The next step in the ChIcAGO identification process is to search for multi-wavelength counterparts to the ChIcAGO sources. ChIcAGO MAP accesses the US Naval Observatory B Catalog, version 1.0 (USNO B1, visual magnitude bands B, R, and I; Monet et al. 2003), the Two Micron All Sky Survey Point Source Catalog (2MASS PSC, near-infrared magnitude
23 The lower-limit of 0.01s for the HRC observations is
cho-sen because a wiring error in the detector degrades the time reso-lution accuracy from 16µs to the mean time between events. See http://cxc.harvard.edu/proposer/POG/html/chap7.html#sec:hrc_anom
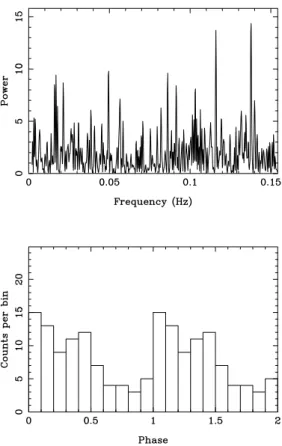
Figure 3. The power spectrum and folded light curve resulting from a Z2
1
sta-tistical search for periodicity from AX J144701–5919 as output by ChIcAGO MAP. Top: The power spectrum (power vs. frequency (Hz)) of AX J144701– 5919. The power spectrum peaks at a value of Z2
1= 14.4 at a frequency of
0.1378 Hz. The probability of this power being random noise is 0.16. It is therefore unlikely to be a real signal. Bottom: The folded light curve (counts per bin vs phase) that has been folded at 0.1378 Hz.
bands J, H, and Ks; Skrutskie et al. 2006), and the
Galac-tic Legacy Infrared Mid-Plane Survey Extraordinaire I and II Spring 07’ Catalogs (highly reliable) and Archives (more complete, less reliable) (GLIMPSE, infrared magnitude bands 3.6, 4.5, 5.8, and 8.0 µm; Benjamin et al. 2003) to obtain a list of all the optical and infrared sources within 400 of the wavdetectposition of each ChIcAGO source. The infor-mation extracted from these surveys includes the position of the source, the offset from the Chandra position and the mag-nitudes listed in the given survey or dataset.24
Small sized images cutouts (60by 60) from optical and infrared surveys, centered on the ChIcAGO source wavdetect po-sition, are also downloaded to enable a visual inspection of likely counterparts and their surrounding environments. The B and R magnitude band images are obtained from the 2nd Digitized Sky Survey (Blue: DSS2B and Red: DSS2R; McLean et al. 2000) and the J, H, and K magnitude band im-ages are obtained from 2MASS. Image cutouts of the infrared magnitude bands 3.6, 4.5, 5.8 and 8.0 µm are obtained from the GLIMPSE I and II, version 3.5, surveys.25 A 300 by 300 image cutout of the 843 MHz radio sky is also generated from
24 The catalog information is downloaded via a generic URL from
the VizieR Service (http://vizier.cfa.harvard.edu/viz-bin/VizieR) and the NASA/IPAC Infrared Science Archive (http://irsa.ipac.caltech.edu/).
25http://irsa.ipac.caltech.edu/data/SPITZER/GLIMPSE/
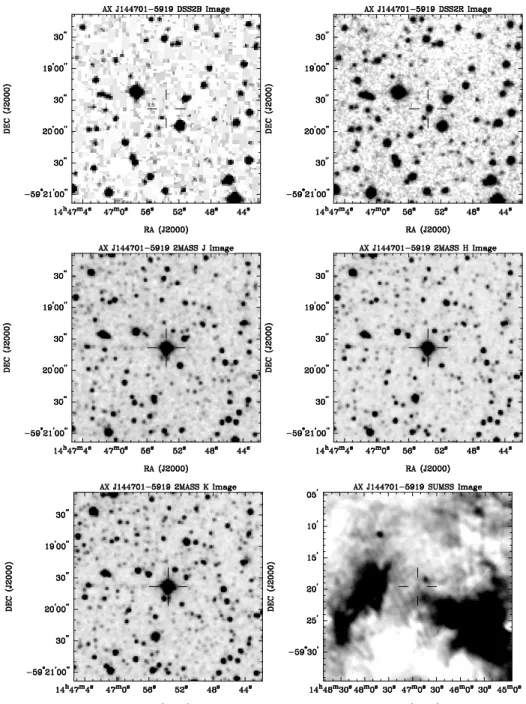
SUMSS, which is a survey conducted with the Molonglo Ob-servatory Synthesis Telescope (MOST) and has a resolution of 4300× 4300cosec|dec| (Bock et al. 1999).26 An example of
all the image cutouts generated by ChIcAGO MAP for AX J144701–5919 can be seen in Figures 4 and 5.
2.3. ChIcAGO Sources Spectral Investigation Deducing the best spectral model fit to the ChIcAGO sources is difficult using standard X-ray spectral fitting techniques due to the small number of X-ray source counts detected in the Chandraobservations (usually < 100). We therefore imple-ment two different techniques for predicting the best spectral parameters for the brighter (> 20 X-ray counts) ChIcAGO sources. The first technique is “quantile analysis" (Hong et al. 2004), which has been recently developed to address some of the problems associated with spectral modeling of sources with low number statistics. Quantile analysis allows for the interpolation of likely spectral shapes of X-ray sources with as few as 10 counts. The second technique is utilizing the CIAO spectral fitting tool Sherpa to obtain best fit spectral param-eters using Cash (1979) statistics. These statistics are based on Poisson distributed data and are therefore ideal for mod-eling spectra with a limited number of source counts. Both methods are described in detail below.
2.3.1. Quantile Analysis
Quantile analysis uses predetermined fractions of the total number of energy source counts, such as the median (E50) and
quartile energies (E25and E75), to construct a quantile-based
phase space that can be overlayed with grid patterns of com-mon spectral models. This quantile phase space is more sen-sitive to the wide range of Galactic X-ray sources than those constructed from conventional hardness ratios. This is be-cause there is no count-dependent sensitivity bias toward any spectral type, which is inherent to the choice of sub-energy bands in the conventional spectral hardness or X-ray color analysis. In the ChIcAGO survey, quantile analysis is adopted to calculate potential spectral shapes of the ChIcAGO sources. The ACIS-S detected ChIcAGO sources selected for quantile analysis have > 20 (net) X-ray counts in the 0.3 − 8.0 keV energy band, as these are likely to be bright enough to be the original AGPS sources (see Section 2.1). The net counts were obtained by summing the total number of counts inside a source region that is 6 times the error radius in size and sub-tracting the background normalized counts calculated from an annulus that has an outer radius of ∼ 1500with the source re-gion subtracted. The three quartiles (E25, E50, and E75) and
their corresponding errors were calculated as outlined by Hong et al. (2004).
The quantile phase space, suggested by Hong et al. (2009, see their Figure 4), used to calculate the likely spectral shapes, was constructed for each ChIcAGO source. This phase space consists of the normalized logarithmic median (log(E50/Elow)/log(Ehigh/Elow)) and the normalized quartile
ratio (3 × (E25− Elow)/(E75− Elow)), where Elow= 0.3 keV and
26The images from the DSS2R, DSS2B, 2MASS and SUMSS surveys
are downloaded using a generic URL from the virtual observatory SkyView, which is a service of the Astrophysics Science Division at NASA/GSFC and the High Energy Astrophysics Division of the Smithsonian Astrophysical Ob-servatory (SAO), http://skyview.gsfc.nasa.gov/
Figure 4. The DSS2B, DSS2R, 2MASS and SUMSS image cutouts of the region surrounding the AGPS source AX J144701–5919, which has been localized by Chandra, as output by ChIcAGO MAP. In all images the Chandra position of AX J144701–5919 is indicated by a black cross-hair. The survey name and filter band of each image cutout is listed at the top of each Figure.
Ehigh= 8.0 keV, equivalent to the energy range explored. The
logarithmic median phase space takes advantage of the higher sensitivity at low energies in typical X-ray telescope CCDs, while keeping the spectral discernibility more or less uni-form throughout the full range of the phase space. In order to compensate for the spatial change of the detector response in Chandra/ACIS, the RMF and the ARF, appropriate to the observed location of each ChIcAGO source in the CCD, are calculated using the CIAO tools.
The data points of the ChIcAGO sources in the quantile di-agram were compared with simple power-law and thermal bremsstrahlung spectral models to extract the most plausible spectral parameter values for each source. It should be noted that quantile analysis cannot evaluate which model is more
likely unless the estimated parameters of the model turn out to be unphysical (e.g. Γ > 4). The estimate of the spectral parameters are limited to −2 ≤ Γ ≤ 4 for a power law model and 0.1 keV ≤ kT ≤ 10 keV for a bremsstrahlung model. The explored extinction (NH) covers the range 0.01 − 100 × 1022
cm−2. If the data point for a source in quantile phase space sits
outside of the model grid set by these parameter ranges, the model is considered incompatible with the observed spectrum of the source. The quantile errors allow the spectral param-eter uncertainties to be calculated for each ChIcAGO source (Hong et al. 2004).
Figure 5. As for Figure 4, but showing the GLIMPSE 3.6, 4.5, 5.8, and 8.0 µm bands.
The spectral modeling of the ChIcAGO sources was con-ducted using the CIAO 4.5 spectral fitting package Sherpa with the statistics set to the XSpec (Dorman & Arnaud 2001) implementation of Cash (1979) statistics. Cash statistics ap-ply a maximum likelihood ratio test that can be performed on sources with a low number of source counts per bin. We chose to restrict all spectral modeling to those ChIcAGO sources with > 50 X-ray counts as attempted modeling of those sources with less counts usually did not converge. Cash statistics cannot be performed on a background sub-tracted spectrum. The source and background spectrum must instead be modeled simultaneously. However, in the case of the Chandra observations of ChIcAGO sources the back-ground is extremely low and cannot be described by a generic spectral model. As a result attempting to model the back-ground spectrum does not improve the overall spectral fit. We therefore only model the source spectrum of the ChIcAGO sources.
Both an absorbed power law and an absorbed thermal bremsstrahlung model are applied to the ChIcAGO source spectra so that they can be directly compared to the quan-tile analysis spectral interpolation results. The parameter er-rors are calculated using the Sherpa “projection" function, which estimates the 1σ confidence intervals. The absorbed and unabsorbed flux (plus errors) are calculated using the Sherpafunction “sample_flux", which is new to CIAO 4.5. The overall goodness of fit measure is defined by the value of the Cash statistic divided by the number of degrees of freedom and should be of order 1.
2.4. Multi-wavelength Follow-up Observations While the X-ray morphology and spectrum can provide infor-mation on the nature of a ChIcAGO source, the key to iden-tification is usually through an extensive multi-wavelength follow-up campaign. ChIcAGO MAP identifies the possible optical and infrared counterparts in existing multi-wavelength Galactic plane surveys. There are, however, many cases where the counterparts are too faint to be detected in these surveys due to the high absorption in the Galactic plane. It is also possible that the high object density in the Galactic plane may result in confusion with nearby sources. In these cases, further optical and infrared photometric observations were conducted with large telescopes to obtain detections of faint counterpart candidates and to separate likely blends. If the first photometric observing attempt was unsuccessful at detecting or separating a counterpart candidate then deeper imaging using longer exposure times was conducted. Those X-ray sources that remain undetected at optical and infrared wavelengths will need to be further investigated in the X-ray band or at other wavelengths.
The radio wavelength band is also a useful diagnostic for iden-tifying ray sources in the Galactic plane. Comparing the X-ray source positions with radio surveys can indicate if there is a likely radio counterpart or whether the X-ray source lies in a diffuse region of radio emission in the Galactic plane. Inter-ferometric radio observations of a small subset of ChIcAGO sources were obtained in order to resolve confusing regions of radio emission and allow for the detection or confirmation of compact radio counterparts.
2.4.1. Optical and Near Infrared Observations with Magellan
The optical and NIR photometric observations presented in this paper were obtained using instruments on the twin 6.5m, Baade and Clay, Magellan telescopes, located at Las Cam-panas Observatory, Chile. The NIR photometry, 1 − 2.5µm, was obtained using the Persson’s Auxiliary Nasmyth Infrared Camera (PANIC; Martini et al. 2004; Osip et al. 2008) on Baade. PANIC was used primarily to detect the counterparts of ChIcAGO sources with no cataloged counterparts or to uti-lize this instrument’s high angular resolution to eliminate pos-sible blendings. Observations were obtained in the J, H and Ks photometric bands, using short exposures (10 − 30s) that
were dithered to account for the high sky background inher-ent to NIR observations.
The PANIC NIR imaging data were reduced using the Im-age Reduction and Analysis facility (IRAF; Tody 1986, 1993) and the PANIC Data Reduction Package for IRAF (Martini et al. 2004), taking into account the corresponding darks, sky flats and bad pixel maps obtained for each respective night. The absolute astrometry for the PANIC observations was de-rived using the 2MASS PSC and the Graphical Astronomy and Image Analysis Tool (GAIA; Draper et al. 2009). The positional accuracy of the 2MASS PSC is 0.001 (1σ, Skrutskie et al. 2006), and since there are usually many 2MASS sources in the field, a similar order of astrometric accuracy at the tar-get positions was reached. SExtractor (Bertin & Arnouts 1996) was used for source detection, and the calibration of the photometry was performed by applying 2MASS PSC pho-tometry to known 2MASS sources in the target fields. No cor-rection to the atmospheric extinction was applied as this effect is very small in the NIR (∼ 0.06 magnitudes in the H-band). The errors were obtained by comparing the NIR-magnitudes with 2MASS PSC magnitudes, and reflected average devia-tions from the 2MASS catalog magnitudes.
Optical photometric observations of the counterparts were ob-tained utilizing several Magellan instruments depending on availability. These included the Inamori Magellan Areal Cam-era and Spectrograph (IMACS; Dressler et al. 2006; Osip et al. 2008) and the Raymond and Beverly Sackler Magellan Instant Camera (MagIC; Osip et al. 2008) on the Baade telescope. These instruments provide access to different photometric fil-ters including Bessel B, V and R, and CTIO I.
The IMACS B, V , R and I imaging data were reduced using IRAF, in which the data were trimmed, overscan-corrected and flat-fielded. A dark current subtraction was not applied since the dark images showed it to be negligible. Standard stars were observed throughout in several bands, although the weather during some of the observing nights varied. The absolute astrometry was again computed using GAIA with comparisons to the USNO B1 Catalog or the 2MASS PSC. The photometry of each counterpart was calculated using SExtractorand was calibrated using the USNO B1 Cata-log.
MagIC observations were obtained in the V , R, and I bands. Short 30 s exposures were obtained in each filter, which were later combined to make sure that the brighter stars (used for astrometric referencing) were not saturated. These data were then reduced following standard procedures in IRAF: over-scan subtraction for each amplifier, flatfielded using dome flats, and the separate exposures combined. The astrometry was applied by referencing the observations to the 2MASS
PSC, resulting in an rms residual of 0.001 in each coordinate. Photometric calibration was derived using observations of the Stetson (2000) standard fields. The measured photometry for the airmass terms appropriate to Las Campanas Observatory were corrected and the zero-points with scatters of 0.02 mag-nitudes in each filter were obtained. Similarly to the PANIC and IMACS observations, the photometry of each counterpart was then measured using SExtractor.
2.4.2. Radio follow-up and ATCA Observations
Radio survey data already exist for all of the AGPS source regions, via the first and second epoch Molonglo Galactic Plane Surveys at 843 MHz (MGPS1 and MGPS2 respectively, 4300× 4300cosec|dec| resolution; Green et al. 1999; Murphy
et al. 2007), the 90cm Multi-configuration Very Large Array Survey of the Galactic Plane (4200 resolution; Brogan et al. 2006), The Multi-Array Galactic Plane Imaging Survey at 1.4 GHz (MAGPIS, 600 resolution; Helfand et al. 2006), and the Very Large Array (VLA) Galactic Plane Survey at 1.4 GHz (VGPS, 10resolution; Stil et al. 2006). To search for possible radio counterparts we first visually inspected the above sur-veys at the position of each ChIcAGO source. Any coincident radio emission was then categorized (see Section 3.4). Follow-up Australia Telescope Compact Array (ATCA) ob-servations were conducted to identify the nature of any radio counterparts to the ChIcAGO sources found through this vi-sual inspection. The ATCA was also used to resolve any dif-fuse radio emission surrounding a ChIcAGO source, allowing the detection of any underlying, compact radio counterpart. The high resolution ATCA observations were instrumental in confirming a positional coincidence between the radio coun-terpart and the Chandra position of the ChIcAGO source, to measure accurate radio fluxes and spectral indices, to broadly characterize variability with respect to earlier epochs, and to constrain the object’s spatial extent. The Chandra positions of ten ChIcAGO sources were observed with the ATCA on 2008 January 21 and on 2008 April 11. Each source was observed for ∼ 1 hour at each of 1.4, 2.4, 4.8 and 8.6 GHz over a 12 hour period with a 6km baseline configuration.
3. RESULTS
3.1. Chandra Results
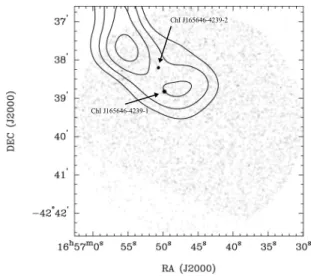
We present results on 93 APGS sources that have been ob-served with Chandra as part of the ChIcAGO survey. In many cases more than one source was detected within 30of the orig-inal AGPS source positions so, as mentioned in Section 2.2, we will refer to these all as ChIcAGO sources. We therefore detected a total of 253 ChIcAGO sources in these 93 Chan-draobservations. The naming convention we have adopted is to call each source by the AGPS coordinate name, using ChI as the prefix, with a suffix between 1 to i, where i is equal to the number of sources detected in the 30 field. (The source name order is based on the order that wavdetect detected and output the sources in ChIcAGO MAP.) For ex-ample, two ChIcAGO sources, ChI J165646–4239_1 and ChI J165646–4239_2, were detected with Chandra in the vicinity of the AGPS source AX J165646–4239. These two ChIcAGO sources are the black dots in Figure 6. The ASCA GIS detec-tion of AX J165646–4239 is overlayed on Figure 6 in the form of contours, demonstrating that both ChI J165646–4239_1
and ChI J165646–4239_2 may have contributed to the X-ray emission originally detected for this source in the AGPS.
Figure 6. The 30 radius field-of-view of the Chandra observation of the AGPS source AX J165646–4239, which is centered on the position of AX J165646–4239 as listed by Sugizaki et al. (2001). Two ChIcAGO sources, ChI J165646–4239_1 and ChI J165646–4239_2, which are black dots indi-cated by arrows, were detected with Chandra and are labeled on this Fig-ure. The black contours represent the smoothed ASCA GIS detection of AX J165646–4239 at 65%, 75%, 85%, and 95% of the peak count-rate.
The Chandra observations of the 93 AGPS sources are sum-marized in Table 1. This information includes the observation identification, the date of the observation, instrument (ACIS-S or HRC-I), and the exposure time. Table 1 also lists the ChIcAGO sources detected by ChIcAGO MAP within 30 of the ASCA position and their corresponding wavdetect po-sition, the offset of this position from the original AGPS tion, the 95% wavdetect and total ChIcAGO source posi-tion error, the background corrected net counts in the 0.3 −8.0, 0.5 − 2.0 and 2.0 − 8.0 keV energy ranges,27 and the median
energy quartile (E50) and quartile ratio (3 × (E25− 0.3)/(E75− 0.3)) used in quantile analysis (see Section 2.3.1).
The variability analysis performed by ChIcAGO MAP de-tected only one ChIcAGO source, ChI J170444–4109_1, with a χ2 exceeding the 99.9% short term variability threshold
(χ2= 80.6). However, this variability is not real as the
ACIS-S detection of ChI J170444–4109_1 fell in the chip gap be-tween the CCDs. This resulted in its light-curve displaying the Chandra spacecraft’s built-in dither as the source moved on and off the chip at regular intervals.28 No other ChIcAGO source had a χ2exceeding the 99.9% confidence threshold for
short term variability or periodicity. This does not, however, rule out the possibility that some of these sources are peri-odic as the Z12 period search technique is extremely limited for < 200 X-ray counts.
Several faint ChIcAGO sources were detected with wavdetect in the Chandra observations that are not
27The net counts were calculated separately for each energy range so there
are several cases where the total number of counts in the 0.3 − 8.0 keV energy range is slightly different to the sum of counts detected in the 0.5 − 2.0 and 2.0 − 8.0 keV energy ranges. These differences are due to rounding errors, as well as the exclusion of very soft counts that were detected between 0.3 − 0.5 keV. (The 0.3 − 0.5 keV energy range was excluded as the 0.5 − 2 keV energy band is more commonly used than the 0.3 − 2 keV energy band.)
28see http://cxc.harvard.edu/ciao/why/dither.html
suspected of being significant contributors to the ASCA counts detected in the AGPS. (All these faint sources are included in Table 1.) In order to determine the detection significance of these sources, we independently calculated the probability of a false detection (Pfd) for each source based on the Poisson statistics. We expect there to be ∼ 100000 trials in a 30 radius ACIS CCD field-of-view if a detection cell size of a 100 radius circle is assumed with 2D Nyquist sampling (Weisskopf et al. 2007). (A generic detection cell size of 100 for this detection significance calculation was suggested by Weisskopf et al. (2007) since the CIAO source detection algorithms usually use a detection cell size of between 40 − 80% of the PSF at a given energy.29) Pfd
= 10−5implies that there is one false source in the 30 radius
ACIS Chandra field. The probability of a false detection was calculated for each source (see footnote 13 in Kashyap et al. 2010). Only 11 sources (out of 253) have a Pfd > 10−5
but all have Pfd < 7 × 10⁻⁴. Several of these sources also
have a likely optical and/or infrared counterpart, increasing the significance of these detections. As this technique for calculating source significance is highly theoretical (e.g. the effective detection cell size of ACIS is likely to be slightly smaller than the 100radius circles), without any consideration for possible counterparts, we will include these 11 marginally significant sources in Table 1 (denoted by a * symbol in the first column).
Several of the sources detected in these observations have also been listed in the Chandra Source Catalog (CSC; Evans et al. 2010). We assume that a CSC source and a ChIcAGO source are the same if the separation between their two positions is less than the quadratic sum of their 95% error radii plus a constant term of 0.007, which accounts for the 95% abso-lute astrometry error of Chandra assuming the errors follow a Gaussian distribution30(see Equation (6) of Hong et al. 2005). We have conducted the same comparison with the fifth pub-lic release of the Second XMM-Newton Serendipitous Source Catalogue (2XMMi-DR3; Watson et al. 2009)31. The CSC
and 2XMMi-DR3 names that correspond to any ChIcAGO sources are listed in Table 1. Further analysis of the XMM observations will be conducted in future work.
The purpose of the ChIcAGO survey is to study those X-ray sources detected in the ChIcAGO Chandra observations that fall within the flux range of the AGPS sources (Fx∼
10−13to 10−12erg cm−2s−1). In 62 out of the 93 AGPS sources
observed with Chandra, ChIcAGO MAP found 74 sources with > 20 X-ray counts that fall within the investigated 30 field-of-view that is centered on the AGPS positions. For the purposes of this study we will focus on these 74 ChIcAGO sources, listed in Table 2, as they are approximately within the original AGPS flux range. The detailed analysis of those 179 ChIcAGO sources with < 20 counts will be deferred to future work. There were 6 AGPS sources where no ChIcAGO source was detected by Chandra: AX J165951–4209, AX J175331–2538, AX J180816–2021, AX J183607–0756, AX J185905+0333, and AX J191046+0917. At least three of these AGPS sources, AX J180816–2021, AX J185905+0333, and AX J191046+0917, may be transient given how bright
29See the CIAO detect manual http://cxc.harvard.edu/ciao/download/doc/detect_manual/ 30 The Chandra astrometric error is included in this calculation as the
source positions listed in the CSC can be obtained from more than one dataset.
they were in the original ASCA detections (Sugizaki et al. 2001). The remaining 25 AGPS fields observed with Chan-draonly have faint sources with < 20 X-ray counts. There are also 6 AGPS sources, AX J144519–5949, AX J151005–5824, AX J154905–5420, AX J194310+2318, AX J194332+2323, and AX J195006+2628, where multiple ChIcAGO sources detected in each region (with. 30 X-ray counts) sum to & 60 counts, which are close to the number of X-ray counts that were expected to be detected with Chandra from each AGPS source (see Section 2.1). Many of the ChIcAGO sources in these field also have optical and/or infrared counterparts and may therefore be members of star clusters (see Section 4.1 for further discussions).
The contribution of X-ray emission beyond the 30 search ra-dius was also investigated using wavdetect to identify all the point sources with > 20 X-ray counts in the Chandra ob-servations that lie between 30− 50from the original AGPS po-sition. Only 14 X-ray point sources were found in the 30− 50 annulus surrounding 11 AGPS sources, which demonstrates that the 30search radius used by ChIcAGO MAP is reasonable and has likely allowed us to identify the majority of ChIcAGO sources. These 14 X-ray point sources are further discussed in Appendix B where we explore the likelihood of whether they could be associated with their nearby AGPS source.
3.2. Quantile Analysis and Spectral Modeling Results Quantile analysis and spectral modeling using Cash statis-tics were both techniques used to infer the most likely ab-sorbed power-law and abab-sorbed thermal bremsstrahlung spec-trum of the bright ChIcAGO source detected by ACIS-S.32
The spectral parameters and the absorbed and unabsorbed X-ray fluxes for an absorbed power law and absorbed thermal bremsstrahlung model are listed in Tables 3 and 4, respec-tively. There are also six HRC-I detected ChIcAGO sources with > 20 counts (ChI J144042–6001_1, ChI J153818– 5541_1, ChI J163252–4746_2, ChI J163751–4656_1, ChI J165420–4337_1, and ChI J172642–3540_1) that are not in-cluded in Tables 3 and 4 as their X-ray observations do not contain any spectral information. The possible counterparts to these six sources are, however, explored in detail in Sec-tion 3.3.
There is no measure of goodness for the quantile analysis de-rived absorbed power-law and absorbed bremsstrahlung spec-tral parameters listed for the ChIcAGO sources in Tables 3 and 4. Instead a spectral interpolation is classified as un-reasonable if the resulting parameters are outside −2 < Γ < 4 for a power-law model and 0.1 < kT < 10 keV for a bremsstrahlung model. These parameter limits can allow for the grouping of the ChIcAGO sources into existing categories that are based on the physical understanding of X-ray sources that emit in the Chandra energy range (0.3 − 8 keV). While these selection criteria explicitly excludes the identification of new types of X-ray sources with unusual spectra, such an investigation is beyond the scope of this work. In all cases if one of the quantile analysis spectral interpolations was disre-garded for a given ChIcAGO source, the other is reasonable when considering the above criteria.
As a way to further explore the goodness of the spectral in-terpolations, the CIAO spectral fitting tool Sherpa was used
32ChIcAGO sources with > 20 X-ray counts for quantile analysis and
> 50 X-ray counts for spectral modeling.
to fit the X-ray spectrum of each ChIcAGO source with spec-tral parameters derived from quantile analysis in Tables 3 and 4. The χ2redwas calculated for each ChIcAGO source where > 40 X-ray counts was detected with ACIS-S. In many cases we found χ2
red < 1, which is not unexpected given the low
number of X-ray counts detected, indicating that any reason-able model is a decent fit. However, there are also a few cases where χ2
red> 2 indicating that the spectral parameters do not
adequately describe the spectrum. The values of χ2red corre-sponding to the quantile interpolated spectral parameters are included in Tables 3 and 4.
The parameters and fluxes resulting from the absorbed power law and absorbed thermal bremsstrahlung spectral modeling of the ChIcAGO sources have also been included in Tables 3 and 4 so that they can be directly compared to the quantile analysis results. Best fit absorbed power law parameters were obtained for all the ACIS-S detected ChIcAGO sources with > 50 X-ray counts (see Table 3). However, there were several cases where the absorbed thermal bremsstrahlung fitting was unsuccessful as the Sherpa modeling algorithm hit the hard maximum limit on the kT parameter (10 keV). These unsuc-cessful fits were not included in Table 4.
All of the parameters and absorbed fluxes derived from the Cash statistics spectral fitting agree within 3σ of those de-rived from the quantile analysis spectral interpolation, the majority of which agree within the 1σ errors. The only ex-ception is the kT parameter value for ChI J171910–3652_2. However, the unabsorbed fluxes were far less agreeable be-tween the two techniques as there were several ChIcAGO sources for which this value differed by > 3σ. These in-clude ChI J183356–0822_2 and ChI J184738–0156_1 from the power law spectral analysis and ChI J144547–5931_1, ChI J144701–5919_1, ChI J165646–4239_1, ChI J171910– 3652_2, ChI J172050–3710_1, and ChI J185608+0218_1 from the bremsstrahlung spectral analysis. Both these tech-niques therefore appear to be successful in constraining the spectral parameters and absorbed fluxes for each of the inves-tigated ChIcAGO sources but less successful in constraining the unabsorbed fluxes. It should also be noted that the major-ity of the reduced Cash statistics from the spectral modeling were systematically higher than the corresponding χ2
red
de-rived from the spectral parameters interpolated through quan-tile analysis.
3.3. Infrared and Optical Counterparts
Infrared and optical follow-up were primarily performed on those ChIcAGO sources with > 20 X-ray counts (see Table 2). In order to determine which optical and infrared sources are counterparts to ChIcAGO sources, we used a similar tech-nique to that described by Zhao et al. (2005), using their Equation (11). If the separation between a ChIcAGO source’s wavdetectposition and its possible counterpart is less than the quadratic sum of their 3σ position errors and the 3σ Chan-drapointing error33, then the X-ray and optical (or infrared)
sources are likely to be associated. The 1σ position errors for all sources in 2MASS PSC and the GLIMPSE34catalogs are
0.001 (Skrutskie et al. 2006) and 0.003, respectively. USNO B has an astrometric accuracy of < 0.0025 (Monet et al. 2003).
33http://cxc.harvard.edu/cal/ASPECT/celmon/
We have assumed that the error distributions of the Chandra observations, Chandra pointing, and USNO B Catalog are all Gaussian for the purposes of identifying possible counterparts to the ChIcAGO sources. While this assumption is not nec-essarily correct in every case, the full examination required to obtain the Gaussian errors would involve a very complicated approach. However, other Chandra Galactic plane X-ray sur-veys that search for multi-wavelength counterparts assuming Gaussian errors for cross-correlation purposes have had suc-cessful results (e.g. ChaMPlane; Zhao et al. 2005). Based on these results we feel that Gaussian errors are an acceptable assumption for the purpose of identifying optical and infrared counterparts to the ChIcAGO sources.
The infrared properties, such as the names and magnitudes of any likely 2MASS or GLIMPSE counterparts, together with the NIR magnitudes (J, H, and K) obtained from Magellan PANIC observations, are listed in Table 2 along with the date of each observation. We assume that those ChIcAGO sources with no listed 2MASS (or PANIC) counterpart have 2MASS PSC limiting magnitudes J > 15.8, H > 15.1, and K > 14.3 (Skrutskie et al. 2006). In Table 5, optical magnitudes have also been provided for those 44 ChIcAGO sources with > 20 X-ray counts that have optical counterparts in the USNO B1 Catalog or in one of the IMACS or MagIC Magellan obser-vations. Two other ChIcAGO sources (ChI J170017–4220_1 and ChI J181213–1842_7) with magnitude limits obtained with either IMACS or MagIC are also included in Table 5. Of the 74 ChIcAGO sources with > 20 X-ray counts listed in Table 2, 59 have a NIR counterpart, 44 of which are 2MASS sources and 15 of which were detected in PANIC observations. Looking into the mid-infrared wavelength bands, we find that 41 of these 2MASS sources and 3 of the PANIC sources also have GLIMPSE counterparts. NIR magnitude limits were obtained for 4 other PANIC-observed ChIcAGO sources, since any possible counterparts were too faint to be detected or, in the case of ChI J181116–1828_2 and ChI J185643+0220_2, the counterpart appeared to be blended. (ChI J181116–1828_2 does, however, have a unique GLIMPSE counterpart.) If we include ChI J181116–1828_2 and ChI J185643+0220_2, for which we have detected a counterpart but the magnitudes are only an upper limit due to blending, then 89% of our PANIC observations of ChIcAGO sources have yielded a detection in one of more of the J, H, or K filter bands. There are also a few ChIcAGO sources where the 2MASS counterpart magnitudes are listed as 95% confidence upper limits due to a non-detection or inconsistent deblending. We were therefore able to use PANIC to obtain more accurate magnitudes for 4 ChIcAGO sources for which have limited 2MASS magnitude information in one or more bands. (These 4 ChIcAGO sources can be identified as those with three letters listed in the “Data” column of Table 2.) All of the 46 ChIcAGO sources listed in Table 5 (44 ChIcAGO sources with optical counterparts and 2 with lim-iting magnitudes obtained with Magellan instruments) have NIR counterparts detected with either 2MASS or PANIC. Of the 44 with optical counterparts, 41 have USNO B1 coun-terparts, for 4 of which extra magnitude measurements were obtained with one of the two Magellan optical imagers. A further 3 ChIcAGO sources, uncataloged in USNO B1, were also detected in the optical with these Magellan instruments. Of the 74 ChIcAGO sources with > 20 X-ray counts, 14 do not have a detected optical, NIR or IR counterpart.
We conducted an experiment similar to that outlined in Ka-plan et al. (2004) to quantify the probability that the optical and infrared survey counterparts quoted in Tables 2 and 5, are a random chance association with the > 20 X-ray count ChIcAGO source of which they are coincident. We searched for all 2MASS, GLIMPSE and USNO B1 sources brighter than the possible counterpart listed in Tables 2 and 5 within 100 of each ChIcAGO source position. (We only searched for survey sources that have a brighter Ks, 3.6µm, and
sec-ond epoch R band magnitude for the 2MASS, GLIMPSE and USNO B1 surveys, respectively.) We then used the resulting statistics to determine the number of survey sources brighter than the listed counterpart that are likely to be detected within a region the same size as the ChIcAGO source’s 95% position error circle. We did this for each ChIcAGO source individ-ually as the density of sources can vary dramatically across the Galactic plane. In most cases the resulting chance of a random association is very low (< 0.01). Those ChIcAGO sources that have a random chance of association > 0.01 in either 2MASS or GLIMPSE are listed in Table 6. For each ChIcAGO source the chance of a random association with a USNO B1 is < 0.01.
We refer to the ChIcAGO sources that have < 20 counts as “secondary” sources. In Table 7 we list the names of any USNO B1, 2MASS and GLIMPSE sources that appear to be coincident with a secondary ChIcAGO source based on our position agreement criteria outlined in Section 2.4.1. This Table also includes the offset in arcseconds between the secondary ChIcAGO source’s wavdetect position and the position of the coincident survey source. (Only those secondary ChIcAGO sources that have a coincident survey source have been included in Table 7.) A summary of the fraction of ChIcAGO sources with a coincident source in the 2MASS, GLIMPSE and USNO B1 catalogs, can be found in Table 8. This Table includes the fraction of the total number of ChIcAGO sources, as well the fraction of just the > 20 X-ray count ChIcAGO sources, with a coincident survey source. (Note that we assume the coincident survey sources to the > 20 X-ray count ChIcAGO sources are counterparts based on the very low chance of random associations as demon-strated by Table 6.)
3.4. Radio Counterparts
As mentioned in Section 2.4.2, the position of each ChIcAGO source (above and below 20 X-ray counts) was visually in-spected for any possibly associated radio emission in the MGPS, MAGPIS, VGPS and the 90cm Multi-configuration Very Large Array Survey of the Galactic Plane. The results of this inspection are listed in Table 9. ChIcAGO source position comparisons were also made with the Green (2009) catalog of Galactic supernova remnants. Any possibly counterparts that are known objects, such as supernova remnants (SNRs), HII
regions, infrared dark clouds (IRDCs; Peretto & Fuller 2009), colliding-wind binaries (CWBs) or massive stars, are listed in Table 9 under “type”. However, if the radio sources are uncat-aloged, they have instead been flagged as being possibly com-pact, diffuse, or arc/shell structured diffuse emission. Two ChIcAGO sources, ChI J181116–1828_5 and ChI J184741– 0219_3, appear to be previously unidentified AGN as their coincident radio sources show core-lobe morphologies in the MAGPIS 1.4 GHz survey images.
associ-ation is then listed in Table 9 as being either coincident to, adjacent to, or on the limb of the radio source (such as on the limb of a SNR, diffuse emission or HIIregion). If a ChIcAGO source is listed as either coincident or on the limb of a SNR then this means it is within the extent of the SNR based on the SNR’s size quoted in the Green (2009) catalog. In the cases of the two candidate AGN, these ChIcAGO sources appear to be directly coincident with the core of the AGN. The name of each radio source and the corresponding reference are listed in Table 9.
The 10 ChIcAGO sources observed with the ATCA are also included in Table 9. The ATCA-detected compact radio counterparts to both ChI J144701–5919_1 and ChI J163252– 4746_2, aided in their identification as X-ray emitting massive stars or CWBs (see Anderson et al. 2011). No radio coun-terparts were detected for the other 8 ChIcAGO sources ob-served with the ATCA.
In summary, Table 9 shows there to be 16 ChIcAGO sources, from the Chandra observations of 8 different AGPS source regions, that are coincident, or on the limb, of 9 SNRs. There are 54 ChIcAGO sources, from 7 different AGPS source re-gions, that fall within the extent of 6 HIIregions. There are also 4 massive stars, all of which are confirmed or candidate CWBs (see Anderson et al. 2011; Motch et al. 2010), with radio counterparts. Only two ChIcAGO sources, both toward the same single AGPS target, are coincident with an IRDC. Several ChIcAGO sources also fall within regions of uncata-loged extended radio emission. These include 15 ChIcAGO sources, from 5 different AGPS source regions, falling within the extent of 5 regions of diffuse radio emission. Of these 15 ChIcAGO sources, there are 6 (from 3 different AGPS source regions) that are coincident with uncataloged diffuse emission with an arc or shell structure. Excluding the two AGN can-didates, there is only one other ChIcAGO source coincident with an unidentified compact radio source.
There are 74 ChIcAGO sources (14 sources with > 20 X-ray counts and 60 with < 20 X-ray counts), out of the 253 de-tected, with no optical or infrared counterparts, making them possible compact object candidates and therefore potentially detectable in the radio. We therefore searched for any possible pulsar counterparts in the Australia Telescope National Facil-ity Pulsar Catalogue (Version 1.4435 Manchester et al. 2005) but no known pulsars exist within 0.06 of the wavdetect po-sition of any of the 74 sources.
4. DISCUSSION
4.1. Unidentified ChIcAGO Sources with Radio Counterparts Table 9 lists 16 ChIcAGO sources that fall within the extent of 9 SNRs. X-ray point sources within SNRs could be associ-ated compact objects. Identification of an optical or infrared counterpart discounts such a possibility, since the optical/IR counterparts to neutron stars and other compact objects are expected to be very faint (for the details on this approach see Kaplan et al. 2004). Those SNR coincident ChIcAGO sources with a random chance of association > 0.01 in the USNO B1 and GLIMPSE catalogs are listed in Table 10. (The chance of a random association between one of these 16 ChIcAGO sources and a 2MASS catalog source is < 0.01.)
35http://www.atnf.csiro.au/research/pulsar/psrcat
Of the 16 ChIcAGO sources inside SNRs, only 5 have no op-tical or infrared counterparts. These 5 X-ray sources are all very faint, with < 8 X-ray counts detected for each in the ChIcAGO Chandra observations. These are ChI J145732– 5901_2 in SNR G318.2+0.1 (Whiteoak & Green 1996), ChI J182435–1311_2,3,4 in SNR G18.1–0.1 (Helfand et al. 2006; Brogan et al. 2006) and ChI J184447–0305_1 in SNR G29.3667+0.1000 (Helfand et al. 2006). Bocchino et al. (2001) has already reported on three X-ray sources within SNR G318.2+0.1 but not at the position of ChI J145732– 5901_2. Both SNR G18.1–0.1 and SNR G29.3667+0.1000 are newly discovered SNRs so little X-ray analysis has been done on these objects. Further investigation is required to de-termine if any of these 5 ChIcAGO sources are compact ob-jects and if they are associated with the surrounding SNRs. There are 54 ChIcAGO sources coincident with 6 different H
IIregions that were detected in the ChIcAGO Chandra obser-vations of 7 AGPS sources (see Table 9). Based on the results from X-ray observations of other H II regions (for example see Broos et al. 2007) it is possible that many of these 54 ChIcAGO sources could be pre-main sequence (PMS) stars, massive OB and WR stars, and CWBs. Simpson & Cotera (2004) also found optically obscured star clusters in 2MASS images within 10 of 3 of these AGPS sources; AX J144519– 5949, AX J151005–5824, and AX J162208–5005, which sup-ports a HIIregion and young and massive star interpretation for these ASCA sources. Of these 54 ChIcAGO sources, 43 have optical and/or infrared counterparts supporting a pos-sible stellar origin (see Tables 2, 5 and 7). In most cases the chance of random association with a field source is low (< 0.01). Those HIIregion coincident ChIcAGO sources for which the chance of random association with a 2MASS or GLIMPSE source is > 0.01 are listed in Table 11.
The possible nature of these HIIregion coincident ChIcAGO sources could be further investigated by comparing their lu-minosities to those of PMS stars, massive OB and WR stars, and CWBs. A spectral analysis of the 54 ChIcAGO sources is extremely difficult given that they all have ≤ 32 X-ray counts. However, the primary goal is to obtain a wide-band flux that can then be converted into a luminosity. Quantile analysis was therefore performed to obtain absorbed Mewe-Kaastra-Liedahl (Mekal; Mewe et al. 1985, 1986; Kaastra 1992; Liedahl et al. 1995) spectral interpolations of all the H
IIregion coincident ChIcAGO sources with ≥ 5 X-ray counts. A Mekal model was chosen as thin thermal plasma emission is expected from hot X-ray emitting stars (for example see Wolk et al. 2005; Sana et al. 2006). The absorbed Mekal spectral in-terpolations can be found in Table 11.
The luminosity of these ChIcAGO sources were calculated using kinematic distance estimates to the H II regions of
which they are coincident. Kinematic distances calculated by Russeil (2003) were used to calculate luminosities for the ChIcAGO sources coincident with G320.3–0.3, G333.6– 0.2, and G59.5–0.2. (Note that there is a more distant kine-matic distance estimate of 6.3 kpc to G59.5–0.2 calculated by Kuchar & Bania (1994) but we have decided to use the more recent estimate from Russeil (2003).) The kinematic dis-tances used in the luminosity calculations for G326.96+0.03 and G62.9+0.1 were obtained from McClure-Griffiths et al. (2001) and Fich & Blitz (1984), respectively. The kinematic distance to the massive young stellar object G316.8112– 00.0566 (Busfield et al. 2006), likely embedded within GAL