Publisher’s version / Version de l'éditeur:
Canadian Acoustics, 32, September 3, pp. 26-27, 2004-09-01
READ THESE TERMS AND CONDITIONS CAREFULLY BEFORE USING THIS WEBSITE.
https://nrc-publications.canada.ca/eng/copyright
Vous avez des questions? Nous pouvons vous aider. Pour communiquer directement avec un auteur, consultez la
première page de la revue dans laquelle son article a été publié afin de trouver ses coordonnées. Si vous n’arrivez pas à les repérer, communiquez avec nous à [email protected].
Questions? Contact the NRC Publications Archive team at
[email protected]. If you wish to email the authors directly, please see the first page of the publication for their contact information.
NRC Publications Archive
Archives des publications du CNRC
This publication could be one of several versions: author’s original, accepted manuscript or the publisher’s version. / La version de cette publication peut être l’une des suivantes : la version prépublication de l’auteur, la version acceptée du manuscrit ou la version de l’éditeur.
Access and use of this website and the material on it are subject to the Terms and Conditions set forth at
Speech recognition by grades 1, 3 and 6 children in classrooms
Bradley, J. S.; Sato, H.
https://publications-cnrc.canada.ca/fra/droits
L’accès à ce site Web et l’utilisation de son contenu sont assujettis aux conditions présentées dans le site LISEZ CES CONDITIONS ATTENTIVEMENT AVANT D’UTILISER CE SITE WEB.
NRC Publications Record / Notice d'Archives des publications de CNRC:
https://nrc-publications.canada.ca/eng/view/object/?id=9f1028bb-30cb-46f3-b691-d6bddabb2f90 https://publications-cnrc.canada.ca/fra/voir/objet/?id=9f1028bb-30cb-46f3-b691-d6bddabb2f90
Speech recognition by grades 1, 3 and 6 children in
classrooms
Bradley, J.S.; Sato, H.
NRCC-44731
A version of this document is published in / Une version de ce document se trouve dans : Canadian Acoustics/Acoustique canadienne, v. 32, no. 3, Sept. 2004, pp. 26-27
Speech Recognition by Grades 1, 3 and 6 Children in Classrooms
J.S. Bradley and H. SatobInstitute for Research in Construction, National Research Council, Montreal Rd. Ottawa, K1A 0R6 (b) current address: Institute for Human Science & Biomedical Engineering, Tsukuba, Japan
Introduction
This paper summarises the results of new acoustical measurements (for both occupied and unoccupied conditions) and speech recognition tests in 43 classrooms of grade 1, 3 and 6 students [1,2].
Speech and noise levels were measured during a regular teaching activity as well as during the speech tests. Room acoustics measurements were obtained from impulse response measurements for both occupied and unoccupied classrooms. The Word Intelligibility by Picture Identification (WIPI) test was used to measure speech recognition scores for varied signal-to-noise ratio (S/N).
Room Acoustics Measurements
Room acoustics quantities were obtained from impulse response measurements in the classrooms. A sine sweep
signal (covering the 6 octave bands from 125Hz to 4kHz) was used to obtain the impulse responses and was reproduced by a small loudspeaker with directional properties similar to a human talker. The speaker was set 1.5 m above the floor at the front of the room, where the teacher might normally stand. Sound level meters with digital wireless transmitters were located 1.2 m above the floor at 4 locations in each classroom.
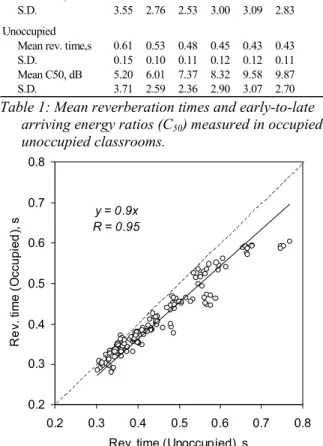
For the unoccupied classrooms, mid-frequency reverberation times varied from 0.3 to 0.7 s with a mean of 0.45s. When the classrooms were occupied, reverberation times were decreased by approximately 10% as shown in Fig.1. Early decay times indicated similar results. Table 1 gives mean reverberation time and early-to-late arriving sound levels for both occupied and unoccupied conditions.
Measurement of Speech and Noise Levels
125 250 500 1k 2k 4k A-weighted
Occupied
Mean rev. time,s 0.58 0.51 0.45 0.40 0.38 0.39 0.41
S.D. 0.14 0.09 0.10 0.11 0.09 0.08 0.09
Mean C50, dB 5.34 6.39 7.98 9.75 11.12 11.46 10.49
S.D. 3.55 2.76 2.53 3.00 3.09 2.83 2.68
Unoccupied
Mean rev. time,s 0.61 0.53 0.48 0.45 0.43 0.43 0.45
S.D. 0.15 0.10 0.11 0.12 0.12 0.11 0.11
Mean C50, dB 5.20 6.01 7.37 8.32 9.58 9.87 9.13
S.D. 3.71 2.59 2.36 2.90 3.07 2.70 2.63
Oct. band center frequency, Hz
Table 1: Mean reverberation times and early-to-late arriving energy ratios (C50) measured in occupied and
unoccupied classrooms. y = 0.9x R = 0.95 0.2 0.3 0.4 0.5 0.6 0.7 0.8 0.2 0.3 0.4 0.5 0.6 0.7 0.8
Rev. time (Unoccupied), s
R e v . t im e ( O c c upi ed ), s
Figure 1. Relation between measured reverberation times in occupied and unoccupied classrooms.
0 20 40 60 80 100 120 140 160 180 18 26 34 42 50 58 66 74 82 90 r.m.s. sound pressure level, dBA
F requenc y Estimated normal-distribution of noise Mean Level = 43.6 S.D.=2.8 Estimated normal-distribution of speech Mean Level = 58.0 S.D.=6.7 Sum. of estimated distributions Histgram of r.m.s. levels
Figure 2. Example distribution of sound levels measured over 200ms intervals in an active class.
It is very important to know the levels of teachers’ voices and classroom noises during actual teaching activity as well as levels during the speech tests. Distributions of recorded levels, at 200 ms intervals, were used to estimate separate speech and noise levels [3]. Two normal distributions were fitted to each histogram of A-weighted
0 1 2 3 4 5 6 7 8 20 25 30 35 40 45 50 55 60 65 70 75 80 85 90 r.m.s. sound pressure level, dBA
R e lat ive f req uency, % Noise Speech Speech
Mean Level = 59.5dBA S.D.=5.5
Noise
Mean Level = 49.1dBA S.D.=7.3
Figure 3 Relative frequency distributions of speech and noise levels from 28 classrooms.
levels as illustrated in Fig. 2. One distribution identified the noise and the other the teachers’ voice levels.
Fig. 3 presents distributions of the average speech and noise levels. Mean speech and noise levels were 59.5dBA and 49.1dBA respectively. The corresponding free field speech level 1m from the talker was estimated to be 68.8dBA. The results in Fig. 3 indicate an average S/N ratio of about 10 dB. It was estimated that only 2% of the cases would satisfy a S/N ≥ 15dBA criteria.
Speech Recognition test Results
The WIPI test was used because it is easy to explain to listeners of a wide range of ages. It consists of simple test words familiar to 5 year olds, which were presented in the carrier phrase, “Please mark the _____ now.” The students responded by placing a sticker on one of 6 pictures to indicate the correct word. The students sat at their desks in their regular classroom. The tests were carried out in 43 classrooms evenly distributed among grade 1, grade 3, and grade 6 students (6, 8, and 11 year olds). A total of 878 students were evaluated in 43 classrooms. Each grade 1 student was tested at 2 different S/N values and the other students at 3 different S/N values to give a total of about 2285 individual speech recognition tests.
The same sound source described above was used to reproduce the test sentences. Speech and noise levels were measured during each test using the statistical technique described above. These levels were used to determine S/N ratios for each test at each microphone position. There were on average 5 students near each microphone.
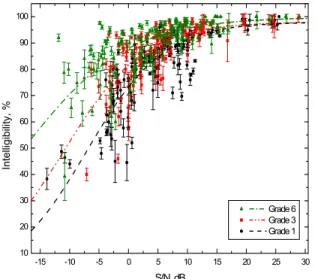
Figure 4 shows the mean speech intelligibility scores of each group of students associated with a particular measurement microphone position. They are plotted versus S/N separately for the grades 1, 3 and 6 students. An analysis of variance of the scores showed that there were
highly significant main effects of student age and S/N as well as a significant interaction effect of these 2 independent variables. That is, although there is significant scatter in the results, there are highly significant effects related to the age of the listeners. The younger children clearly need higher S/N to obtain the same intelligibility scores as the older children in these tests. The large scatter at lower S/N values is probably indicative of how students react to more difficult listening conditions. At lower S/N, some students can still do quite well, but others more or less give up and get much lower scores. The performance of the 3 age groups can be compared by considering the required S/N for a 95% intelligibility score as indicated by the mean trend lines. While grade 6 students could, on average, achieve 95% correct scores for a S/N of +8.5 dB, the grade 3 students required +12.5 dB S/N and the grade 1 students +15.5 dB S/N. In this case there is a 7 dB difference between the needs of grade 1 and grade 6 students. Of course many students score below this mean trend. For very high S/N cases (+25 to +30 dB), the grade 1 and 3 students scored ~98% correct and the grade 6 students ~99.5% correct, indicating that all students can do very well on the WIPI test in actual classrooms when there is minimal masking noise.
Conclusions
The results clearly show the importance of better conditions, with lower noise levels, for younger students. However, it will not be obvious to adult listeners that younger children cannot understand speech in moderately noisy conditions.
Acknowledgements
The authors are grateful for the financial support and collaboration of the Canadian Literacy and Language Research Network and for the help of Ms. Kimberlee Cuthbert in carrying out these experiments. They are also very appreciative of the help of the audio group at the Banff Centre for their help in editing the speech recordings and to the many teachers and students who participated. -15 -10 -5 0 5 10 15 20 25 30 10 20 30 40 50 60 70 80 90 100 Grade 6 Grade 3 Grade 1 Intelli gibili ty , % S/N, dB
Figure 4. Mean speech intelligibility scores versus S/N by school grade.
References
1.
2.
3.
Sato, H. and Bradley, J.S., “Evaluation of acoustical conditions for speech communication in active elementary school classrooms”, Paper Tu4.B1.1, Proceedings of the 18th International Congress on Acoustics, Kyoto (2004).
Bradley, J.S, and Sato, H., “Speech Intelligibility Test Results for Grades 1, 3 and 6 Children in Real Classrooms”, Paper Tu4.B1.2, Proceedings of the 18th International Congress on Acoustics, Kyoto (2004). M. R. Hodgson, R. Rempel and S. Kennedy: Measurement and prediction of typical speech and background-noise levels in university classrooms during lectures, J.
Acoust. Soc. Am. 105, 226-233 (1999).