Publisher’s version / Version de l'éditeur:
Vous avez des questions? Nous pouvons vous aider. Pour communiquer directement avec un auteur, consultez la première page de la revue dans laquelle son article a été publié afin de trouver ses coordonnées. Si vous n’arrivez pas à les repérer, communiquez avec nous à [email protected].
Questions? Contact the NRC Publications Archive team at
[email protected]. If you wish to email the authors directly, please see the first page of the publication for their contact information.
https://publications-cnrc.canada.ca/fra/droits
L’accès à ce site Web et l’utilisation de son contenu sont assujettis aux conditions présentées dans le site LISEZ CES CONDITIONS ATTENTIVEMENT AVANT D’UTILISER CE SITE WEB.
vAudio Engineering Society 117th Convention[Proceedings], pp. 1-11,
2004-10-01
READ THESE TERMS AND CONDITIONS CAREFULLY BEFORE USING THIS WEBSITE. https://nrc-publications.canada.ca/eng/copyright
NRC Publications Archive Record / Notice des Archives des publications du CNRC :
https://nrc-publications.canada.ca/eng/view/object/?id=3a702211-5337-49a1-b636-a235a74e2d1f https://publications-cnrc.canada.ca/fra/voir/objet/?id=3a702211-5337-49a1-b636-a235a74e2d1f
NRC Publications Archive
Archives des publications du CNRC
This publication could be one of several versions: author’s original, accepted manuscript or the publisher’s version. / La version de cette publication peut être l’une des suivantes : la version prépublication de l’auteur, la version acceptée du manuscrit ou la version de l’éditeur.
Access and use of this website and the material on it are subject to the Terms and Conditions set forth at
Directional measurement of airborne sound transmission paths using a
spherical microphone array
Directional measurement of airborne sound
transmission paths using a spherical microphone
array
Gover, B.N.
NRCC-48315
A version of this document is published in / Une version de ce document se trouve dans :
Audio Engineering Society 117
thConvention, San Francisco, CA.,
Oct. 28-31, 2004, pp. 1-11
Audio Engineering Society
Convention Paper
Presented at the 117th Convention 2004 October 28–31 San Francisco, CA, USA
This convention paper has been reproduced from the author's advance manuscript, without editing, corrections, or consideration by the Review Board. The AES takes no responsibility for the contents. Additional papers may be obtained by sending request and remittance to Audio Engineering Society, 60 East 42nd Street, New York, New York 10165-2520, USA; also see www.aes.org. All rights reserved. Reproduction of this paper, or any portion thereof, is not permitted without direct permission from the
Journal of the Audio Engineering Society.
Directional measurement of airborne sound
transmission paths using a spherical
microphone array
Bradford N. Gover
Institute for Research in Construction, National Research Council, Ottawa, Ontario, K1A 0R6, Canada [email protected]
ABSTRACT
A spherical microphone array has been used to perform directional measurements of airborne sound transmission between rooms. With a source and array on opposite sides of a wall, omnidirectional impulse responses were measured to each of the array microphones. Beamforming resulted in a set of directional impulse responses, which were analyzed to find the distribution of arriving sound energy at the array position during various time ranges. Weak spots in the separating wall are indicated as directions of increased arriving sound energy. The system was able to identify minor defects in a test wall in between two reverberation chambers, and also to identify leaks in the wall of an actual meeting room.
1. INTRODUCTION
In buildings, the walls and floors that separate rooms from each other also provide acoustical isolation. In some cases this may be of little importance, but more often acoustical isolation is a requirement, and efforts are made to maximize the attenuation between spaces. Means of assessing the performance of building partitions in regard to sound isolation are of continual interest.
Commonly, the performance of an individual partition (e.g., wall, floor) is rated according to standard test procedures. For instance, ASTM E90 [1] and ISO 140– 3 [2] describe controlled laboratory test procedures of
individual building elements, while ASTM E336 [3] and ISO 140–4 [4] describe field test procedures in actual buildings. These approaches usually give an indication of the average, overall performance of the partition or system. Any localized sound leaks or weak spots in an otherwise highly-insulating partition will not necessarily be identified.
In many practical instances, there can be such leaks or weak spots. Any intrusions made into a wall (for instance, to install electrical outlet boxes, ductwork, or cabinets) or any artifacts of sloppy workmanship (such as gaps left between sheets of drywall or around the edges of partitions) can potentially lead to problems. Of course, it would depend on the severity of the “leak” and on the specific application as to whether a particular construction is problematic. In cases where a problem
has been noticed, or in making efforts to identify the likelihood of one, the task can become one of identifying the location of a leak.
It is in regard to this latter topic (finding weak spots) that the current work was performed. The motivation arose from ongoing work in developing methods to assess the speech security (privacy) of meeting rooms, where even a slight “hot spot” in a wall can potentially compromise an otherwise “speech secure” room [5]. This paper describes initial efforts to employ a previously developed directional sound measurement system for these purposes.
2. SPHERICAL ARRAY MEASUREMENT SYSTEM
The measurement system used in the present work is based on a spherical microphone array, together with associated acquisition and analysis hardware and software. The system has been previously described [6], and has previously been used to analyze sound within rooms [7]. The array is used as a directional detector to analyze sounds arriving only from within its beam aperture. The procedure is as follows: an MLS test signal is played over a loudspeaker to establish a sound field; the (omnidirectional) impulse response is calculated for each array microphone in the usual manner [8]; filter-and-sum beamforming results in a directional impulse response, which is calculated simultaneously for 60 steering directions, distributed over all 3D directions. This set of directional impulse responses is analyzed to identify the variation of arriving sound with time and direction.
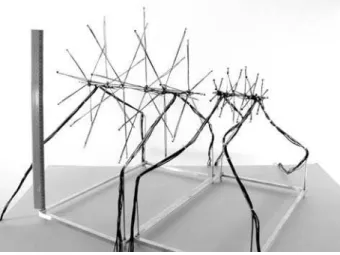
The array geometry, shown in Fig. 1, is that of a geodesic sphere. The 32 omnidirectional microphones (Panasonic WM-61A102B electrets) are located at the vertices of a “truncated icosahedron”, shown in Fig. 1 with dotted lines. The 60 steering directions are through the centres of the triangular faces of this polygon. Two different-sized (free-field) arrays were constructed, to operate over different frequency bands. A photograph of both the 16 cm-diameter and 48 cm-diameter arrays is shown in Fig. 2.
Figure 1 Microphone locations (black dots) for 32-element spherical arrays (locations on back half of sphere not shown). The steering directions are through the centres of the triangular faces of the geodesic sphere (dotted lines).
Figure 2 Photograph of 48 diameter and 16 cm-diameter arrays.
The beamforming filters were designed to yield a beam with a directional gain of at least 14 dB over a broad frequency range [6] (compare to 6 dB for a first-order hypercardioid microphone). In this work, however, the analysis was performed in one-third-octave bands. The beam patterns of the 48 cm-diameter array in the 800 Hz 1/3-octave band, and that of the 16 cm-diameter array in the 2500 Hz 1/3-octave band are shown in Fig. 3. The 3-dB beamwidth of the patterns is about 28 degrees (compare to 105 degrees for the hypercardioid).
Gover Directional Measurement of Transmission Paths 0 30 60 90 120 150 180 210 240 270 300 330 0 dB −20 dB
Figure 3 Beampatterns of 48 cm-diameter array in 800 Hz 1/3-octave band (dashed curve) and 16 cm-diameter array in 2500 Hz 1/3-octave band (solid curve). (The two curves are almost coincident.)
A multichannel sound card (Echo Layla24) was used to play the MLS stimulus over an omnidirectional loudspeaker, and to simultaneously record signals from 8 of the array microphones. This procedure was repeated until the signals from all 32 array microphones were acquired. (It was assumed that the system was time invariant over the time taken to perform these measurements.)
3. MEASUREMENTS
Two series of measurements were conducted. First, in the wall testing facility at the National Research Council in Ottawa, a test wall was constructed between two reverberation chambers. Sound transmission was measured through this wall with and without various types of leaks and holes, and with and without absorptive material in the receiving room. Second, sound transmission from an actual meeting room to an adjoining space was measured.
3.1. Test Wall
The test wall used in the reverberation room facility was of a fairly common type. It had a single row of 90 mm wood studs (610 mm on centre), with a single layer of 16 mm drywall directly attached to the studs on one side, and a single layer of 16 mm drywall mounted on 13 mm resilient channels (610 mm on centre) on the other side. The cavity was completely filled with glass fibre batts. A standard ASTM E90 test was performed
and the wall was found to have an STC rating of 52. The transmission loss (TL) versus frequency curve for the wall is shown in Fig. 4 (solid curve).
The arrangement of equipment in the facility was the same for all tests. The wall sample filled the 2.44-by-3.66 m (8-by-12 ft) opening between the reverberation chambers. The omnidirectional source was located about 2.3 m from the middle of the wall in the so-called “large” chamber (volume = 251 m3, reverberation time in 800 Hz octave band = 3.8 s, in 2500 Hz 1/3-octave band = 3.0 s). The array was located about 80 cm in front of the middle of the wall in the so-called “small” chamber (volume = 138 m3, reverberation time in 800 Hz octave band = 4.3 s, in 2500 Hz 1/3-octave band = 3.0 s). For each arrangement, measurements were also made with eight 1.2-by-1.8 m (4-by-6 ft) pieces of 10 cm thick absorptive foam in the small chamber with the array. The foam was placed on the floor and against the (non-test) walls, and lowered the reverberation times to 0.65 s and 0.60 s in the 800 Hz and 2500 Hz 1/3-octave bands, respectively. This is more typical of reverberation times in rooms in offices and residences.
Figure 4 Transmission Loss (TL) curves for test wall: with no intentional leaks (solid curve, filled diamonds); with a slit in one side (dotted curve, open squares); and with a small hole in both sides (dashed curve, open triangles).
AES 117th Convention, San Francisco, CA, USA, 2004 October 28–31
3.1.1. Test Wall: No intentional leaks
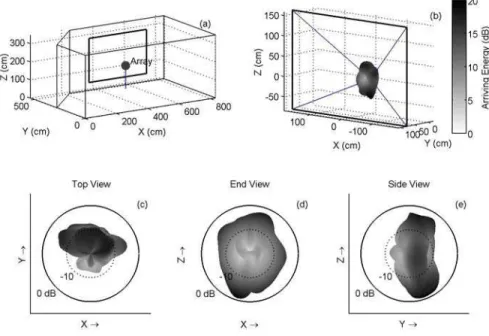
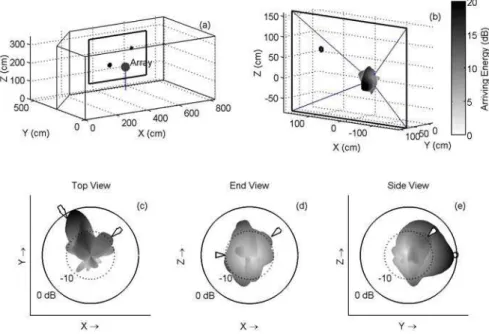
Measurements made with the arrays are presented in Fig. 5 for the 800 Hz 1/3-octave band and in Fig. 6 for the 2500 Hz 1/3-octave band, for no absorption in the receiving room. Panel (a) of the figures shows the setup in the reverberation chamber, with the test wall indicated by heavy lines. Panels (b)–(e) all show different views of the same plotted surface. The radius and grey level of the surface are proportional to the level of sound received from that direction, over the stated time range, relative to the peak directional arrival. For both Figs. 5 and 6, the energy arriving at the array position during the first 50 ms of the impulse response is plotted. Panel (b) shows a view “through” the wall, which is indicated with the heavy lines. Lighter lines join the array position (at the centre of the surface) to
each of the four corners of the test wall. Panels (c)–(e) show views of the surface from along the Z, Y, and X axes (as defined in panel (a)).
Notice from Fig. 5 that there seemed to be a sound arrival from the middle top of the wall. This is most evident from panel (e). This is attributed to an unintentional crack or leak at the top of the wall. There was a seam between two sheets of drywall in the middle of the wall. It is possible that the top was not finished correctly. However, any such leak is likely minor since, as mentioned previously, the wall was tested to have an STC of 52. Also, notice from Fig. 6 that this arrival is not evident at 2500 Hz. In fact, at 2500 Hz, the arriving energy surface indicates that most of the arriving sound comes from the edges of the test wall.
Figure 5 Measurement made with 48 cm-diameter array, 800 Hz 1/3-octave band, first 50 ms of impulse response, no intentional leaks in the wall.
Gover Directional Measurement of Transmission Paths
Figure 6 Measurement made with 16 cm-diameter array, 2500 Hz 1/3-octave band, first 50 ms of impulse response, no intentional leaks in the wall.
3.1.2. Test Wall: Slit in one side
The seam in the middle of the “receiving” side of the wall—that is, the side facing the array—was widened to measure about 5 mm. Such a gap could easily arise in practice through improper cutting or installation of drywall. This “slit” is in one layer of drywall only (the layer mounted on resilient channels), and there is a stud behind the slit. The direct-attached side of the wall (the source side) was not modified. The STC of the wall after these modifications was measured to be 50 (compared to 52 with no intentional leaks). The TL curve is also shown in Fig. 4 (dotted curve).
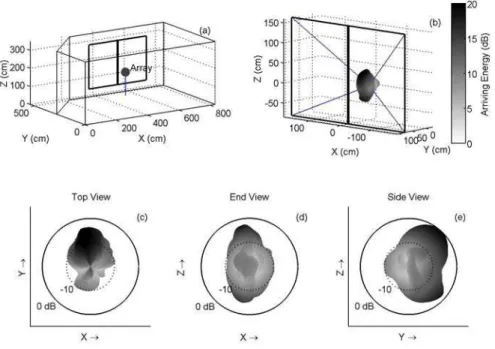
Figures 7 and 8 plot the arriving energy over the first 50 ms of the impulse response for the 800 Hz and
2500 Hz 1/3-octave bands, respectively, for no absorption in the receiving room. It is evident from comparison of Figs. 5 and 7 and of Figs. 6 and 8 that sound energy is indeed “leaking” through the slit. This is perhaps more obvious at 2500 Hz (Figs. 6 and 8) than at 800 Hz (Figs. 5 and 7). Furthermore, if a more restrictive time range is used, the slit transmission becomes even more apparent. Refer to Fig. 9, which shows the measurement for the 2500 Hz band, summing the arrival over the first 35 ms of the impulse response only. The arrivals from the edges of the test wall are reduced relative to the slit transmission.
AES 117th Convention, San Francisco, CA, USA, 2004 October 28–31
Figure 7 Measurement made with 16 cm-diameter array, 2500 Hz 1/3-octave band, first 50 ms of impulse response, with a 5 mm slit in one side of the wall.
Figure 8 Measurement made with 16 cm-diameter array, 2500 Hz 1/3-octave band, first 50 ms of impulse response with a 5 mm slit in one side of the wall.
Gover Directional Measurement of Transmission Paths
Figure 9 Measurement made with 16 cm-diameter array, 2500 Hz 1/3-octave band, first 50 ms of impulse response with a 5 mm slit in one side of the wall.
3.1.3. Test Wall: Holes in drywall
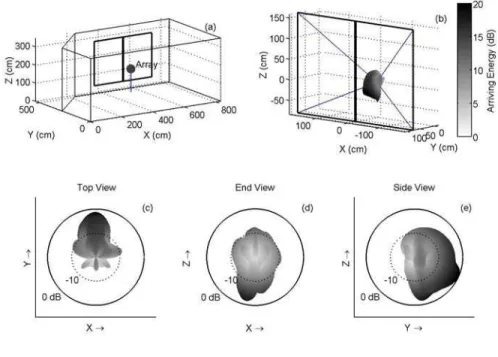
After the slit was caulked and taped, holes were cut in the drywall. The situation for the measurements shown in Figs. 10 and 11 had a 15 cm-square hole on the source side and an 8-by-10 cm hole on the receiving side of the wall. The directions to these holes are indicated on panels (c)–(e) with arrows pointing inward. There was no absorption in the receiving room. The holes were cut through one layer of drywall only, and the glass fibre batts were left untouched. The holes did not line up; one was to the left of the array, the other was to the right and slightly above the array. The STC of the wall in this condition was measured to be 51 (as compared to 52 with no intentional leaks). The TL curve is also shown in Fig. 4 (dashed curve).
Notice from Fig.10, panel (c) in particular, that at 800 Hz, the directions to both holes are readily detectible. Figure 11 indicates that neither hole is detected at 2500 Hz, which is not surprising given the size of the holes relative to the wavelength [9], [10], and the fact that the glass fibre still present is an effective absorber at this frequency.
As an illustration that absorption in the receiving room does not greatly aid in the detection of the leaks, refer to Fig. 12, and compare to Fig. 10. The reverberation time in the 800 Hz 1/3-octave band in the receiving room was cut from 4.3 s to 0.65 s with the addition of the absorption, yet even in the highly reverberant case, the leaks could be identified.
AES 117th Convention, San Francisco, CA, USA, 2004 October 28–31
Figure 10 Measurement made with 48 cm-diameter array, 800 Hz 1/3-octave band, first 50 ms of impulse response with a hole in both sides of the wall.
Figure 11 Measurement made with 16 cm-diameter array, 2500 Hz 1/3-octave band, first 50 ms of impulse response with a hole in both sides of the wall.
Gover Directional Measurement of Transmission Paths
Figure 12 Measurement made with 48 cm-diameter array, 800 Hz 1/3-octave band, first 50 ms of impulse response with a hole in both sides of the wall and absorption added to receiving room.
3.2. Meeting Room
A measurement was made from a meeting room into an adjoining space. The wall separating the source and array was a common “demountable” wall, but had two rather severe problems: the door and a vent grille. The top half of the door contained a 60-by-76 cm (24-by-30 inch) single pane of glass, while the bottom half contained a 40-by-55 cm (16-by-22 inch) hole filled only by metal louvers. The grille was a 27-by-35 cm
(11-by-14 inch) hole cut clear through the wall at the other end of the room, and was covered on both sides by only a see-through metal grille.
Figure 13 shows two views of the surface of arriving energy over the first 35 ms of the impulse response, measured at the 48 cm-diameter array position for the 800 Hz 1/3-octave band. From the top view, panel (b), it is evident that both the closed door and grille are sources of incident sound.
AES 117th Convention, San Francisco, CA, USA, 2004 October 28–31
Figure 13 Measurement outside meeting room with 48 cm-diameter array, 800 Hz 1/3-octave band, first 35 ms of impulse response. The closed door and grille are indicated with heavy lines.
4. CONCLUSIONS
The measurements presented herein indicate that the spherical array measurement system is capable of identifying weak spots in partitions separating rooms, both in a controlled laboratory situation and in a real building.
The types of weak spots included a slit and a hole. The detectability of these defects varied with frequency, as one would expect, since the degree to which a hole or slit transmits sound also varies with frequency [10]. The measurements made on the test wall included minor defects that resulted in a TL change of only 1-2 dB, and a measured STC change of only 1-2. These defects were nevertheless detectible with the present system. It may be arguable as to whether “leaks” as small these are of any practical importance, and indeed for many instances they may not be. However, recent work on measures suitable for low or zero intelligibility indicates that small changes in signal level can lead to large increases in intelligibility, particularly when near the threshold of intelligibility [5]. This could potentially mean that a seemingly insignificant weak spot in a partition could have important implications for the security or privacy of conversations occurring nearby. At any rate, before the importance of a leak or weak spot in the wall can be gauged, the spot must be identified. The present approach seems capable of finding such weak spots in a reliable and effective manner, even in conditions of high reverberation.
5. REFERENCES
[1] ASTM E90-99, “Standard Test Method for Laboratory Measurement of Airborne Sound Transmission Loss of Building Partitions and Elements,” Am. Soc. for Testing and Materials, Consohocken, PA, USA.
[2] ISO 140-3:1995, “Measurement of sound insulation in buildings and of building elements – Part 3: Laboratory measurements of airborne sound insulation of building elements,” International Organization for Standardization, Geneva, Switzerland.
[3] ASTM E336, “Standard Test Method for Measurement of Airborne Sound Insulation in Buildings,” Am. Soc. for Testing and Materials, Consohocken, PA, USA.
[4] ISO 140-4:1998, “Measurement of sound insulation in buildings and of building elements – Part 4: Field measurements of airborne sound insulation between rooms,” International Organization for Standardization, Geneva, Switzerland.
[5] B.N. Gover and J.S. Bradley, “Measures for assessing architectural speech security (privacy) of closed offices and meeting rooms,” to appear in J. Acoust. Soc. Am. (accepted August 2004).
[6] B.N. Gover, J.G. Ryan, and M.R. Stinson, “Microphone array measurement system for analysis of directional and spatial variations of
Gover Directional Measurement of Transmission Paths
AES 117th Convention, San Francisco, CA, USA, 2004 October 28–31
Page 11 of 11 sound fields,” J. Acoust. Soc. Am., 112, 1980–1991 (2002).
[7] B.N. Gover, J.G. Ryan, and M.R. Stinson, “Measurements of directional properties of reverberant sound fields in rooms using a spherical microphone array,” to appear in J. Acoust. Soc. Am (accepted July 2004).
[8] D.D. Rife and J. Vanderkooy, “Transfer-function measurement with maximum-length sequences,” J. Audio Eng. Soc., 37, 419–444 (1989).
[9] J.S. Bradley, “Insulating Buildings Against Aircraft Noise: A Review,” IRC Internal Report IR-760, March 1998. Available online at http://irc.nrc-cnrc.gc.ca/ircpubs/
[10] D.J. Oldham and X. Zhao, “Measurement of the sound transmission loss of circular and slit-shaped apertures in rigid walls of finite thickness by intensimetry,” J. Sound and Vib., 161, 119–135 (1993).