HAL Id: hal-01883581
https://hal.archives-ouvertes.fr/hal-01883581
Submitted on 28 Sep 2018
HAL is a multi-disciplinary open access
archive for the deposit and dissemination of
sci-entific research documents, whether they are
pub-lished or not. The documents may come from
teaching and research institutions in France or
abroad, or from public or private research centers.
L’archive ouverte pluridisciplinaire HAL, est
destinée au dépôt et à la diffusion de documents
scientifiques de niveau recherche, publiés ou non,
émanant des établissements d’enseignement et de
recherche français ou étrangers, des laboratoires
publics ou privés.
Detecting Flutter Waves in the Electrocardiogram Using
Generalized Likelihood Ratio Test
Muhammad Haziq Azman, Olivier Meste, Kushsairy Kadir
To cite this version:
Muhammad Haziq Azman, Olivier Meste, Kushsairy Kadir. Detecting Flutter Waves in the
Electro-cardiogram Using Generalized Likelihood Ratio Test. Computing in Cardiology, Sep 2018, Maastricht,
Netherlands. �hal-01883581�
Detecting Flutter Waves in the Electrocardiogram Using Generalized
Likelihood Ratio Test
Muhammad Haziq Kamarul Azman
1 2, Olivier Meste
1, Kushsairy Kadir
21
Universit´e Cˆote d’Azur, CNRS, I3S, France
2Universiti Kuala Lumpur, Malaysia
Abstract
Accurate detection of f waves during atrial flutter is dif-ficult. However, f waves contain information on the pathol-ogy and are useful for non-invasive diagnosis. The setup and difficulties of f wave detection lends itself to the use of statistical signal detection techniques. Real-life con-straints can be modeled in the signal observation using several parameters in order to produce signal detectors with good performance. Several detectors were developed and tested using real 12-lead ECG recordings with man-ually annotated f wave markers available. At the end, a simple detector is obtained with relatively good detection performance (AUC = 0.89, (Se, Sp) = (0.87, 0.76)) and a threshold is available for use in automatic detection of f waves.
1.
Introduction
In many cases, it is necessary to detect and delineate different deviations (P, Q, R, S and T waves) visible on an electrocardiogram (ECG) to obtain diagnostic information on cardiac pathologies in a non-invasive manner. This al-lows us to obtain different timing and morphology-related measures which are closely related to cardiac functionality. In supra-ventricular arrhythmia such as atrial flutter (AFL), the P wave, commonly referred to as f waves is of interest. They represent the continuous pathological ac-tivation of the atrium, driven by depolarizing wavefronts rotating around both atria using a specific circuit. A beat-to-beat study of these f waves have shown to provide useful information for localizing AFL circuits [1].
Accurate detection of these f waves is difficult as their amplitudes are small compared to noise and other devia-tions. During low atrio-ventricular conduction blocks (< 3:1), they can be overlapped by T waves. Furthermore, ECG recordings are usually embedded in noise that are non-Gaussian. Remarkably, the description above can be represented as mathematical signal models. This allows the use of statistical signal detection techniques [2]. They
allow us to obtain detectors which can be parameterized to account for e.g. weak-amplitude signals, T wave overlaps and non-Gaussian noise distribution.
In this paper, we develop several detectors using the generalized likelihood ratio test (GLRT) procedure [2]. The development accounts for several variations of the ob-served signal model, which allow us to better model real-life constraints. We then test these detectors using real 12-lead AFL recordings with known f wave onset markers and evaluate their performance using standard metrics. Finally, we show how the detection threshold, used to decide if a signal is present or not is learned using a simple machine learning approach. The threshold value can be then be used for automatic detection of f waves.
2.
Methodology
2.1.
Dataset and workbench
25 recordings of 12-lead ECG from the Centre Hospital-ier Princesse Grace in Monaco were acquired from patients with AFL during ablation procedures using an acquisition system (Bard, USA). All signals were filtered and down-sampled to 250 Hz. The recordings contain manual anno-tations of f wave onsets (2926 manual annoanno-tations in to-tal). Algorithms were implemented in MATLAB R2014b (MathWorks, USA) on a machine equipped with an Intel Core i7 6500U processor running at 3GHz and 8GB of memory.
2.2.
Detection setup
f waves manifest on the ECG as a continuous waveform with a relatively stable beat-to-beat morphology. It is of-ten possible to find a single f wave not overlapped on top of QRS or T waves, usually just before the onset of a QRS complex. This single f wave s of length N was manually segmented and serves as a reference for the signal of inter-est. Throughout the ECG recording, we observe multiple f waves which can be thought of as a version of the ref-erence modulated by a factor A and delayed by an integer
n1.
ECG recordings are typically perturbed by noise w orig-inating from various sources. These noise are randomly distributed and has an associated probability density func-tion (PDF) p(w). In this paper, we consider two distribu-tions: normal Gaussian and Laplacian. The latter is par-ticularly common with electrophysiological signals, where the noise tends to be spiky and have a heavy-tailed distri-bution. For simplicity, we assume that the noise is inde-pendent and identically distributed from sample to sample. Given a sample x of the recording data from a single lead, we aim to decide between a signal-present (H1) and
signal-absent (H0) hypothesis, formulated as follows:
H0: x = w
H1: x = Asn1+ w
It is shown that the detector which obtains optimum de-tection performance in this setup is found by calculating the likelihood ratio [2]:
L(x) =p(x; A, n1, σ 2 w1, H1) p(x; σ2 w0, H0) H1 ≷ H0 γ (1)
where the PDFs are parameterized by A, n1and σ2wunder
each hypotheses, and γ is the detection threshold. When the likelihood ratio value is above γ, we decide H1is true,
and if it is below γ, we decide H0is true.
2.3.
Parameter estimation
The parameterized PDF depends on the values of the pa-rameters and must be resolved to obtain a usable detector. Values are assumed to be either known or unknown. This allows the full use of any prior available information, and in the latter case, allows them to be estimated.
σ2
wwas estimated using the maximum likelihood (ML)
technique [3]. The logarithm of (1) was differentiated with respect to σ2
wand set equal to 0. This can be thought of as
estimating the value of σw2 which minimizes the slope of
the PDF curve, or which maximizes the PDF value for a given x.
The value of A should be strictly positive; ML estima-tors are by default unconstrained. To obtain a constrained version, we used a non-negative least squares algorithm to estimate A under Gaussian noise [4]. Under Laplacian noise, the ML estimation of A consists of minimizing the sum of absolute values, and is solved using the method of steepest descent [5].
The estimator of n1is ˆn1 = arg maxn1L(x) [2]. This
is done by sliding the reference signal across the whole recording, and calculating the detector output at each time instant. The estimate for n1is then the peak of the output.
2.4.
Detector expressions
The detector is obtained by developing (1), after resolv-ing all parameter values. The top half of Table 1 sum-marizes the different single-lead detector expressions as-suming the combination of known or unknown parameter values. The lead of choice was selected as the one with the largest energy ratio between s and its corresponding QRS complex. ˆA indicates an estimate of A using the technique discussed previously. Detector D5is known as an
approx-imate to the original GLRT [2], with sgn the operator that outputs the sign of its argument. The symbolTindicates a
transpose.
2.5.
T wave model and multilead
exten-sions
The signal model can be modified to account for T waves that may overlap certain f waves. The hypotheses are reformulated as follows:
H0: x = Hb0+ w
H1: x = Asn1+ Hb1+ w
where H is a matrix of basis functions and b the weights of each function. In this paper, we used polynomials of degrees 0 to 3 as a set of basis functions to estimate T wave shapes, denoted as T = Hb. The parameters b0
and b1were estimated using computational methods
un-der both noise distribution. The bottom half of Table 1 shows the estimators obtained using this model. Q = I − H(HTH)−1HT is the orthogonal projector to the
null space of H.
Standard ECG recordings contain 12 leads. It is natural then to consider using all leads in hopes to obtain a bet-ter detector. The observations of each lead can be grouped into a matrix X = [x1· · · x12]. The PDF of X requires
in-formation on the covariance structure between each lead. In this paper, we consider that the observations are uncor-related amongst the leads and have the same variance. This results in the multilead PDF becoming the product of all single-lead PDFs, which translates into a sum of detector outputs when σ2
wis known and a product of detector
out-puts when σ2wis unknown. This also applies when the T wave is modeled in a multilead setting.
Considering all possible configurations, there were 32 detectors in total (16 single-lead detectors and 16 multilead detectors).
2.6.
Determination of the decision
thresh-old and performance
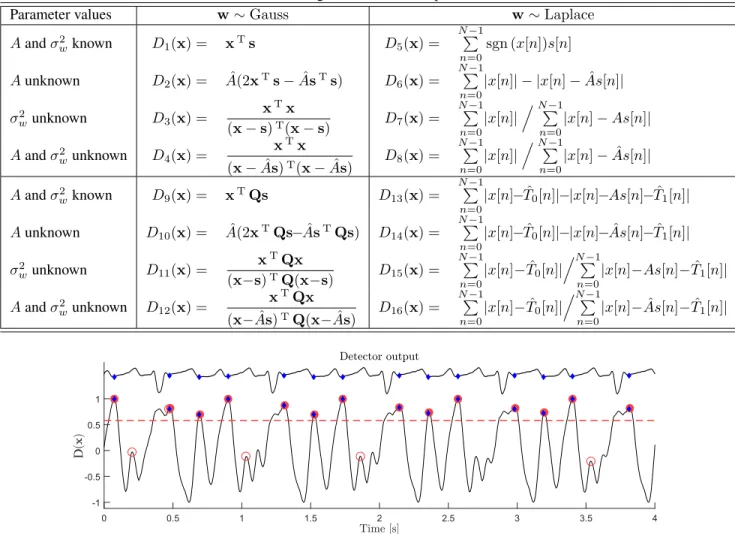
An example of a detector output is shown in (Fig 1). Many peaks may be discerned, indicating a candidate
de-Table 1. Single-lead detector expressions
Parameter values w ∼ Gauss w ∼ Laplace A and σ2 wknown D1(x) = xTs D5(x) = N −1 P n=0 sgn (x[n])s[n] A unknown D2(x) = A(2xˆ Ts − ˆAsTs) D6(x) = N −1 P n=0 |x[n]| − |x[n] − ˆAs[n]| σw2 unknown D3(x) = xTx (x − s)T(x − s) D7(x) = N −1 P n=0 |x[n]|. N −1 P n=0 |x[n] − As[n]| A and σ2 wunknown D4(x) = xTx (x − ˆAs)T(x − ˆAs) D8(x) = N −1 P n=0 |x[n]|. N −1 P n=0 |x[n] − ˆAs[n]| A and σ2wknown D9(x) = xTQs D13(x) = N −1 P n=0 |x[n]− ˆT0[n]|−|x[n]−As[n]− ˆT1[n]| A unknown D10(x) = A(2xˆ TQs− ˆAsTQs) D14(x) = N −1 P n=0 |x[n]− ˆT0[n]|−|x[n]− ˆAs[n]− ˆT1[n]| σ2 wunknown D11(x) = xTQx (x−s)TQ(x−s) D15(x) = N −1 P n=0 |x[n]− ˆT0[n]| .N −1 P n=0 |x[n]−As[n]− ˆT1[n]| A and σ2wunknown D12(x) = xTQx (x− ˆAs)TQ(x− ˆAs) D16(x) = N −1 P n=0 |x[n]− ˆT0[n]| .N −1 P n=0 |x[n]− ˆAs[n]− ˆT1[n]|
Figure 1. Example of a detector output (bottom trace; D5 using a single lead) and its corresponding ECG record (top
trace; lead V1). Red circles indicate detection peaks, with filled ones being true detection. Blue diamonds indicate manual annotations. The dashed line indicates the best threshold selected using the method described in Section 2.6. The true detection and manual annotations can be seen to agree well with each other.
tection. The threshold γ separates true and false detec-tion and is generally determined during the development of the detector expressions. However, false detection peaks are generally lower than true ones, resembling a classifica-tion problem. Machine learning methods can then be used to determine an optimal threshold γoptthat best separates
true and false detection. Furthermore, this threshold can be used with new recordings to perform automatic detec-tion of f waves. In this paper, we used an approach based on leave-one-out (LOO) cross-validation, suitable for the small number of annotations that were available.
The peaks were classed as either true or false detection by comparing the instant of a detector peak to manual an-notations. We used a limit of ±25 ms from a true anno-tation and selection of highest peak as criteria to decide a true detection. The remaining peaks are classed as false
de-tection. Peaks within the duration of QRS complexes were discarded. To standardize the detection output across the whole dataset of recordings, the peaks for each recording were normalized by its largest-valued peak, giving values between 0 and 1. All peaks were grouped together and labeled.
For a fixed threshold γ0, we applied a LOO cross-validation algorithm. First, a test sample ytestof label ltest
is removed from the ensemble, resulting in a reduced train-ing set. We calculate PTrue
above, the probability that the
re-maining labels are true knowing that their associated peak value is above γ0, and likewise for false ones, noted PFalse
above.
The same is also done for samples below the threshold, producing PTruebelowand PFalsebelow.
Validation is then performed by predicting the test la-bel through a comparison of two probabilities (PTrue
PFalse aboveor P
True belowand P
False
below) depending on the location of
ytest with regards to γ0, and deciding the class based on
which one is larger. The predicted label is tested against ltest: if matching, then a counter is incremented. The
algo-rithm then repeats by selecting a different test sample, until all samples have been used. At the end, the counter indi-cates the number of correct predictions made for γ0. After all values of γ have been evaluated, the one for which the count is maximized is taken as γopt.
Once the value of γopt was determined, the detection
performance can be quantified on the set of all peaks of a given detector using standard performance metrics, which are sensitivity Se, specificity Sp, accuracy Acc, all defined as follows:
Se = TD/(TD + FR) Sp = TR/(TR + FD)
Acc = (TD + TR)/(TD + FR + FD + TR) and AUC, which is defined as the area under the curve of Se against Sp.
TD are peaks above the threshold corresponding to f waves, whereas TR are peaks below the threshold not cor-responding to f waves. All three metrics are valued be-tween 0 and 1.
3.
Results and Discussion
The overall performance of the detectors can be quanti-fied by the AUC. Of all 32 detectors, the single-lead ver-sion of D5has the highest AUC value (AUC = 0.89).
Table 2. Best detector performances and threshold D5
AUC 0.89 Se, Sp 0.87 0.76 Acc 0.83 γopt 0.581
The thresholds issued by the algorithm and their corre-sponding values of Se and Sp are shown in Table 2 for detector D5. It is remarkable that several other detectors
have comparable performance to D5, but they have a
ten-dency to output significantly many false detection. In an automatic detection setting for use in a beat-to-beat anal-ysis, it is preferable to have a lower rate of false alarm to avoid detecting false f waves, even if rate of detection has to be traded off. This makes the other detectors a less fa-vorable choice for use in automatic detection, compared to D5. It is thus preferred for use in an automatic detection
setting. In terms of timing, D5has an error of 1.26 ± 9.04
ms from a true annotation.
It is remarkable that the computational methods used for estimating the different parameters of the signal model re-quire massive amount of time ( 13 hours for a single record using multilead detectors with T wave model). This is partly due to the requirement of the detector expression. It is possible to simplify the expression further, or use an-other form of detector that do not require estimation of any parameters [2].
4.
Conclusion
In this paper, we developed several f wave detectors based on the principles of generalized likelihood ratio test. By employing this principle, these detectors are adapted to real-life conditions by accounting for various effects (modulation, T wave overlap, non-Gaussian noise). This is achieved through the use of various signal models and parameterization of the likelihood ratio. The detection threshold–useful for automatic detection of f waves–is learned using an original technique based on leave-one-out cross-validation. The detector of choice shows good performance with a small timing error.
Acknowledgements
We would like to thank the cardiology team at Centre Hospitalier Princesse Grace in Monaco for providing us with the ECG recordings, and Universiti Kuala Lumpur and the French government for their financial support.
References
[1] Kamarul Azman MH, Meste O, Kadir K, Latcu DG. Localiz-ing atrial flutter circuit usLocaliz-ing variability in the vectorcardio-graphic loop parameters , to be published;.
[2] Kay S. Fundamentals of Statistical Signal Processing: De-tection Theory. Prentice Hall Signal Processing Series. Prentice-Hall PTR, 1998.
[3] Kay S. Fundamentals of Statistical Signal Processing: Es-timation Theory. Prentice Hall Signal Processing Series. Prentice-Hall PTR, 1993.
[4] Lawson C, Hanson R. Solving Least Squares Problems. So-ciety for Industrial and Applied Mathematics, 1995. [5] Singleton RR. A method for minimizing the sum of absolute
values of deviations. Ann Math Statist 09 1940;11(3):301– 310.
Address for correspondence: Muhammad Haziq Kamarul Azman Bureau 206
Laboratoire I3S 2000 route des Lucioles 06900 Sophia Antipolis, France [email protected]