HAL Id: hal-01930740
https://hal.inria.fr/hal-01930740
Submitted on 22 Nov 2018
HAL is a multi-disciplinary open access
archive for the deposit and dissemination of
sci-entific research documents, whether they are
pub-lished or not. The documents may come from
teaching and research institutions in France or
abroad, or from public or private research centers.
L’archive ouverte pluridisciplinaire HAL, est
destinée au dépôt et à la diffusion de documents
scientifiques de niveau recherche, publiés ou non,
émanant des établissements d’enseignement et de
recherche français ou étrangers, des laboratoires
publics ou privés.
Intensity-based matching and registration for 3D
correlative microscopy with large discrepancies
Bertha Mayela Toledo Acosta, Xavier Heiligenstein, Grégoire Malandain,
Patrick Bouthemy
To cite this version:
Bertha Mayela Toledo Acosta, Xavier Heiligenstein, Grégoire Malandain, Patrick Bouthemy.
Intensitybased matching and registration for 3D correlative microscopy with large discrepancies. ISBI 2018
-IEEE 15th International Symposium on Biomedical Imaging, Apr 2018, Washington, United States.
pp.493-496, �10.1109/ISBI.2018.8363623�. �hal-01930740�
INTENSITY-BASED MATCHING AND REGISTRATION FOR 3D CORRELATIVE
MICROSCOPY WITH LARGE DISCREPANCIES
Bertha Mayela Toledo Acosta
1, Xavier Heiligenstein
2, Gr´egoire Malandain
3, Patrick Bouthemy
1 1Inria, Centre Rennes - Bretagne Atlantique, France
2
Institut Curie, PSL Research University, CNRS UMR 144 & Cell and Tissue Imaging Facility, France
3Universit´e Cˆote d’Azur, Inria, CNRS, I3S, France
ABSTRACT
Correlative microscopy, especially light and electron microscopy (CLEM), enables the study of cells and subcellular elements in com-plementary ways, provided a reliable registration between images is efficiently achievable. We propose a general automatic registration method. Due to large discrepancies in appearance, field-of-view, resolution and position, a pre-alignment stage is required before any 3D fine registration stage. We define an intensity-based method for both stages, which leverages a common representation of the two involved image modalities. We report experimental results on different real datasets of 3D correlative microscopy, demonstrating time efficiency and overlay accuracy.
Index Terms— 3D microscopy images, 3D CLEM, multimodal patch matching, 3D registration
1. INTRODUCTION
In recent years, correlative microscopy has become an important and powerful tool in the bioimaging field. It combines two (or more) mi-croscopy modalities, allowing the study of biological specimens in complementary ways and at different resolutions. Since current tools used by biologists require manual intervention, one key challenge in this area is to make the image overlay between modalities as auto-matic as possible for an easier and more efficient workflow. It will also favour dissemination of correlative microscopy and enable han-dling of large amount of images. This is particularly crucial for 3D acquisition. Our goal is precisely to propose an automated registra-tion method for 3D correlative microscopy.
3D multimodal image registration has a long story in medical imaging [1]. Briefly speaking, there are two main approaches for registration [2]. The first one is the geometric approach which first extracts specific points in each image, pairs (or matches) them, and computes the 3D registration transformation from the matched pairs of points. It can handle large transformations. The second approach is the intensity-based one, which iteratively computes the 3D trans-formation by minimizing a similarity criterion for instance based on mutual information. It implicitly assumes that an initial positioning is given, not too far from the optimal solution. However, 3D correla-tive microscopy raises specific issues, which makes both approaches not straightforwardly applicable for an automatic workflow as ex-plained just below.
The most frequent combination of correlative microscopy is between light microscopy (LM) and electron microscopy (EM),
This work has been partly supported by the National Council of Science and Technology of Mexico (CONACYT) under the Grant no. 246372/384571.
referred to as correlative light and electron microscopy (CLEM). Fluorescence LM allows identification and tracking of labeled biomolecules, and provides information on their dynamics and interactions. However, the diffraction limits the resolution, and flu-orescence LM cannot visualize unlabeled cellular structures. EM displays much higher resolution, and it can delineate cellular ul-trastructure but at the cost of fixing the sample. Since there are several types of LM and EM modalities, any combination results in a specific CLEM method, also dependent on the biological problems under study. Other imaging techniques may accompany CLEM, such as microCT, or X-rays [3, 4, 5].
The technological and technical differences between EM and LM images are in many aspects: field of view, pixel resolution, im-age size, content, appearance, raising important and specific chal-lenges for automated registration in 3D correlative microscopy. Fur-thermore, large gaps occur between the initial locations and orienta-tions of the objects of interest in the respective LM and EM stacks in the data acquisition workflow. Then, geometrical and appearance discrepancies between LM and EM stacks hamper a direct computa-tion of the 3D transformacomputa-tion mapping one image stack to the other. The geometric registration approach is the one usually adopted in the semi-automatic 3D correlative microscopy workflow, but the selection and pairing of corresponding points are typically manually performed. In contrast, existing automatic segmentation methods cannot deliver repeatable point extraction in all LM and EM images. Indeed, these methods may not extract a sufficient amount of reliable point pairs in the two image modalities, in particular due to the lack of structure and texture in fluorescence images. The intensity-based approach for direct 3D registration computation is usually employed in medical imaging, since it can benefit from close initialisation and isotropic volumes. This does not stand for correlative microscopy which then requires a pre-alignment stage [6].
The paper is organized as follows. In Section 2, we briefly sur-vey related work in CLEM. Section 3 introduces the datasets and the corresponding image properties. In Section 4, we present the two stages of our method. Section 5 reports experimental results, and provides a comparison with manual interaction using eC-CLEM[15]. Section 6 contains concluding remarks.
2. RELATED WORK IN CLEM
In current CLEM setups, registration is performed by a first global pre-alignment followed by a refined alignment, and usually involved an important user interaction. The manual pre-alignment or match-ing of the EM and LM stacks is commonly performed by biologists, either during the acquisition step and/or during the post-acquisition registration step. During acquisition, the pre-alignment relies on
vi-sually identifying predefined marks on the sample holder, or exploit-ing fiducial markers introduced in the sample [7, 8]. Likewise, dur-ing the registration stage, the biologist has to select pairs of points in the two images, whatever they are (fiducial markers, distinctive features on the sample) [9, 10]. The landmark pairs are then ex-ploited to compute the 3D geometric transformation between EM and LM stacks [11, 12, 13]. The matching step is a demanding and tedious task, especially if a large amount of data must be processed [14]. Such semi-automatic framework is adopted in [4] for register-ing 3D microCT and LM images, in the recently released eC-CLEM software for 3D correlative microscopy [15], or in [16] to overlay Scanning EM (SEM) and confocal LM volumes.
In above works, the refined registration is addressed by pairing corresponding points, and the user has to iteratively re-apply this procedure (picking points, computing the transformation) until he or she found the computed transformation satisfactory. A few works propose an automated refined registration (the pre-alignment being still manual). In [16], the cell membrane is segmented in the SEM stack and modified to a resolution similar to LM one. Then, EM and LM volumes are registered with an affine transformation and nor-malized correlation. [17] proposes an automated refined registration based on mutual information and rigid transformation. In [15], an extension to an automatic registration was also proposed, provided spots can be correctly detected in both images, but it was only tested on 2D real CLEM.
Our contribution is to propose automated procedures for both the pre- and the refined alignment for 3D correlative microscopy. Our method is intensity-based for both stages, and leverages a common representation of EM and LM images.
3. 3D CLEM FRAMEWORK
To motivate our contribution, we first present the two 3D correl-ative microscopy sets we will deal with, and we give information on the acquired images. The first set is composed of a serial block face SBFSEM image stack and a confocal image stack. HeLa cells were imaged for LM in a 710 LSM Zeiss inverted confocal mi-croscope; afterwards, they were fixed, stained and embedded for SBF-SEM imaging and acquired using a Sigma VP scanning elec-tron microscope (Carl Zeiss). The LM stacks has two channels: transmitted light and one fluorescent channel, with volume size of 1024 × 1024 × 16 and pixel size of 0.22µm in X and Y , and 0.6µm in Z, knowing that the XY -space corresponds to the lateral dimen-sions of the stack and the Z-axis to the vertical dimension of the stack. The size of the EM stack is 666 × 903 × 247 and its pixel size is 0.14µm in X and Y , and 50nm in Z, which is rather low-magnification EM. A 3D rendering is displayed in Fig.1.
(a) Fluorescence LM stack (b) EM stack
Fig. 1. Exp. 1: 3D CLEM
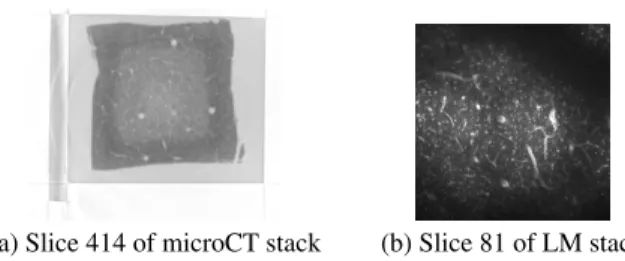
The second set, shown in Fig.2, includes a stack of microCT and a two-photon fluorescence microscopy stack. The microCT stack of
(a) Slice 414 of microCT stack (b) Slice 81 of LM stack Fig. 2. Exp. 2: 3D microCT and Fluorescence LM size 1084 × 896 × 1094 has pixel size of 1µm in X and Y and 1µm in Z, while the FM stack of size 1024 × 1024 × 107 has pixel size of 0.59µm in X, 0.59µm in Y and 3.0µm in Z.
In both datasets, the 3D stacks are anisotropic and have signif-icant differences in terms of volume size, pixel resolution, content, appearance, and location of structures of interest between modali-ties. Nevertheless, in these examples, it turns out that the discrep-ancy between the two volumes in terms of shift along the Z-axis and of rotation in the XY plane are not that significant, but other discrepancies remain.
4. OUR AUTOMATED OVERLAY METHOD 4.1. Intensity-based XY pre-alignment
To address the large gap between the initial positions of EM and LM stacks, we have defined an intensity-based prealignment method. We restrict to the shift in the XY -space, since it is the larger component of misalignment (which is often the case by the way). It is tractable for an automatic pre-alignment at that stage. To compute this ini-tial XY shift, we accordingly reduce the dataset to two dimensions. Projection along the Z-axis of the LM stack, using the maximum intensity projection (MIP), yields a good distribution of the volume content. If the LM stack is of size m × n × l, LM-MIP is a 2D m × n image obtained by scanning LM intensities along the Z-axis and selecting the highest one for each (x, y) location of the image grid. The same cannot be applied to the EM stack, since the resulting MIP image will be saturated. Then, we simply select a few slices in the EM stack. CLEM overlay may be performed in both ways, EM to LM, or LM to EM. The overlay is focused on a region of interest (ROI) of the biological sample, which may involve a specific cell or a subcellular structure in a cell, and is specific to each biological project. The ROI is expected to be delineated either by the biolo-gist (which will be in that case the only user interaction), or by an algorithm able to detect the content of interest.
Here we start with the EM stack. Given a 3D ROI delineated in the EM stack, we take the corresponding 2D ROIs in the selected EM slices, and we search for their corresponding ROI in the LM-MPI image. The patch dimensions in the LM-MPI image are inferred from the EM-ROI ones, while taking into account the ratio between pixel resolutions available in the metadata attached to the acquisi-tion. To facilitate the search, we require a comparable appearance for the two images. To do so, we leverage the Laplacian of Gaussian (LoG) transform we introduced in [18] for 2D CLEM registration. The LoG transform maps a 2D EM image and a 2D LM image to closer representation, decreasing the big difference in appearance between the images as illustrated in Fig.4. The LoG transform en-hances high spatial frequencies while suppressing local linear inten-sity variations. The LoG transform of an image I is expressed as:
Lσ(I) = ∆(Gσ∗ I), (1)
where the Gaussian standard deviation σ acts as an adaptable scale linked to the size of the objects of interest in I. It is automatically
selected by using the method described in [19] which exploits the Lindeberg’s scale-space approach. We select the scale with the max-imum number of blobs, which are local minima in the constructed scale-space domain. By adapting the LoG scale to the EM and LM image content, we lessen the difference in content scale of LM and EM images.
Once a common representation of EM and LM images is cre-ated, we have to match the 2D LoG-EM-ROI with its corresponding ROI in the 2D LM-MIP image. We handle several 2D LoG-EM-ROIs, one by EM slice, to ensure robustness by making the matching not dependent on one particular 2D EM slice. Then, a 2D patch-based exhaustive search is carried out over the LoG-LM-MIP. Due to the differences in orientation between the LM and EM images, it is necessary to adopt a similarity measure that is invariant to rotation and scaling. Therefore, we take histogram-based descrip-tors for the matching process. We have used two types of histograms: the LoG-values histogram and the Local Directional Pattern (LDP) [20]. We have also implemented two histogram distances as simi-larity measures: the cosine simisimi-larity and the histogram intersection distance to evaluate the similarity of the LoG-EM-ROI with each tested LoG-MIP-LM patch.
If we use n EM slices taken from the EM stack, we have n can-didate patches for the ROI location in the 2D LM-MIP image as illustrated in Fig.3. The final ROI center location in the LM-MIP image is selected using a robust criterion since outliers may occur, i.e., wrong matching. It is given by the weighted average of the center positions of the inlier patch candidates. The weights are de-fined as an inverse of the distance between the center of the patch and the median of the centers positions of all candidate patches. Be-forehand, outliers are discarded according to the median absolute deviation of their center position to the median of the centers of all selected patches. The difference between the center location of the
Fig. 3. ROIs extracted from multiple LoG-EM slices to be located in the LoG-LM-MIP image
selected ROI in the LoG-LM-MIP image and the center of any 2D EM-ROI (since the 2D EM-ROIs are vertically aligned in the 3D EM-ROI stack) yields the 2D shift in the XY -space. Then, the full LM stack is shifted by applying the estimated 2D translation.
To summarize, our pre-alignment method comprises four main steps: 1) Maximum intensity projection of the LM stack to a 2D image; 2) LoG representation of 2D-LM-MPI image and 2D EM slices; 3) Matching of the ROI of every LoG-EM slice in LoG-LM-MIP image; 4) Pre-alignment of EM and LM stacks by a XY -shift. 4.2. 3D ROI-based affine registration
Once the pre-alignment is achieved, we can estimate the 3D transfor-mation which will allow to overlay the 3D LM stack onto the 3D EM stack. The 3D transformation is computed between the 3D EM-ROI and the pre-aligned 3D LM-EM-ROI. The transformed LoG-LM stack is resampled to fit the same size in the Z-dimension as the LoG-EM stack using a bilinear interpolator after applying a low-pass filter. The 3D LoG-LM-ROI is recovered using the same coordinates of the 3D LoG-EM-ROI.
The LoG images are still different enough so that an intensity-difference similarity measure cannot provide satisfactory results. We
resort to mutual information (MI) as a similarity measure, due to its well-known capability of handling multimodal images. First, a 3D rigid transformation (composed of a rotation and a translation is estimated. However, given the 3D CLEM workflow, it is not suffi-cient to account for the geometric relationship between the LM and EM stacks. The EM slices do not lie in the same plane as the LM slices, and distortions between stacks may occur during the acquisi-tion. Consequently, we refine the registration with a 3D affine trans-form.
Our overall method does not involve any extraction of image features from the EM and LM stacks. It is merely intensity-based, which prevents from any possible segmentation errors and saves computation time. Furthermore, it does not require any parameter setting by the user. We use ITK libraries in C++ for the MI-based registration.
5. EXPERIMENTAL RESULTS
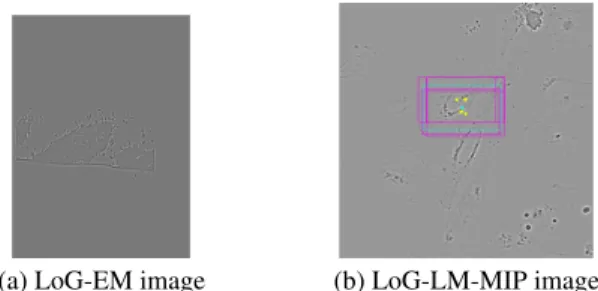
Experiment 1: EM and LM.To pre-align the EM and LM stacks, we follow the 2D matching process described in Section 4.1. A 2D projection of the LM stack is generated using MIP. EM slices 107-118 were selected to extract a 2D ROI, whose LoG representation (Fig.4a) is matched within the LoG-LM-MIP image. Using [19], we obtain an approximate scale for the LoG transform of EM and LM, respectively estimated as σEM = 4.3 and σLM= 2.5.
A corresponding patch in the LoG-LM-MIP is found for each
(a) LoG-EM image (b) LoG-LM-MIP image
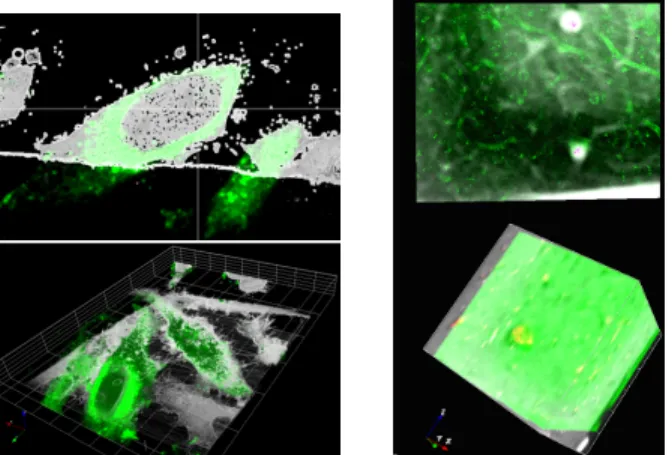
Fig. 4. Exp. 1: a) slice 107 of LoG-EM stack, b) LoG-LM-MIP im-age with patch candidates overprinted in mim-agenta and the selected one in light bue (to be better visualized by zooming in the pdf file) LoG-EM-ROI by the patch-based search, with a 90% overlap be-tween tested patches, using both cosine and histogram intersection distances. Then, we robustly compute the selected patch from the weighted average of all their centers (Fig.4b). The final overlay of the registered EM and LM ROIs is shown in Figure 5. The accuracy can be appreciated by observing the fluorescence (in green) correctly surrounding the cell nucleus in the EM slice. The computed 3D rigid registration corresponds to a 3D translation of (−1.21, −0.5, 7.17), and a rotation of angles −7.52◦, −2.63◦and −1.46◦around the X, Y and Z axis respectively. By picking corresponding points in LM and EM stacks, we evaluated an average registration error of 6.5 pix-els, moderately less accurate than with manual eC-CLEM.
To compute this registration, it takes 1.54 minutes for the pre-alignment and 13.5 seconds for the 3D registration. Comparatively, manual correlation by a trained biologist on a known dataset using eC-CLEM took 20 minutes, most time being dedicated to pri-mary orientation. Once the initial rotation, translation and scaling achieved (the first four points required in eC-CLEM), the fine corre-lation can be estimated to 5 minutes per points-pair. On an unknown dataset, initial correlation can take more than one hour.
Experiment 2: MicroCT and LM.In this experiment, slices 15-25 are extracted from the microCT stack, and a 2D ROI is extracted from each of their LoG representations. Then, a MIP of the LM stack is computed. The estimated LoG scales are σµCT = 22.2 and
σLM = 2.1. The full LM stack is pre-aligned by applying the shift
given by the first stage. Then, we compute the 3D affine transforma-tion. Computation time is 3.9 minutes for the pre-alignment stage and 15.4 seconds for the 3D registration. Visual evaluation of the overlay is given in Fig. 5. It is normal that most of the elongated shapes are not overlaid, since they are present in only one of the two modalities.
Fig. 5. 3D overlay for experiments 1 (left) and 2 (right). The fluores-cence LM is overprinted in green. Top: Overlay visualized for one given slice. Bottom: Overlay visualized on the full 3D stack.
6. CONCLUSION
We have defined an original and efficient intensity-based method for automatically overlaying 3D image stacks of different modalities in correlative microscopy (CM). Our method can cope with large appearance, resolution and position discrepancies. It proceeds in two stages: pre-alignment and 3D fine registration. It does not in-volve any parameter setting, and then, is straightforward to use by biologists. Results on different combinations of 3D correlative mi-croscopy show its genericity. Registration accuracy is satisfying for a fully automatic overlay of the two 3D image stacks. Future work will deal with still more general handling of the pre-alignment (fully 3D shift) and possibly non-rigid 3D registration, while continuing to validate the proposed method on other types of 3D CM datasets.
7. REFERENCES
[1] J.B. Maintz and M.A. Viergever “A survey of medical image registra-tion,” Medical Image Analysis 2:1-36, 1998.
[2] B. Zitov´a and J. Flusser, “Image registration methods: a survey,” Im-age and Vision Computing, 21(11):977–1000, 2003.
[3] L. Schaad, R. Hlushchuk, S. Barr´e, R. Gianni-Barrera, D. Haberth¨ur, A. Banfi, and V. Djonov, “Correlative imaging of the murine hind limb vasculature and muscle tissue by MicroCT and light microscopy,” Scientific Reports7:41842+, 2017.
[4] S. Handschuh, N. Baeumler, T. Schwaha, and B. Ruthensteiner, “A correlative approach for combining microCT, light and transmission electron microscopy in a single 3D scenario,” Frontiers in Zoology, 10(1):44, 2013.
[5] M. A. Karreman, B. Ruthensteiner, L. Mercier, N. L. Schieber, G. Solecki, F. Winkler, J. G. Goetz, and Y. Schwab, “Chapter 13
-find your way with X-Ray: Using microCT to correlate in vivo imag-ing with 3D electron microscopy,” in Correlative Light and Electron Microscopy III, Methods in Cell Biology, 140:277-301. 2017. [6] B. G. Kopek, M. G. Paez-Segala, G.Shtengel, Kem A. Sochacki,
M. G. Sun, Y. Wang, C. S. Xu, S. B. van Engelenburg, J. W. Taraska, L. L. Looger, and H. F. Hess, “Diverse protocols for correlative super-resolution fluorescence imaging and electron microscopy of chemi-cally fixed samples,” Nature Protocols 12(5):916-946, May 2017. [7] C. J. Peddie, K. Blight, E. Wilson, C. Melia, J. Marrison, R. Carzaniga,
M.C. Domart, P. OToole, B. Larijani, and L. M. Collinson, “Correla-tive and integrated light and electron microscopy of in-resin GFP flu-orescence, used to localise diacylglycerol in mammalian cells,” Ultra-microscopy, 143:3-14, 2014.
[8] J. Franks, C. T. Wallace, M. Shibata, M. Suga, N. Erdman, D. B. Stolz, and S. C. Watkins, Correlative Fluorescence and Electron Microscopy in 3D—Scanning Electron Microscope Perspective, Curr. Protoc. Cy-tom.80:12, 2017.
[9] M. S. Beckwith, K. S. Beckwith, P. Sikorski, N. T. Skogaker, T. H. Flo, and Ø. Halaas, “Seeing a Mycobacterium-Infected cell in nanoscale 3D: Correlative imaging by light microscopy and FIB/SEM tomogra-phy,” PLOS ONE, 10(9):1-19, 2015.
[10] K. Cortese, G. Vicidomini, M. C. Gagliani, P. Boccacci, A. Diaspro, and C. Tacchetti, “Chapter 6 - 3D HDO-CLEM: Cellular compartment analysis by correlative Light-Electron microscopy on cryosection,” in Correlative Light and Electron MIcroscopy, Methods in Cell Biology, 111:95-115. 2012.
[11] Y. Fukuda, N. Schrod, M. Schaffer, L. R. Feng, W. Baumeister, and V. Lucic, “Coordinate transformation based cryo-correlative meth-ods for electron tomography and focused ion beam milling,” Ultra-microscopy, 143(C)15-23, 2014.
[12] M. R. G. Russell, T. R. Lerner, J. J. Burden, D. O. Nkwe, A. Pelchen-Matthews, M.C. Domart, J. Durgan, A. Weston, M. L. Jones, C. J. Ped-die, R. Carzaniga, O. Florey, M. Marsh, M. G. Gutierrez, and L. M. Collinson, “3D correlative light and electron microscopy of cultured cells using serial blockface scanning electron microscopy,” Journal of Cell Science, 130(1):278-291, 2017.
[13] D. Boh´orquez, F. Haque, S. Medicetty, and R. A. Liddle, “Correla-tive confocal and 3D electron microscopy of a specific sensory cell.,” Journal of Visualized Experiments, no. 101, 2015.
[14] B. Maco, A. Holtmaat, A. Jorstad, P. Fua, and G. W. Knott, “Chapter 16 - correlative in vivo 2-Photon imaging and focused ion beam scan-ning electron microscopy: 3D analysis of neuronal ultrastructure,” in Correlative Light and Electron Microscopy II, Methods in Cell Biol-ogy, 124:339-361, 2014.
[15] P. Paul-Gilloteaux, X. Heiligenstein, M. Belle, M.C. Domart, B. Lar-ijani, L. Collinson, G. Raposo, and J. Salamero, “eC-CLEM: flexible multidimensional registration software for correlative microscopies,” Nature Methods14(2):102-103, 2017.
[16] G. E. Murphy, K. Narayan, B. C. Lowekamp, L. M. Hartnell, J.A. W. Heymann, J. Fu, and S. Subramaniam, “Correlative 3D imag-ing of whole mammalian cells with light and electron microscopy,” J. of Structural Biology, 176(3):268-278, 2011.
[17] C. S. L´opez, C. Bouchet-Marquis, C. P.Arthur, J. L.Riesterer, G. Heiss, G. Thibault, L. Pullan, S. Kwon, and J. W. Gray, “Chapter 8 - a fully integrated, three-dimensional fluorescence to electron microscopy cor-relative workflow,” in Corcor-relative Light and Electron Microscopy III, vol. 140 of Methods in Cell Biology, 149-164, Academic Press, 2017. [18] B. M. Toledo-Acosta, P. Bouthemy, and C. Kervrann, “A common image representation and a patch-based search for correlative light-electron-microscopy (CLEM) registration,” in ISBI 2016.
[19] A. Basset, J. Boulanger, J. Salamero, P. Bouthemy, and C. Kervrann, “Adaptive spot detection with optimal scale selection in fluores-cence microscopy images,” IEEE Transactions on Image Processing, 24(11):4512-4527, 2015.
[20] T. Jabid, M. H. Kabir, and O. Chae. “Facial expression recognition using Local Directional Pattern (LDP),” in ICIP 2010.