MacroH2A1.1 regulates mitochondrial respiration by limiting
nuclear NAD
+consumption
Melanija Posavec Marjanović#1,13,14, Sarah Hurtado-Bagès#2,13, Maximilian Lassi3,4,
Vanesa Valero2, Roberto Malinverni2, Hélène Delage5, Miriam Navarro6,7, David Corujo2, Iva
Guberovic2, Julien Douet2, Pau Gama-Perez8, Pablo M. Garcia-Roves8, Ivan Ahel9, Andreas
G. Ladurner10, Oscar Yanes6,7, Philippe Bouvet5,11, Mònica Suelves1, Raffaele
Teperino3,4,12,#, J. Andrew Pospisilik12, and Marcus Buschbeck1,2,#
1Programme of Predictive and Personalized Medicine of Cancer, Germans Trias i Pujol Research Institute (PMPPC-IGTP), Badalona, Spain
2Josep Carreras Leukaemia Research Institute (IJC), Campus ICO-Germans Trias I Pujol, Universitat Autònoma de Barcelona, Badalona, Spain
3Institute of Experimental Genetics, Helmholtz Zentrum München, German Research Center for Environmental Health (GmbH), Neuherberg, Germany
4German Center for Diabetes Research (DZD), 85764 Neuherberg, Germany
5Université de Lyon, Centre de Recherche en Cancérologie de Lyon, Cancer Cell Plasticity Department, UMR INSERM 1052 CNRS 5286, Centre Léon Bérard, Lyon, France
6Metabolomics Platform, Department of Electronic Engineering (DEEEA), Universitat Rovira i Virgili, Tarragona, Spain
7Biomedical Research Centre in Diabetes and Associated Metabolic Disorders (CIBERDEM), Madrid, Spain
8Department of Physiological Sciences II, Faculty of Medicine - University of Barcelona, Spain 9Sir William Dunn School of Pathology, University of Oxford, Oxford, UK
10Biomedical Center Munich (BMC) - Physiological Chemistry, Center for Integrated Protein Science Munich, Munich Cluster for Systems Neurology, Faculty of Medicine, LMU Munich, Planegg-Martinsried, Germany
Users may view, print, copy, and download text and data-mine the content in such documents, for the purposes of academic research, subject always to the full Conditions of use:http://www.nature.com/authors/editorial_policies/license.html#terms
#Corresponding authors. [email protected]; [email protected]. 14Present address: Institute Ruđer Bošković, Zagreb, Croatia
Author Contributions
Concept, M.P.M., R.T. and M.B.; Methodology, O.Y.;
Performed experiments, M.P.M., S.H.-B., M.L., V.V., H.D., M.N., D.C., I.G., J.D., P.G.; High content data analysis, R.M.;
Writing of the manuscript, M.P.M., J.A.P., R.T., and M.B.;
Experimental design and data interpretation, M.P.M., S.H.-B., M.S., P.B., I.A., A.G.L.; P.M.G.-R., O.Y., J.A.P., R.T. and M.B.
Declaration
Author Manuscript
Nat Struct Mol Biol. Author manuscript; available in PMC 2018 April 09.
Published in final edited form as:
Nat Struct Mol Biol. 2017 November ; 24(11): 902–910. doi:10.1038/nsmb.3481.
Europe PMC Funders Author Manuscripts
11Université de Lyon, Ecole Normale Supérieure de Lyon, Lyon, France 12Max Planck Institute of Immunobiology and Epigenetics, Freiburg, Germany
13PhD Program in Biomedicine, Department of Experimental and Health Sciences, Universitat Pompeu Fabra (UPF), Barcelona, Spain
# These authors contributed equally to this work.
Abstract
Histone variants are structural components of eukaryotic chromatin that can replace replication-coupled histones in the nucleosome. The histone variant macroH2A.1.1 contains a macrodomain able to bind NAD+ derived metabolites. Here, we report that macroH2A.1.1 is rapidly induced during myogenic differentiation through a switch in alternative splicing. Importantly, myotubes lacking macroH2A.1.1 display a defect in mitochondrial respiratory capacity. We find that the metabolite-interacting macrodomain is essential for sustaining optimal mitochondrial function, but dispensable for gene regulation. Through direct binding, macroH2A.1.1 inhibits basal poly-ADP ribose polymerase 1 activity and thus reduces nuclear NAD+ consumption. Consequentially, accumulation of the NAD+ precursor NMN allows the maintenance of mitochondrial NAD+ pools critical for respiration.
Our data indicate that macroH2A.1.1-containing chromatin regulates mitochondrial respiration by limiting nuclear NAD+ consumption and establishing a buffer of NAD+ precursors in
differentiated cells.
Introduction
NAD+ and its reduced and phosphorylated forms have central roles in cellular metabolism1. As donor and acceptor molecules for redox reactions they are essential for glycolysis and mitochondrial respiration2. In addition to redox metabolism, a number of enzymes consume NAD+ by breaking the energetic bond between its nicotinamide (NAM) and ADP ribose moiety. These enzymes include ADP ribose transferases, poly-ADP ribose (PAR) polymerases (PARPs), cADP ribose synthases and sirtuins1.
Of these enzymes PARP-1 is known to be the major NAD+ consuming enzyme in the cell3. PARP-1 is an abundant nuclear protein that functions in the cellular stress response. Best studied in the response to acute DNA damage, additional non-stress related functions, such as transcriptional regulation, have also been described4. Activated PARPs transfer ADP ribose to protein substrates and are able to generate elongated and branched PAR polymers5. Through their negative charge and capacity to recruit effector proteins PAR polymers are able to locally affect chromatin structure and function. Through the consumption of NAD+, PARP-1 is further linked to other NAD+-dependent reactions and energy metabolism6. MacroH2A proteins are structural chromatin components that contribute to chromatin architecture7. As histone variants, they can replace the replication-coupled H2A histone in the structural unit of chromatin, the nucleosome. Among histone variants, macroH2A proteins are unique in having a tripartite structure consisting of a N-terminal histone fold, an
Europe PMC Funders Author Manuscripts
unstructured linker domain connecting a C-terminal macrodomain8. Macrodomains are ancient and globular folds that contain a binding pocket able to recognize NAD+ derived ADP ribose9. In evolution, macroH2A-encoding genes appeared at the transition to multicellular life10. In mammals, two genes and one mutually exclusive splicing event give rise to three macroH2A proteins – macroH2A1.1, macroH2A1.2 and macroH2A28. These three macroH2A proteins differ in the size and hydrophobicity of the binding pocket of their macrodomain. When a macroH2A protein is incorporated into chromatin, its unstructured linker domain places the macrodomain at an accessible site outside of the nucleosome11. Affinity for ADP ribose is limited to the splice variant macroH2A1.112. By binding ADP ribose in a capping mode, the macrodomain of macroH2A1.1 is further able to interact with PAR chains both when free or covalently linked to a protein13. The binding of
macroH2A1.1 to auto-modified PARPs has been shown for several members of the PARP family including PARP-1/ARTD113,14, PARP-5/Tankyrase-1/ARTD515 and PARP-10/ ARTD1016,17.
Loss-of-function studies have demonstrated that macroH2A proteins contribute to the robust embryonic development in zebrafish18, are tumor suppressors in cancers such as
melanoma19 and act as barriers to somatic cell reprogramming20. Mice lacking macroH2A-encoding genes develop normally but display metabolic phenotypes, though controversy exists as to their role in metabolic fitness21–24. The first two studies reported glucose intolerance and female-specific liver steatosis21,22. However, when fed a high-fat diet, macroH2A1 knock-out mice were leaner due to higher energy expenditure and reduced fat mass23. To date, it remains entirely unclear whether the macrodomain and its ADP ribose binding capacity would be relevant for any of these phenotypes. Here, we have used a myogenic cell culture model to understand the role of macroH2A1.1 and its ADP ribose binding capacity on cellular metabolism.
Results
MacroH2A1 splicing switches during myogenesis
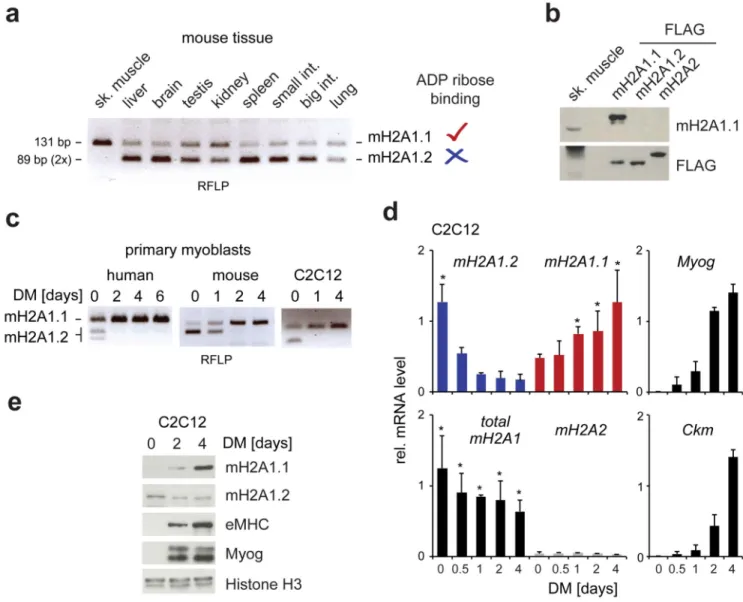
In order to identify the most suitable tissue and cell type to address the function of macroH2A1.1 and its metabolite binding capacity, we used restriction fragment length polymorphism to analyze the relative abundance of both alternatively spliced macroH2A1 mRNAs in a panel of mouse tissues (Fig. 1a and Supplementary Fig. S1a,b). We detected the highest relative levels of macroH2A1.1 in skeletal muscle (Fig. 1a). When using an isoform-specific antibody for immunoblotting25, macroH2A1.1 protein was readily detected in skeletal muscle (Fig. 1b). Next, we turned to cell culture of primary myoblast and immortal myogenic C2C12 cells. While both alternatively spliced mRNAs were detected in
proliferating myoblasts, during myogenic differentiation the mRNA encoding macroH2A1.1 rapidly became predominant (Fig. 1c,d and Supplementary Fig. S1c,d). On the protein level, macroH2A1.1 increased with differentiation in C2C12 cells as macroH2A1.2 decreased (Fig. 1e). Interestingly, the up regulation of macroH2A1.1 was much more pronounced on protein than RNA level (compare Fig.1d and e and Supplementary Fig. S1c and e). Comparison of macroH2A1.1 and macroH2A1.2 immunoblot signals in differentiated C2C12 cells to reference samples indicated that both protein isoforms were present at
Europe PMC Funders Author Manuscripts
comparable levels while macroH2A2 was much less abundant (Supplementary Fig. S1f). Not surprising for a chromatin component, we found that macroH2A1.1 is nuclear in muscle tissue and differentiating C2C12 cells (Supplementary Fig. S2a,b). To check that
macroH2A1.1 is incorporated into chromatin, we confirmed its presence in the chromatin fraction after cellular fractionation (Supplementary Fig. S2c) and its genome-wide distribution in differentiated C2C12 cells by ChIP-seq (Supplementary Fig. S2d-f).
Taken together these results suggest that, compared to proliferating myoblasts, differentiated muscle nuclei are characterized by a chromatin state containing increased levels of
macroH2A1.1, a histone variant isoform with the capacity to bind ADP ribose12. A switch in the alternative splicing of the macroH2A1 transcript provides a rapid way to establish this chromatin state during muscle differentiation.
Depletion of macroH2A1.1 induces metabolic changes but does not affect differentiation
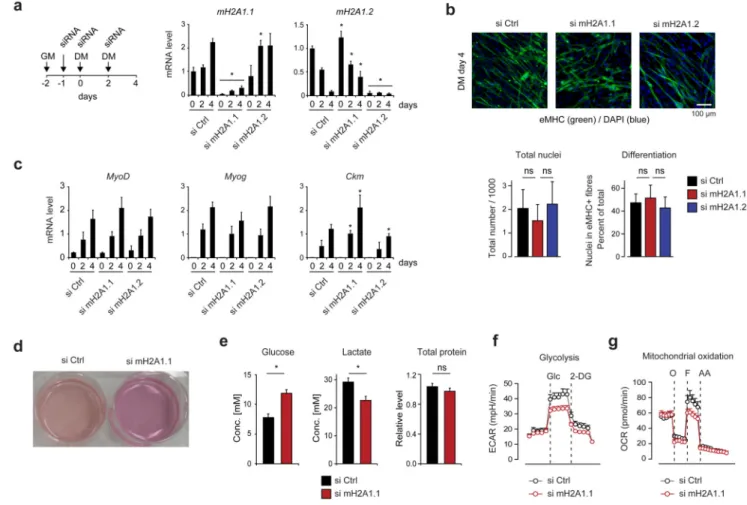
Next, we decided to study the loss of function phenotype of macroH2A1.1 during myogenic differentiation of C2C12 cells. To specifically and efficiently suppress the expression of macroH2A1.1 and macroH2A1.2, we transfected proliferating C2C12 cells with isoform-specific siRNAs and induced differentiation the day after transfection (see scheme in Fig. 2a). Importantly, during 4 days of differentiation macroH2A1.1 and macroH2A1.2-depleted myoblasts were equally efficient as si control-treated cells to differentiate into
multinucleated myotubes (Fig. 2b). While we did not observe any influence on the differentiation-induced upregulation of the key myogenic transcription factors MyoD and Myogenin, the expression of the late differentiation gene muscle-specific creatine kinase (Ckm) at day 4 of differentiation was slightly increased after knockdown of macroH2A1.1 and reduced by knockdown of macroH2A1.2 (Fig. 2c). Together these results show that in contrast to the reported inhibition of myogenic differentiation by the stable suppression of total macroH2A126, the knockdown of individual macroH2A1 isoforms has only a minor influence on differentiation.
In order to understand the physiological relevance of macroH2A1.1 expression and its ADP ribose binding capacity in myotubes, we decided to focus our study on differentiated cells harvested at day 4 of differentiation. Intriguingly, knockdown of macroH2A1.1 led to reduced acidification of cell culture media (Fig. 2d). Analyzing the medium, we found that both glucose consumption and lactate production were reduced (Fig. 2e), indicating a global reduction of cellular metabolism in macroH2A1.1-depleted myotubes. To further explore this phenomenon, we measured rates of extracellular acidification and oxygen consumption as indirect read outs for glycolysis and oxidative phosphorylation. In keeping with reduced metabolic rates in macroH2A1.1-depleted myotubes, we found that these cells showed significantly reduced maximal glycolytic and mitochondrial capacities (Fig. 2f,g). Taken together these results suggest that specific reduction of macroH2A1.1 in the nucleus provokes a change in cellular metabolism that cannot be explained by a delay in differentiation.
Europe PMC Funders Author Manuscripts
MacroH2A1.1 is required for optimal mitochondrial capacity
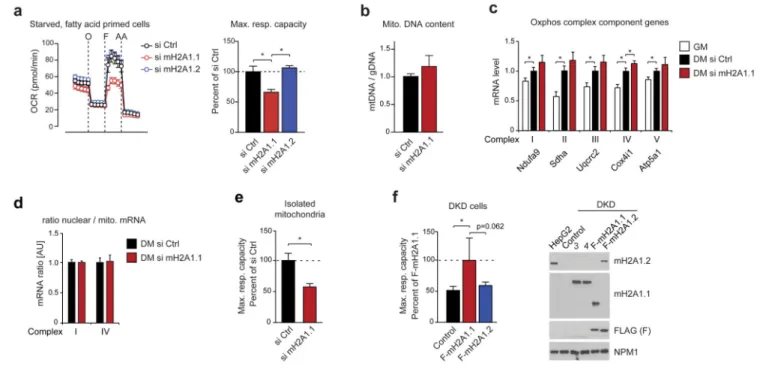
To characterize the nature of the alteration in mitochondrial metabolism, we decided to analyze the oxygen consumption rate in starved cells primed with fatty acids. As fatty acids represent direct mitochondrial substrates this allowed us to largely avoid confounding influences from cytosolic metabolic pathways. Under these conditions, macroH2A1.1 but not macroH2A1.2-depleted myotubes showed significantly impaired basal and maximal mitochondrial activity (Fig. 3a). The amount of mitochondrial DNA was not reduced by knockdown of macroH2A1.1 but rather showed a tendency to be increased (Fig. 3b). The expression of genes encoding components of the five complexes of the respiratory chain were induced during myogenic differentiation and in the case of the Cox4i1 gene slightly increased in macroH2A1.1-depleted myotubes (Fig. 3c). Further, we did not observe any changes in the ratio of nuclear and mitochondrially encoded respiratory chain transcripts (Fig. 3d), a finding that argued against any mito-nuclear protein imbalance as a possible cause of the defect27. Next, we tested whether the observed metabolic phenotype is mitochondria intrinsic or whether it may be caused by the cellular uptake of fatty acids. For this we have repeated the analysis of oxygen consumption rate after isolation of
mitochondria from macroH2A1.1 depleted cells and found the results recapitulated; knockdown of macroH2A1.1 strongly reduced maximal mitochondrial capacity (Fig. 3e). Finally, we performed a gain-of-function experiment with immortal HepG2 cells expressing comparable amounts of macroH2A1.1 and macroH2A1.2 (Fig. 3f). To avoid any
confounding influence of endogenous macroH2A isoform expression we have used previously described cells that were efficiently depleted for all macroH2A isoforms7. As shown in Fig. 3f, macroH2A1.1 but not macroH2A1.2 expression increased maximal respiratory capacity of these cells.
Together, these results suggest that the levels of macroH2A1.1 but not macroH2A1.2 contribute to mitochondrial activity while leaving mitochondrial biogenesis unaffected.
Changes in gene expression are unlikely to account for the metabolic phenotype
As structural chromatin components macroH2A proteins have an ambivalent, most likely indirect role on gene expression and can affect transcription both positively and
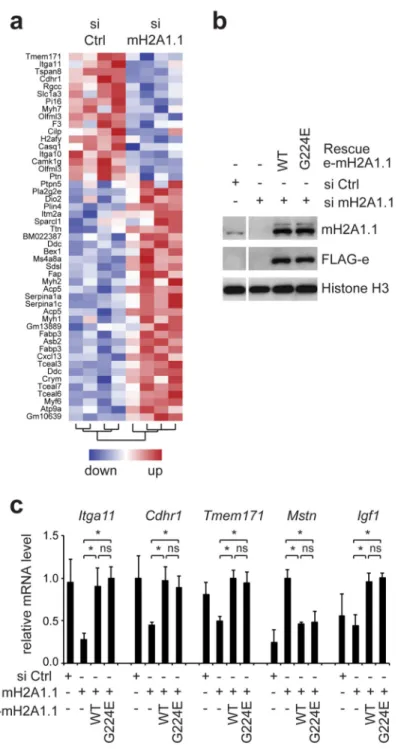
negatively28. In order to test whether changes in gene expression could explain the observed mitochondrial defect, we decided to perform a transcriptomic analysis comparing control and macroH2A1.1-depleted myotubes at day 4 of differentiation. This analysis allowed us to identify 797 differentially expressed genes (see Supplementary Data Set 2 for a complete list). Most of these changes were subtle and less than 50 genes were up- or down regulated more than two-fold (Supplementary Fig. S3a). Surprisingly, among these top regulated genes we did not identify any obvious candidates that could have explained the observed reduced metabolic activity (Fig. 4a). Rather contrarily, known fatty acid oxidation or glycolysis genes were not affected or slightly up regulated (Supplementary Fig. S3b). Furthermore, we did not find any enrichment of gene ontology terms related to metabolism in differentially expressed genes (Supplementary Data Set 2). Thus, the analysis of differentially expressed genes did not provide a testable hypothesis for the cause of the observed metabolic phenotype.
Europe PMC Funders Author Manuscripts
To test whether integrity of the metabolite-binding pocket would be required for the
influence of macroH2A1.1 on gene expression, we performed rescue experiments comparing wild-type macroH2A1.1 and the G224E mutant, that is unable to bind ADP ribose 12. Specifically, we stably overexpressed equal levels of both proteins in C2C12 cells that were depleted for endogenous macroH2A1.1 with siRNA and analyzed at day 4 of differentiation (Fig. 4b). We selected three top regulated genes (Itga11, Cdhr1 and Tmem171) and also included two genes related to muscle growth (Mstn and Igf1) in our analysis. We found that wild-type and mutant constructs were equally efficient in rescuing the transcription of all five genes (Fig.4c).
Taken together the capacity of macroH2A1.1 to regulate these genes in myotubes does not depend on ADP ribose binding.
MacroH2A1.1 binds and inhibits PARP-1
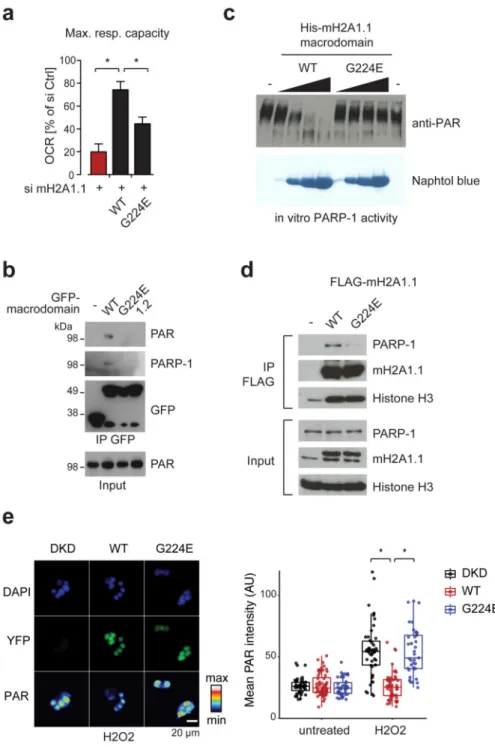
In contrast to gene regulation, the metabolic function of macroH2A1.1 depends at least in part on the integrity of its binding pocket. We used the same cells as for the transcriptional analysis (Fig. 4b,c) and compared wild-type and G224E mutant in a metabolic rescue experiment. While wild-type macroH2A1.1 was able to rescue maximal respiratory capacity, the G224E mutant was significantly less effective (Fig. 5a). This supports the idea that this function could be mediated by ADP ribose binding.
The binding pocket of the macroH2A1.1 macrodomain accommodates the ADP ribose molecule in a capping mode13. This allows macroH2A1.1 to bind ADP ribose also when part of a poly ADP ribose (PAR) chain or in the context of a post-translational modification covalently linked to protein, such as PARP-1. Since links to metabolic activity have been reported for PARP-129,30, we decided to confirm the binding of macroH2A1.1 to PARP-1 and the requirement of the binding pocket in our setting. In vitro, we found that, when transfected into HEK293T cells, the macrodomain of wild-type macroH2A1.1, but not the G224E mutant or the macro domain of the macroH2A1.2 isoform, was able to precipitate PARylated PARP-1 (Fig. 5b). Next, we monitored the enzymatic capacity of recombinant PARP-1 in the presence of macrodomains. As shown in Fig. 5c, the wild-type macrodomain of macroH2A1.1 but not the G224E mutant inhibited the auto-PARylation of PARP-1. Next we moved to C2C12 cells and confirmed that also when expressed in cells the binding of macroH2A1.1 to PARP-1 depended on the integrity of its binding pocket (Fig. 5d). To test the influence of macroH2A1.1 on stress-induced PAR formation in cells, we have used quantitative immunofluorescence analysis of HepG2 cells expressing wild-type macroH2A1.1 or its binding pocket mutant G224E in a depleted background. After treatment with H2O2, PAR accumulates in the nucleus of the cells (Fig. 5e). This accumulation is largely inhibited when cells express wild-type macroH2A1.1, while expression of the G224E mutant had no affect.
In line with an earlier report31, macroH2A1.1 binds and inhibits PARP-1 in a manner that is dependent on the integrity of its ADP ribose-binding pocket.
Europe PMC Funders Author Manuscripts
PARP inhibition rescues the mitochondrial phenotype
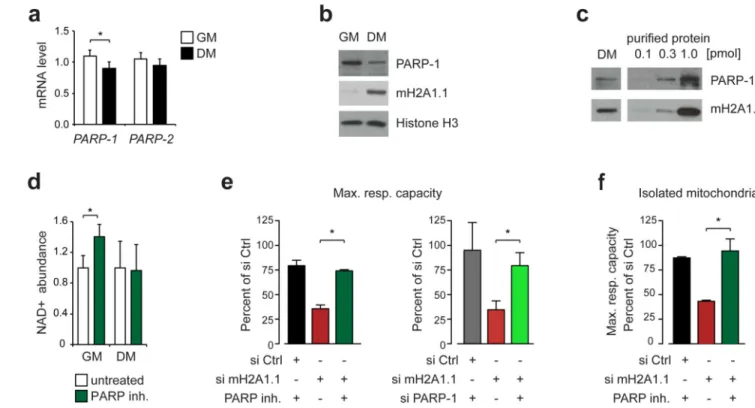
In continuation, we tested whether nuclear PARPs could be mediating the mitochondrial phenotype induced by macroH2A1.1 depletion. During myogenic differentiation PARP-1 was down regulated on the level of mRNA and protein (Fig. 6a,b), while PARP-2 mRNA levels remained unaltered (Fig. 6a). In differentiated cells macroH2A1.1 and PARP-1 are expressed in a similar range but macroH2A1.1 is slightly more abundant than PARP-1 (Fig. 6c). As we are lacking the tools to directly measure the basal activity of PARP-1, we decided to indirectly and rather globally assess cellular PARP activity by measuring the influence of a PARP inhibitor – specific for several PARPs including PARP-1 and PARP-2 – on the cellular levels of its enzymatic co-factor NAD+. We found that short-term treatment with the inhibitor increased the levels of NAD+ in proliferating myoblasts but not differentiated myotubes (Fig. 6d). These results suggest that PARPs could have a basal activity in myoblasts that is absent in myotubes.
To test our intriguing hypothesis that loss of PARP-1 inhibition by macroH2A1.1 depletion could mediate the described metabolic phenotype, we performed rescue experiments. Specifically, we treated differentiated C2C12 cells depleted for macroH2A1.1 with PARP inhibitor or co-transfected PARP-1 specific siRNA and determined mitochondrial capacity. As shown, both pharmacologic and genetic inhibition of PARP-1 was sufficient to rescue mitochondrial activity in macroH2A1.1-depleted myotubes and isolated mitochondria (Fig. 6e and f).
Taken together these results further substantiate the idea that the influence of macroH2A1.1 on mitochondrial activity is mediated by the inhibition of nuclear PARP activity, particularly of PARP-1.
The NAD+ precursor NMN mediates macroH2A1.1 influence on mitochondrial function
PARP-1 is one of the major consumers of the nuclear NAD+ pool3. To test whether changes in NAD+ metabolism could provide the molecular link between macroH2A1.1 and
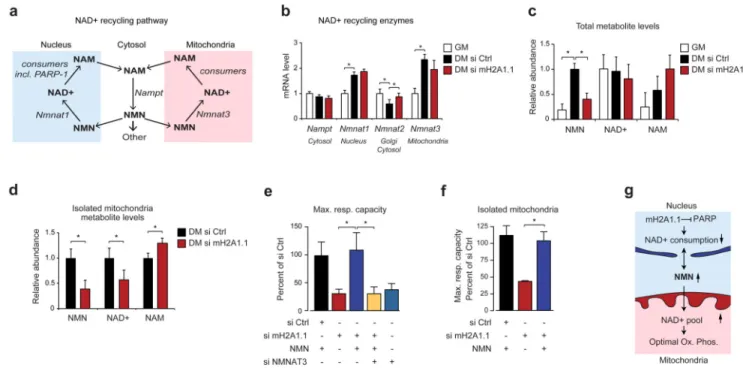
mitochondrial activity, we decided to assess possible changes in NAD+ and its precursors. The salvage pathway regenerating NAD+ from nicotinamide (NAM, see Fig. 7a) is the main biosynthetic pathway for NAD+1. After rate-limiting conversion of NAM to NAM
mononucleotide (NMN) by nicotinamide phopshoribosyltransferase (Nampt) in the cytosol, different NMN adenyl transferases (Nmnat) generate NAD+ from NMN in different subcellular compartments32. During myogenic differentiation mRNAs encoding nuclear Nmnat1 and mitochondrial Nmnat3 were up regulated, while the mRNA of the Golgi/ cytosolic enzyme Nmnat2 was down regulated (Fig. 7b). Knockdown of macroH2A1.1 increased the mRNA level of the Golgi enzyme but left those of nuclear and mitochondrial enzymes unaffected (Fig. 7b). Next, we directly measured the global cellular levels of NAD +, NMN and NAM under the same conditions and found that knockdown of macroH2A1.1 significantly reduced the level of NMN but left the other metabolites largely unaffected (Fig. 7c). Interestingly, NMN was also the only metabolite of the NAD+ salvage pathway
significantly changing during differentiation, being several-fold higher in differentiated cells (Fig. 7c). Next, we decided to test whether altered NMN levels would translate into a specific change in mitochondrial NAD+. For this we have purified mitochondria
Europe PMC Funders Author Manuscripts
(Supplementary Fig. S4a) and repeated the metabolite measurement. We found that both NMN and NAD+ were significantly reduced in mitochondria while the level of NAM was slightly increased (Fig. 7d). Thus, in myotubes lacking macroH2A1.1 the reduction of total and mitochondrial NMN correlated with reduced mitochondrial respiratory capacity. As shown in Figure 7e, addition of NMN to culture media was able to rescue mitochondrial respiratory capacity in macroH2A1.1-depleted cells. The same was true when mitochondria were isolated before analysis (Fig. 7f). Knockdown of the mitochondrial enzyme Nmnat-3 reduced mitochondrial activity on its own and blunted the capacity of NMN to rescue mitochondrial respiration in macroH2A1.1-depleted cells (Fig. 7e and Supplementary Fig. S4b). Furthermore, neither NMN treatment nor PARP-1 inhibition rescued a panel of genes sensitive to macroH2A1.1 depletion (Supplementary Fig. S4c).
These results strongly support the idea that the influence of macroH2A1.1 on mitochondrial activity is mediated through NAD+ metabolism and in particular through the levels of the NAD+ precursor NMN (Fig. 7g).
To conclude, we have provided evidence that macroH2A1.1 controls mitochondrial metabolism in in a manner largely independent of gene regulation by maintaining proper mitochondrial levels of NAD+, through inhibiting its nuclear consumption by PARP-1.
Discussion
A structural chromatin component inhibits PARP-1 and affects mitochondrial activity
Our results describe a novel mechanism by which differentiating muscle cells couple a change in chromatin composition to de novo requirements for metabolic activity. Initially, we find that during myogenic differentiation muscle cells switch the splicing of the transcript encoding the histone variant macroH2A1 to an increased expression of ADP ribose-binding macroH2A1.1 isoform in myotubes. While myoblasts are highly proliferative and have a high demand for the generation of biomass, differentiating cells exit the cell cycle and shift towards increased use of carbon for mitochondrial ATP production. In our study, knockdown of macroH2A1.1 in myotubes reduced the oxidative capacity of their
mitochondria, demonstrating that the knockdown of this structural chromatin component impacts cellular metabolism. Knockdown of the individual macroH2A1.1 splice isoform had no major influence on differentiation. Thus, the influence of macroH2A1.1 depletion on mitochondrial metabolism could not be explained by a simple delay in differentiation. In the genome macroH2A1.1 is abundant and widely distributed making it suitable to mediate global nuclear effects. Taken together, our and previous results13,14,31 suggest that macroH2A1.1 can bind and inhibit auto-modified PARP-1 and possibly other nuclear PARPs. Basal PARP-1 activity is lost when its endogenous antagonist macroH2A1.1 becomes expressed during myogenic differentiation. Although it is conceivable that strong stimuli will still be able to overcome this level of inhibition, the threshold for PARP-1 activation is higher in fully differentiated cells that express macroH2A1.1. PARP-1 is the major NAD+ consuming activity in the nucleus3 and its activity impacts on NAD+ dependent reactions in other organelles and mitochondrial activity29,30. The expression of macroH2A1.1 and its dampening of PARP-1 activity might allow non-proliferating muscle
Europe PMC Funders Author Manuscripts
cells to avoid unnecessary, low stress-induced NAD+ consumption in the nucleus while prioritizing its use for ATP production in mitochondria and cell survival.
The influence on mitochondrial activity is largely independent of gene regulation
MacroH2A proteins have a reported ambivalent role in transcription28 that might be to some extent secondary to their function in regulating higher order chromatin architecture7. Although we cannot fully exclude a partial influence of gene regulation, several observations suggest that the influence of macroH2A1.1 on mitochondrial activity is largely independent of gene regulation. First, we did not identify any obvious candidate among the deregulated genes in macroH2A1.1-depleted myotubes. Second, PARP inhibition rescued the respiratory phenotype of macroH2A1.1-depleted cells (Figure 6e and f) while mimicking loss of macroH2A1.1 in gene regulation33. Third, in addition to PARP inhibition, also the addition of the NAD+ precursor NMN rescued the mitochondrial phenotype but not gene regulation (compare Fig.7e and Supplementary Fig. S4c). Finally, the experiments with the G224E mutant of macroH2A1.1 suggested that the binding pocket was required for rescuing respiratory capacity but not gene expression (compare Figures 4c and 5a). The requirement of ADP ribose capacity macroH2A1.1 is in line with the observation that macroH2A1.2 did not affect stress-induced PARylation or mitochondrial activity.
It is conceivable that all macroH2A proteins exert a common function in chromatin architecture and thus exert a shared influence on a subset of genes. The capacity to inhibit PARP-1 and possibly other PARPs, however, is unique for macroH2A1.1 and mediates its influence on mitochondrial activity.
NMN communicates metabolic states between nucleus and mitochondria
Nucleus and mitochondria are important organelles that control genome usage and energy metabolism, respectively. It is intuitive that cells have evolved mechanisms that allow them to communicate and coordinate these two key activities. As mitochondria and nuclei are spatially separated compartments, shared metabolites have great potential to act as messenger molecules. Our results suggest that changes in the level of the NAD+ precursor NMN mediate the influence of macroH2A1.1 on mitochondrial activity.
NAD+ is a key metabolite of the central metabolism and required for metabolic pathways in nucleus and mitochondria. NAD+ is indeed required for proper mitochondrial function, and its reduced form NADH is essential for the functioning of the respiratory chain2. As cells are known to be able to replenish NAD+ pools primarily through the salvage pathway regenerating NAD+ from NAM through NMN1, we also analyzed the influence of
macroH2A1.1 depletion on the level of the precursors NMN and NAM. We found NMN to be depleted in macroH2A1.1 knockdown cells, suggesting that in the absence of
macroH2A1.1, NAD+ consumption is indeed accelerated but largely compensated by the salvage pathway.
Since NAD+ cannot cross the mitochondrial membrane, mitochondrial and nucleo-cytoplasmic NAD+ pools are separate. How mitochondria maintain their NAD+ pool is a topic of ongoing debate 34–37. A study using novel biosensors suggested that different mechanisms exist and that their relative contribution to the mitochondrial NAD+ pool is to
Europe PMC Funders Author Manuscripts
some extent cell-type dependent38. Among these mechanisms, the import of the precursor NMN and its subsequent conversion to NAD+ by Nmnat-3 contributes substantially to the mitochondrial NAD+ pool in several cell types37. We found that the depletion of total NMN pool in macroH2A1.1 knockdown cells resulted in a specific reduction of mitochondrial NAD+, while total NAD+ levels were not affected. This suggests that the mitochondria are less effective in regenerating NAD+ from NMN than the nucleo-cytosolic compartment. Indeed, the nuclear NNMAT1 has a lower Km for NMN than mitochondrial NMNAT332 and thus might be more effective in regenerating NAD+, in particular when the concentration of NMN is decreased. Further, secondary biosynthetic pathways might facilitate the
regeneration of NAD+ primarily in the cytosol. Independent of the exact mechanism, our results support a model in which NMN is in a central position communicating changes in nuclear NAD+ usage to mitochondria. In strong support of this model we find that addition of NMN to culture media is sufficient to rescue the mitochondrial defect in macroH2A1.1-depleted cells (Fig. 7e,f). This rescue is abrogated by the knockdown of mitochondrial Nmnat3 confirming the necessity of the NMN salvage pathway for restoring normal mitochondrial activity.
In conclusion, our findings suggest a model in which the expression of macroH2A1.1 links the chromatin state to optimal energy metabolism through limiting nuclear NAD+
consumption and buffering of the NAD+ precursor NMN. Different mammalian tissues express different levels of macroH2A1.1 (Figure 1A), which provides a mechanism to adjust the threshold of nuclear PARP activation to cell-type specific nuclear and mitochondrial requirements for NAD+. Several studies have related the expression of macroH2A1.1 with the progression of differentiation and reduced proliferation39,40. It will be interesting to evaluate whether a shift in splicing towards more macroH2A1.1 might be a general phenomenon of terminal differentiation processes that are coupled to an exit from the cell cycle. The observation that overexpression of macroH2A1.1 but not macroH2A1.2
prevented nutrient-enforced fat accumulation in liver cells41,42 supports the idea that such a mechanism would not be restricted to the muscle lineage. Future work will address the exciting question to what extent macroH2A1.1 controls metabolic homeostasis in vivo, particularly under conditions that challenge mitochondrial function such as stress, exercise and aging.
Online Methods
Cell cultures and isolation of primary myoblasts
C2C12 myoblasts (ATCC, CRL-1772) were grown in growth medium (GM) consisting of DMEM (Gibco) containing 20% FBS (Invitrogen) and 1% Penicillin-Streptomycin (Gibco). Tissues and primary mouse myoblasts were prepared from 2 month old C57BL/6 mice as described elsewhere43. Animal housing and handling procedures to isolate primay muscle cells were approved by the ethics committee of the Germans Trias i Pujol Research Institute, in accordance with the Catalan Government’s Animal Care guidelines. Primary myoblasts were maintained in Ham’s F10 (Gibco) medium complemented with 20% FBS (Invitrogen), 10 ng/ml of bFGF (Invitrogen), 0,1% Fungizone (Invitrogen), Penicillin-Streptomycin. For primary myoblasts maintenance, cell culture plates were coated with rat-tail collagen I (BD
Europe PMC Funders Author Manuscripts
Biosciences) for 2h at 37ºC. For differentiation, cell culture plates were Matrigel-treated (BD Biosciences) for 1h at 37ºC. Differentiation medium (DM) for all cell cultures was DMEM supplemented with 2% Horse serum (Gibco) and Penicillin-Streptomycin. To induce differentiation, cells were seeded at high confluence and on the following day washed once with PBS before differentiation was induced by the addition of DM.
HEK293T (ATCC, CRL-3216), GP2 packaging cells (Clontech, 631458) and HepG2 (HB-0865) were grown in DMEM containing 10% FBS and Penicillin-Streptomycin. Primary mouse myoblasts were prepared as described elsewhere43. Human primary myoblasts were kindly provided by Eduard Gallardo (Institut de Recerca Hospital de la Santa Creu i Sant Pau, Barcelona, Spain) and maintained in DMEM (Biowhittaker) containing 10% FBS (Hyclone), 15 ng/ml of bFGF (Invitrogen), 10 ng/ml EGF and 1% insulin 1 mg/ml (Sigma-Aldrich) and on 0,1% gelatin-coated plates. For differentiation, medium containing 1% insulin 1 mg/ml (Sigma-Aldrich) was used.
Plasmids, gene transduction and siRNA transfection
For plasmid construction, standard cloning techniques have been used. Mouse macroH2A1.1 was amplified from C2C12 cell cDNA and inserted into a retroviral pBabe.puro backbone. The G224E pocket-binding mutant and the silent mutations at the siRNA recognition site were generated using Stratagene’s site-directed mutagenesis QuikChange protocol. Plasmids encoding GFP and His-tagged macro domains (corresponding to amino acids 155-369 of macroH2A1.1 and 155-372 of macroH2A1.2) were described previously13.
Retroviral infections were performed essentially as described with minor changes in the preparation of the target cells44. Briefly, C2C12 myoblasts were seeded the day prior to infection onto 6-well plates at the density of 10.000 cells per well. Cells were exposed to viral supernatant containing 0.3 volumes of fresh medium and 8 μg/ml polybrene (Sigma-Aldrich) for 45 min while centrifugating at 1000 g and 32ºC and for another 1,5 h in the incubator.
Validated siRNAs45 were obtained from Invitrogen (see also Supplemental Information, Table S1) and transfected using OptiMEM (Gibco) and Lipofectamine RNAiMAX Transfection Reagent (Invitrogen) yielding a final concentration of 10 nM. For knockdown in myotubes, siRNA was repeatedly delivered at day -1, 0 and 2 of differentiation. HEK293T cells were transiently transfected using calcium-phosphate method as previously
described46.
Antibodies and immunodetection
The following antibodies were used: anti-macroH2A1.125; anti-macroH2A1.2 (Cell Signalling, 4827S); anti-macroH2A1 and antimacroH2A218; anti-MyoD (Santa Cruz, sc-760), anti-eMHC F1.652 (Santa Cruz, sc-53091), anti-Myogenin F5D (Santa Cruz, sc-12732); anti-GFP (SantaCruz, sc-9996); anti-histone H3 (AbCam, ab-1791); anti-PARP-1 (Abcam Ab6079, Trevigen 4338-MC-50); anti-NPM1 (Abcam), anti-PAR (AbCam
ab14713, Trevigen 4336-APC-050), anti-Tubulin (Sigma-Aldrich, T6074), anti-NPM1 (Abcam, ab10530), secondary anti-mouse and anti-rabbit conjugated to HRP
Europe PMC Funders Author Manuscripts
(DakoCytomation). The relative intensity of immunoblot bands was quantified by ImageJ software (version 2.0.0-rc-15/1.49k).
Immunoprecipitation and immunoblotting
For immunopreciptation, we have isolated nuclei and solubilized chromatin by sonication. Specifically, cells were collected by scraping and lysed in sucrose buffer (0.32M Sucrose, 10mM Tris HCl pH8.0, 3mM CaCl2, 2mM MgOAc, 0.1% Triton buffer, 1:100 PMSF and 1:500 leupeptin). Samples were passed through a syringe to facilitate membrane disruption and further incubated for 8' on ice. Intact nuclei were collected by centrifugation for 3' at 1000g and washed once more in sucrose buffer. Washed nuclei were resuspended in lysis buffer (50mM Tris HCl, pH7-8, 135mM NaCl, 0.1% Triton, 1mM EDTA, 1mM DTT, 1:100 PMSF and 1:500 leupeptin) and chromatin was solubilized by progressive sonication using Bioruptor (Diagenode). For the precipitation of PARylated PARP-1, PARG and PARP inhibitors were added to the lysis buffer, 1 μM ADP-HPD (CalBioChem) and 1 μM Olaparib (SelleckChem), respectively. Remaining insoluble material was removed by centrifugation and lysates were pre-cleared using sepharose beads (Sigma). At this step, 5% of the total lysate was kept as input material and the rest of the lysate was incubated with antibody-bound beads for 3 hours to over night. Beads were previously blocked with 1% BSA in lysis buffer. Precipitates were washed three times with lysis buffer containing 1% Triton X-100. For SDS-PAGE and Western blot analysis, typically 1% of input and 20%
immunoprecipated material was loaded. The relative intensity of immunoblot bands was quantified by ImageJ software (version 2.0.0-rc-15/1.49k). For cell fractionations, nuclei were prepared as described above and the supernatant was kept as cytosolic fraction. Nuclei were then incubated with 410 mM KCl containing buffer (20mM HEPES pH 7.9, 1.5 mM MgCl2, 0.2 mM EDTA, 25% Glycerol, 1% NP-40) and ultracentrifugation was used to separate the chromatin (pellet) and nucleosol (supernatant).
Immunofluorescence and immunochemistry
For immunofluorescence, cells were grown on Menzel-Gläser slides and fixed in 4% paraformaldehyde (10 min at room temperature). The slides were permeabilizated for 10 min with HCl 0,1M, 0.5% Triton-X 100 in PBS, and washed three times with PBST (PBS containing 0,1% Tween 20). Then, slides were pre-blocked with PBST-BSA (5%) for 30 min at room temperature, and incubated with a 1/50 to 1/100 dilution of specific primary
antibody for 2 h in BSA 5% buffer. After three washes with PBST, the slides were incubated for 1h at room temperature with a 1/100 dilution of secondary goat anti-rabbit antibody conjugated to Alexa 488 (Thermo Fischer). After successive washes with PBST, slides were mounted with Vectashield® Mounting Medium with DAPI. Images were obtained using Leica DMI6000B Advance Fluorescence microscope (Leica) microscope equiped with a 63x/1.4 Plan-Apochromat oil immersion objective. Images were loaded and analysed in Fiji, a distribution of ImageJ.
For immunohistochemistry, 10μM muscle sections were fixed in 100% cold acetone at room temperature. Immunostaining was performed incubating anti-macroH2A1.1 antibody for 1h in Ventana UltraView Universal DAB machine. Nuclei were additionally stained 1 min in Hematoxylin (Sigma-Aldrich). The sections were washed extensively, rinsed in 96%
Europe PMC Funders Author Manuscripts
ethanol, dehydrated twice in absolute ethanol and mounted. Frozen biopsy of human muscle was obtained from the Department for Pathologic Anatomy at the Hospital Universitari Germans Trias I Pujol (Badalona, Spain).
Bacterial protein expression and purification
BL21 (DE3) chemically competent E. coli were transformed with bacterial expression constructs and grown at 20°C after 500 μM IPTG induction. Bacteria were collected and lysed in lysis/wash buffer containing 50 mM Tris-HCl (pH 8), 300 mM NaCl, 10 mM imidazole and protease inhibitors. Afterwards, lysates were cleared by centrifugation for 30 minutes at 4°C and 20000 g. The lysates were incubated with NTA-Ni beads (Quiagen) for 2 h and washed with 10mM imidazole-containing buffer. Proteins of interest were
subsequently eluted by 200mM imidazole-containing elution buffer. The eluted proteins were dialysed over-night against PBS, 5 mM β-mercaptoethanol and 10% glycogen, and finally stored at -80°C.
In vitro PARP-1 activity assay
Auto-PARylation was performed in the buffer containing 50 mM Tris-HCl (pH 8), 50 mM NaCl and 1 mM MgCl at room temperature for 20 minutes. Reaction volume of 30 μL contained 0,2 units/μL PARP-1 HSA enzyme (Trevigen), 0.3x activated DNA (from 10x activated DNA, Trevigen) and 200 μM NAD+ and different concentrations of purified macrodomains. Reactions were stopped by addition of Laemmli’s sample buffer and boiling on 95°C, separated on SDS-PAGE and analyzed by immunoblotting. Transferred proteins were counterstained with naphtol blue (Sigma).
RNA analysis including Restriction Fragment Length Polymorphism (RFLP)
Total RNA from cells was isolated using Invitrogen PureLink™ RNA kit and cDNA was synthesized using First strand cDNA synthesis kit (Fermentas) as described39. Relative cDNA levels were quantified by qRT-PCR. Values were normalized to two or three housekeeping genes (Rpo, GAPDH and Rpl7 for mouse samples; and HPRT1 and Rpo for human samples). All oligos were purchased from Invitrogen and are all listed in the Supplemental Information, Table S1. To check for the possible mitochondrial imbalance, two mitochondrially-encoded (ND3 and CoxI) and two nuclear genome encoded (Ndufa9, CoxIV) genes belonging to Complex I and IV were tested using TaqMan probes from Applied Biosystems (Life Technologies).
RFLP was used in order to qualitatively assess the amount of macroH2A1 isoforms. Essentially, cDNA obtained from RNA was used directly to perform the PCR reaction using oligos specifically annealing on exon 5 and exon 8 or exon 6 and 9 of the mouse and human H2afy/macroH2A1 transcripts, respectively. Amplicons were digested with HpaII/MspI restriction enzyme (ThermoScientific) for 2 h at 37ºC. See scheme in Figure S1b for further detail and Table S1 for oligo sequences. The digested products were separated by 2% agarose gel electrophoresis.
Europe PMC Funders Author Manuscripts
Mitochondrial isolation
All steps are performed at 4°C. Freshly collected cell pellets were resuspended in ice-cold hypotonic lysis buffer (10mM NaCl, 1,5mM MgCl2, 10mM Tris-HCl pH 7.5) containing deacetylases (10mM NAM, 2 μM TSA) and proteases inhibitors (1uM PMSF, 1uM Leupeptin) and incubated on ice for 2 min allowing swelling. To maintain the organelles intact, the ice-cold 2.5X homogenization buffer (800 mM Sucrose, 25 mM Tris HCl, 2,5 mM EDTA) was added to the homogenate. Cell membranes were disrupted using 15 strokes of a teflon pestle in a Potter-Elvehjem homogeniser (Sigma-Aldrich). The nuclear fraction was removed by two successive centrifugations for 10 min at 1200 g. Mitochondria were collected by centrifugation for 20 min at 16000 g and resuspended in 1X homogenization buffer (320 mM Sucrose, 10 mM Tris HCl, 1 mM EDTA) containing protease and deacetylase inhibitors (10mM NAM, 2uM TSA, 1uM PMSF, 1uM Leupeptin).
Oxygen Consumption and Extracellular Acidification Rate Measurements
Analysis of oxygen consumption (OCR) and extracellular acidification (ECAR) rates was performed using a Seahorse XF96 Flux Analyzer (Seahorse Bioscience) as described 47. Briefly, 24 h post-siRNA transfection C2C12 cells were seeded onto XF 96-well cell culture microplates and the day after Mitochondrial Stress Test (MST) and Glycolytic Stress Test (GST) were performed. MST was performed in minimal medium containing 25 mM glucose subsequently adding 1 μM oligomycin, 3 μM FCCP and 2 μM Rotenone together with 2 μM Antimycin A. GST was performed in glucose-free medium adding 10 mM glucose and 10 mM 2-deoxyglucose. For fatty acid oxidation MST, cells were additionally starved for 24 hours in substrate-limited medium (DMEM containing 0,5 mM glucose, 1 mM glutamax, 0,5 mM carnitine and 1% FBS) prior to the assay. Palmitate-BSA was added and MST performed. OCR and ECAR measurements were normalized for genomic DNA content.
Lactate and Glucose measurements
To measure lactate, cell culture supernatant was transferred to 5 mm NMR tubes. 1H-NMR spectra were recorded at 300 K on an Avance III 600 spectrometer (Bruker, Germany) operating at a proton frequency of 600.20 MHz using a 5 mm CPTCI triple resonance (1H, 13C, 31P) gradient cryoprobe. One-dimensional 1H pulse experiments were carried out using the nuclear Overhauser effect spectroscopy (NOESY) presaturation sequence to suppress the residual water peak. The acquired spectral width was 12 kHz (20 ppm), and a total of 256 transients were collected into 64 k data points for each 1H spectrum. 1H NMR spectra were referenced to the chemical shift of TSP signal at 0.0 ppm. References of pure compounds from the metabolic profiling AMIX spectra database (Bruker) and Chenomx database were used for lactic acid identification. After baseline correction, the specific NMR region of lactic acid was integrated using the AMIX 3.9 software package. Glucose concentrations were measured using glucose hexokinase method (Siemens, Dimension RHL Max Clinical Chemistry System, Siemens Healthcare Diagnostics) at the clinical biochemistry laboratory of the Hospital Universitari Germans Trias I Pujol (Spain).
Europe PMC Funders Author Manuscripts
Targeted metabolomics
Adherent cells were washed 3 times with PBS, immediately collected by scraping and shock frozen. Alternatively, mitochondria were isolated and frozen as pellet. Metabolites were extracted into the extraction solvent by adding 300 μL of cold ACN/H2O (1:1). Samples were vigorously mixed by vortexing for 30 seconds and stored at –20 °C for 1 hour to enable protein precipitation. Subsequently, samples were centrifuged 15 minutes at 4 °C and 22600 g and the supernatant was transferred to a LC-MS vial. The samples were analysed using an UHPLC system (1290 Agilent) coupled to a triple quadrupole (QqQ) MS (6490 Agilent Technologies) with iFunnel technology operated in multiple reaction monitoring (MRM) and positive electrospray ionization (ESI+) mode. Metabolites were separated using a C18-RP (ACQUITY UPLC BEH 1.7 μm, Waters) chromatography at flow rate of 0.3 mL/min. The solvent system was A (20 mM ammonium acetate and 15 mM ammonia in
water:acetonitrile [97:3]) and acetonitrile as B. The gradient elution started at 100% A (time 0-1 min) and finished at 100% B (8-11 min). The injection volume was 5 ml. ESI conditions were: gas temperature, 170 °C; drying gas, 11 L/min; nebulizer, 20 psi; and fragmentor, 380 V. Quality controls (QC) consisting of pooled samples were used. Four QC samples were injected repeatedly during the whole analysis. MRM transitions were: NAM (123.06→ 107.10, 80.10), NMN (335.07→ 123.10, 97.00) and NAD+ (664.12→ 428.00, 136.00). The peak areas were manually integrated and the data normalized to total DNA for cells extracts and NDUFA9 protein for isolated mitochondria.
Transcriptomic Analysis
Cells were collected at day 4 of the differentiation, washed well with 1X PBS and stored as pellets at -80ºC. Experiment was repeated for more than 6 times. Once all the pellets were collected, RNA was extracted at once and aliquots of RNA were made. A small aliquot was used to transcribe the RNA into cDNA using the oligo(dT) (as described) and the knock-down of macroH2A1.1 was tested in all biological replicates. Four biological replicates with most successful macroH2A1.1 knock-down were selected, RNA was quantified and quality was checked performing Eukaryote Total RNA Nano assay by IMPPC Genomics facility. RNA was amplified and loaded onto the microarray slide Agilent SurePrint G3 Mouse GE 8x60K Microarray. Differentially expressed genes were identified with the LIMMA48 and selected with a cut-off of a q-value of 0,05 calculated after false discovery rate correction. The Gene Ontology analysis was performed using ChIPpeakAnno R package49 using p-value < 0.01 and 30 for minGOterm (minimum count in a genome for a GO term to be included). A Bonferroni multiple hypothesis testing adjustment was finally applied to adjust the enrichment result. REVIGO online software was used to visualize summaries of the gene ontology analysis 50. Medium was chosen for the SimRel parameter.
ChIP-seq
We have used a described pan-macroH2A1 antibody18 for chromatin immunoprecipitation experiments coupled to massive parallel sequencing (ChIP-seq) that were performed and analysed essentially as previously with minor modifications. After cleaning and trimming, reads were aligned to mouse genome (mm9) using Bowtie 2 version 2.0.6, with sensitive pre-setting option (-D 15 -R 2 -L 22 -i S,1,1.15) 51. To detect genomic regions enriched for
Europe PMC Funders Author Manuscripts
multiple overlapping (peaks) SICER software version 1.1 was used to identify enriched genomic regions using the following settings: redundancy threshold= 2, window size=600, fragment size=250, effective genome fraction = 0.75, gap=1200, FDR=0.05 52.
Statistical Analysis
If not indicated otherwise, data is represented as mean of three or more biological replicates ± standard deviation. If not indicated otherwise, two-tailed student t-test was used to assess statistical significance. The number of biological replicates or independent cell culture experiments is indicated in the figure legends. A Life Sciences Reporting Summary for this article is available online.
Data Access
Microarray expression and ChIP-seq data has been deposited in GEO, with and is available under accession number GSE78257.
Supplementary Material
Refer to Web version on PubMed Central for supplementary material.
Acknowledgements
We thank P. Muñoz Canoves for tools, training and advice, E. Gallardo for primary human myoblasts, S. Samino for help with metabolomics analyses, S.-V. Forcales, A. Mikoč and the Ahel lab for helpful discussions and the departments of pathology and biochemistry of the Hospital Universitari Germans Trias I Pujol (HGTP) for excellent support.
This project was supported by grants MINECO SAF2012-39749 (MB), MINECO BFU2015-66559-P (MB), and AFM-Téléthon 18738 (MB), the Marie Skłodowska Curie Training network ‘ChroMe’
H2020-MSCA-ITN-2015-675610 (MB, AGL, OY and JAP), Minerva Foundation ARCHES and DZD (TP), ERC 281641 and 682679 (JAP), MINECO SAF2012-37427 (MS), DFG SFB 646 and DFG SFB 1064 (AGL), Wellcome Trust 101794, C35050/A22284, and UKF 1B 2/13 (IA), ISCIII PI15/00701 (PMGR), FPU14/06542 (DC), AGAUR FI fellowship (MPM), and JCI-2011-10831 (JD). Work in the Buschbeck lab is further supported by the Deutsche José Carreras Leukaemie Stiftung (DJCLS R 14/16), MINECO-ISCIII (PIE16/00011) and AGAUR (2014-SGR-35). Research at the IJC is supported by the ‘La Caixa’ Foundation, the Fundació Internacional Josep Carreras, Celgene Spain and the CERCA Programme / Generalitat de Catalunya.
References
1. Belenky P, Bogan KL, Brenner C. NAD+ metabolism in health and disease. Trends in Biochemical Sciences. 2007; 32:12–19. [PubMed: 17161604]
2. Stein LR, Imai S-I. The dynamic regulation of NADmetabolism in mitochondria. Trends in Endocrinology & Metabolism. 2012; 23:420–428. [PubMed: 22819213]
3. Altmeyer M, Hottiger MO. Poly(ADP-ribose) polymerase 1 at the crossroad of metabolic stress and inflammation in aging. Aging (Albany NY). 2009; 1:458–469. [PubMed: 20157531]
4. Bai P. Biology of Poly(ADP-Ribose) Polymerases: The Factotums of Cell Maintenance. Molecular Cell. 2015; 58:947–958. [PubMed: 26091343]
5. Gibson BA, Kraus WL. New insights into the molecular and cellular functions of poly(ADP-ribose) and PARPs. Nature Reviews Molecular Cell Biology. 2012; 13:411–424. [PubMed: 22713970] 6. Cantó C, Menzies KJ, Auwerx J. Metabolism and the Controlof Energy Homeostasis: A Balancing
Act between Mitochondria and the Nucleus. Cell Metabolism. 2015; 22:31–53. [PubMed: 26118927]
7. Douet J, et al. MacroH2A histone variants maintain nuclear organization and heterochromatin architecture. Journal of Cell Science. 2017; 130:1570–1582. [PubMed: 28283545]
Europe PMC Funders Author Manuscripts
8. Buschbeck M, Di Croce L. Approaching the molecular and physiological function of macroH2A variants. epigenetics. 2010; 5:118–123. [PubMed: 20160488]
9. Posavec M, Timinszky G, Buschbeck M. Macro domains as metabolite sensors on chromatin. Cell Mol Life Sci. 2013; 70:1509–1524. [PubMed: 23455074]
10. Rivera-Casas C, Gonzalez-Romero R, Cheema MS, Ausió J, Eirin-López JM. The characterization of macroH2A beyond vertebrates supports an ancestral origin and conserved role for histone variants in chromatin. epigenetics. 2016; 11:415–425. [PubMed: 27082816]
11. Chakravarthy S, et al. Structural characterization of the histone variant macroH2A. Molecular and Cellular Biology. 2005; 25:7616–7624. [PubMed: 16107708]
12. Kustatscher G, Hothorn M, Pugieux C, Scheffzek K, Ladurner AG. Splicing regulates NAD metabolite binding to histone macroH2A. Nature Structural & Molecular Biology. 2005; 12:624– 625.
13. Timinszky G, et al. A macrodomain-containing histone rearranges chromatin upon sensing PARP1 activation. Nature Structural & Molecular Biology. 2009; 16:923–929.
14. Mehrotra PV, et al. DNA Repair Factor APLF Is a Histone Chaperone. Molecular Cell. 2011; 41:46–55. [PubMed: 21211722]
15. Ramamoorthy M, Smith S. Loss of ATRX Suppresses Resolution of Telomere Cohesion to Control Recombination in ALT Cancer Cells. Cancer Cell. 2015; 28:357–369. [PubMed: 26373281] 16. Jankevicius G, et al. A family of macrodomain proteins reverses cellular mono-ADP-ribosylation.
Nature Structural & Molecular Biology. 2013; 20:508–514.
17. Rosenthal F, et al. Macrodomain-containing proteins are new mono-ADP-ribosylhydrolases. Nature Structural & Molecular Biology. 2013; 20:502–507.
18. Buschbeck M, et al. The histone variant macroH2A is an epigenetic regulator of key developmental genes. Nature Structural & Molecular Biology. 2009; 16:1074–1079.
19. Kapoor A, et al. The histone variant macroH2A suppresses melanoma progression through regulation of CDK8. Nature. 2010; 468:1105–1109. [PubMed: 21179167]
20. Pasque V, Gillich A, Garrett N, Gurdon JB. Histone variant macroH2A confers resistance to nuclear reprogramming. The EMBO Journal. 2011; 30:2373–2387. [PubMed: 21552206]
21. Changolkar LN, et al. Developmental Changes in Histone macroH2A1-Mediated Gene Regulation. Molecular and Cellular Biology. 2007; 27:2758–2764. [PubMed: 17242180]
22. Boulard M, et al. Histone variant macroH2A1 deletion in mice causes female-specific steatosis. Epigenetics & Chromatin. 2010; 3:8. [PubMed: 20359320]
23. Sheedfar F, et al. Genetic ablation of macrohistone H2A1 leads to increased leanness, glucose tolerance and energy expenditure in mice fed a high-fat diet. Int J Obes (Lond). 2015; 39:331–338. [PubMed: 24849394]
24. Pehrson JR, Changolkar LN, Costanzi C, Leu NA. Mice without MacroH2A Histone Variants. Molecular and Cellular Biology. 2014; 34:4523–4533. [PubMed: 25312643]
25. Sporn JC, et al. Histone macroH2A isoforms predict the risk of lung cancer recurrence. Oncogene. 2009; 28:3423–3428. [PubMed: 19648962]
26. Dell’Orso S, et al. The Histone Variant MacroH2A1.2 Is Necessary for the Activation of Muscle Enhancers and Recruitment of the Transcription Factor Pbx1. CellReports. 2016; :1–26. DOI: 10.1016/j.celrep.2015.12.103
27. Houtkooper RH, et al. Mitonuclear protein imbalance as a conserved longevity mechanism. Nature. 2013; 497:451–457. [PubMed: 23698443]
28. Creppe C, Posavec M, Douet J, Buschbeck M. MacroH2A in stem cells: a story beyond gene repression. Epigenomics. 2012; 4:221–227. [PubMed: 22449192]
29. Pirinen E, et al. Pharmacological Inhibition of Poly(ADP-Ribose) Polymerases Improves Fitness and Mitochondrial Function in Skeletal Muscle. Cell Metabolism. 2014; 19:1034–1041. [PubMed: 24814482]
30. Bai P, et al. PARP-1 Inhibition Increases Mitochondrial Metabolism through SIRT1 Activation. Cell Metabolism. 2011; 13:461–468. [PubMed: 21459330]
31. Ouararhni K, et al. The histone variant mH2A1.1 interferes with transcription by down-regulating PARP-1 enzymatic activity. Genes & Development. 2006; 20:3324–3336. [PubMed: 17158748]
Europe PMC Funders Author Manuscripts
32. Berger F, Lau C, Dahlmann M, Ziegler M. Subcellular compartmentation and differential catalytic properties of the three human nicotinamide mononucleotide adenylyltransferase isoforms. J Biol Chem. 2005; 280:36334–36341. [PubMed: 16118205]
33. Chen H, et al. MacroH2A1.1 and PARP-1 cooperate to regulate transcription by promoting CBP-mediated H2B acetylation. Nature Structural & Molecular Biology. 2014; 21:981–989.
34. Revollo JR, Grimm AA, Imai SI. The NAD Biosynthesis Pathway Mediated by Nicotinamide Phosphoribosyltransferase Regulates Sir2 Activity in Mammalian Cells. Journal of Biological Chemistry. 2004; 279:50754–50763. [PubMed: 15381699]
35. Yang H, et al. Nutrient-Sensitive Mitochondrial NAD+ Levels Dictate Cell Survival. Cell. 2007; 130:1095–1107. [PubMed: 17889652]
36. Pittelli M, et al. Inhibition of nicotinamide phosphoribosyltransferase: cellular bioenergetics reveals a mitochondrial insensitive NAD pool. Journal of Biological Chemistry. 2010; 285:34106– 34114. [PubMed: 20724478]
37. Nikiforov A, Dölle C, Niere M, Ziegler M. Pathways and subcellular compartmentation of NAD biosynthesis in human cells: from entry of extracellular precursors to mitochondrial NAD generation. Journal of Biological Chemistry. 2011; 286:21767–21778. [PubMed: 21504897] 38. Cambronne XA, et al. Biosensor reveals multiple sources for mitochondrial NAD+ Science. 2016;
352:1474–1477. [PubMed: 27313049]
39. Creppe C, et al. MacroH2A1 Regulates the Balance between Self-Renewal and Differentiation Commitment in Embryonic and Adult Stem Cells. Molecular and Cellular Biology. 2012; 32:1442–1452. [PubMed: 22331466]
40. Sporn JC, Jung B. Differential Regulation and Predictive Potential of MacroH2A1 Isoforms in Colon Cancer. AJPA. 2012; 180:2516–2526.
41. Podrini C, et al. MacroH2A1 isoforms are associated with epigenetic markers for activation of lipogenic genes in fat-induced steatosis. The FASEB Journal. 2015; 29:1676–1687. [PubMed: 25526730]
42. Pazienza V, et al. SIRT1-metabolite binding histone macroH2A1.1 protects hepatocytes against lipid accumulation. Aging (Albany NY). 2014; 6:35–47. [PubMed: 24473773]
43. Perdiguero E, et al. Genetic analysis of p38 MAP kinases in myogenesis: fundamental role of p38alpha in abrogating myoblast proliferation. The EMBO Journal. 2007; 26:1245–1256. [PubMed: 17304211]
44. Cantariño N, et al. A cellular model reflecting the phenotypic heterogeneity of mutant HRAS driven squamous cell carcinoma. Int J Cancer. 2016; 139:1106–1116. [PubMed: 27074337] 45. Dardenne E, et al. Splicing switch of an epigenetic regulator by RNA helicases promotes
tumor-cell invasiveness. Nature Structural & Molecular Biology. 2012; 19:1139–1146.
46. Buschbeck M, et al. PML4 induces differentiation by Myc destabilization. Oncogene. 2007; 26:3415–3422. [PubMed: 17146439]
47. Teperino R, et al. Hedgehog Partial Agonism Drives Warburg-like Metabolism in Muscle and Brown Fat. Cell. 2012; 151:414–426. [PubMed: 23063129]
48. Wettenhall JM, Smyth GK. limmaGUI: A graphical user interface for linear modeling of microarray data. Bioinformatics. 2004; 20:3705–3706. [PubMed: 15297296]
49. Zhu LJ, et al. ChIPpeakAnno: a Bioconductor package to annotate ChIP-seq and ChIP-chip data. BMC Bioinformatics. 2010; 11:237. [PubMed: 20459804]
50. Supek F, Bošnjak M, Škunca N, Šmuc T. REVIGO Summarizes and Visualizes Long Lists of Gene Ontology Terms. PLoS ONE. 2011; 6:e21800. [PubMed: 21789182]
51. Langmead B, Salzberg SL. Fast gapped-read alignment with Bowtie 2. Nature Methods. 2012; 9:357–359. [PubMed: 22388286]
52. Zang C, et al. A clustering approach for identification of enriched domains from histone modification ChIP-Seq data. Bioinformatics. 2009; 25:1952–1958. [PubMed: 19505939]
Europe PMC Funders Author Manuscripts
Figure 1. A splicing switch up regulates macroH2A1.1 during myogenic differentiation. (a) Restriction fragment length polymorphism (RFLP) of macroH2A1 (mH2A1)-encoding transcripts in a panel of mouse tissues. Fragments sizes were 131 bp for macroH2A1.1 and two overlapping fragments of 89 bp for macroH2A1.2 (see also Supplementary Fig. S1a and b for more detail).
(b) Immunoblot analysis of mouse skeletal muscle and FLAG-tagged reference samples using isoform-specific macroH2A1.1 antibody and anti-FLAG.
(c) Primary myoblasts and C2C12 cells were differentiated (DM, differentiation medium) and analyzed by RFLP. Please note that resulting fragment sizes are different in human and mouse samples (see Supplementary Fig. S1b). (c)-(e) The zero time point refers to
subconfluent cells grown in growth medium.
(d) Relative mRNA levels of macroH2A transcripts (normalized to equimolar reference samples to allow direct comparison) and differentiation markers Myogenin (Myog) and muscle-specific creatine kinase (Ckm) during a time course of differentiation were analyzed
Europe PMC Funders Author Manuscripts
by RT-qPCR. Data is presented as mean + s.d. (n = 3 independent experiments; *p<0.05 compared to control at same time point).
(e) Immunoblot analysis of C2C12 cells during a time course of differentiation. MacroH2A1 isoforms, histone H3 and the differentiation markers MyoG and embryonic myosin heavy chain (eMHC) were analyzed.
(a-c and e) Uncropped gel and blot images are shown in Supplementary Data Set 1.
Europe PMC Funders Author Manuscripts
Figure 2. Knockdown of macroH2A1.1 results in metabolic changes, but does not affect myogenic differentiation.
(a) Scheme of the experimental set up. Proliferating C2C12 cells were first grown in growth medium (GM) and differentiated in differentiation medium (DM). Medium changes and siRNA transfections are indicated. mRNA levels were analyzed by RT-qPCR. Data is mean + s.d. (n = 5 independent experiments; * = p<0,05 comparing to si Ctrl).
(b) C2C12 cells were treated as described in (a) and analyzed at day 4 (DM) using anti-embryonic myosin heavy chain immunostaining (green) as marker of myotubes and DAPI as DNA counterstain (blue). Column graphs show the total number of nuclei that were
analyzed in a predefined area and as measure of differentiation the percentage number of nuclei in eMHC-stained cells (n = 3 independent experiments; ns, not significant). (c) Relative RNA levels of differentiation genes MyoD, myogenin (MyoG), and muscle-specific creatine kinase (Ckm) analyzed by RT-qPCR (n = 4 independent experiments, * = p<0,05 comparing to si Ctrl).
(d) Differences in medium color observed after 4 days of differentiation and 48 hours after last media change.
(e) Extracellular glucose (n = 3) and lactate (n = 4) levels and total cellular protein
concentration (n = 4) were measured in samples shown in (d). Data is represented as mean + s.d. of n independent experiments (*p<0,05; ns, not significant).
Europe PMC Funders Author Manuscripts
(f) Glycolysis was analyzed by monitoring extracellular acidification rate (ECAR) in siRNA-treated C2C12 cells after overnight glucose starvation (n = 5 independent experiments), Glucose (Glc) addition and quenching with 2-deoxyglucose (2-DG), normalized for genomic DNA content.
(g) Mitochondrial respiratory capacity was assessed by measuring oxygen consumption rate (OCR) of siRNA-transfected C2C12 cells in medium with normal sugar content normalized for genomic DNA content (n = 5 independent experiments). As indicated the ATPase inhibitor oligomycin (O), the uncoupling compound FCCP (F) and the electron transport chain inhibitors Rotenone/Antimycin A (AA) were subsequently added.
Europe PMC Funders Author Manuscripts
Figure 3. Knockdown of macroH2A1.1 causes defective mitochondrial respiration.
(a) Starved C2C12 cells were primed with fatty acids and ATPase inhibitor oligomycin (O), the uncoupling compound FCCP (F) and the electron transport chain inhibitors Rotenone/ Antimycin A (AA) were subsequently added. C2C12 cells were previously treated with si control (si Ctrl), si macroH2A1.1 and si macroH2A1.2 (si mH2A1.1/1.2). On the right, the relative maximal respiration is blotted (mean + s.d., n = 6 independent experiments; *p<0,05).
(b) Mitochondrial DNA content normalized to nuclear DNA using the ND2 and Ndufv1 gene, respectively (mean + s.d., n = 6 independent experiments).
(c) RT-qPCR analysis of mRNAs encoding components of respiratory chain complexes in proliferating (GM) and differentiated cells (DM, 4 days) treated with si macroH2A1.1 or si Ctrl (Data is mean + s.d.; si Ctrl set to 1; n = 4 independent experiments; *p<0.05).
(d) The mRNA levels of nuclear and mitochondrial genes encoding components of complex I (Ndufa9 and ND3) and IV (CoxIV and CoxI) were measured by Taqman probed RT-qPCR to assess balanced transcription. Data is represented as mean + s.d. of 4 independent experiments.
(e) Same conditions as in (a), but mitochondria were isolated prior to the analysis of respiration from si Ctrl and si mH2A1.1-treated cells (mean + s.d.; n = 6 independent experiments; *p<0,05).
(f) Fatty acid oxidation assay of HepG2 cells double knock-down for macroH2A1 and macroH2A2 (DKD) stably expressing transgenic FLAG-tagged macroH2A1.1,
macroH2A1.2 or none of both (control). Data is mean + s.d. of 9 measurements of different cultures (*p<0,05). On the right immunoblots with indicated antibodies show the expression levels. Lanes 3 and 4 are samples of DKD cells expressing YFP-tagged wild-type and G224E mutant macroH2A1.1, respectively (further analyzed in Fig. 5e). Uncropped blot images are shown in Supplementary Data Set 1.
Europe PMC Funders Author Manuscripts
Figure 4. Gene regulation by macroH2A1.1 is independent of ADP ribose binding. (a) Heatmap of top differentially expressed genes (fold change ≥ 2, *p<0.05) in si
macroH2A1.1 (mH2A1.1) to si ctrl C2C12 cells after 4 days of differentiation. For a full list of all differentially expressed genes please see Supplementary Data Set 2.
(b) FLAG-epitope tagged wild-type and G224E mutant macroH2A1.1 (e-mH2A1.1) were stably expressed in C2C12 cells depleted for endogenous macroH2A1.1 with siRNA. The resulting expression levels were analyzed in C2C12 myotubes after 4 days of differentiation
Europe PMC Funders Author Manuscripts
by immunoblotting using anti-FLAG and anti-macroH2A1.1 antibodies. H3 was used as loading control.
(c) A panel of 5 differentially expressed genes were analyzed in the same myotube samples shown in (b) by RT-qPCR (n=3 independent siRNA transfection experiments using the same stable cell lines; *p<0,05).
Europe PMC Funders Author Manuscripts
Figure 5. The binding pocket of macroH2A1.1 is required for mitochondrial activity, binding of PARP-1 and its inhibition.
(a) Maximal mitochondrial capacity of cells expressing epitope tagged wild-type (WT) and G224E mutant macroH2A1.1 (mH2A1.1) and transfected with macroH2A1.1 siRNA was assessed by measuring the oxygen consumption rate (OCR) as in Figure 3a using the same cells as shown in Figure 4c and d. Data is represented as mean + s.d. relative to si Ctrl-treated cells set to 1 (n = 6 independent experiments; *p<0,05).
(b) Immunoblots of input and anti-GFP immunoprecipitates (IP) from transfected HEK293T cells expressing fusion proteins of GFP and macrodomains using indicated antibodies.
Europe PMC Funders Author Manuscripts
(c) PARP-1 activity was assessed by its in vitro auto-PARylation capacity in the presence of increasing concentrations (1, 10, 25 and 50 μM) of His-tagged mH2A1.1 WT and G224E mutant macrodomain followed by anti-PAR immunoblotting and naphtol blue staining. (d) FLAG-tagged wild-type (WT) and G224E mutant macroH2A1.1 were expressed in C2C12 cells. Anti-FLAG immunoprecipitates (IP) were analyzed by immunoblotting using indicated antibodies.
(e) HepG2 cells double knock-down for macroH2A1 and macroH2A2 (DKD) expressing exogenous YFP-tagged WT and G224E mutant macroH2A1.1 were H2O2 treated (0.1 mM, 10 min) and analyzed by anti-PAR immunostaining (shown in color scale), YFP
autofluorescence and DAPI counterstaining. The boxplot on the right shows quantification the mean nuclear PAR signal in arbitrary units (AU). Each dot represents the measurement of an individual cell (*p<0,05, Wilcoxon test). The box represents the 25-75th percentiles, and the median is indicated with a bar. The whiskers show the highest and lowest data point within the 1.5 IQR of the upper and lower quartile, respectively. Overall expression levels of WT and G224E mutant protein are shown in Figure 3f, lanes 3 and 4, respectively.
Europe PMC Funders Author Manuscripts
Figure 6. Inhibition of PARP-1 rescues the mitochondrial phenotype.
(a) Nuclear PARPs are expressed in differentiated myotubes. mRNA levels of PARP-1 and PARP-2 were analyzed in proliferating myoblasts in growth medium (GM) and
differentiated myotubes after 4 days in differentiation medium (DM). Data is presented as mean + s.d. of 4 independent differentiation experiments (*p<0.05).
(b) Western blot with the indicated antibodies of C2C12 cells grown under the same conditions as in (a).
(c) Comparison of the Western blot signal of PARP-1 and macroH2A1.1 in differentiated C2C12 cells (DM) to equal amounts of purified reference proteins. Full-length PARP-1 and His-tagged macroH2A1.1 macro domain was used. Uncropped blot images of (b) and (c) are shown in Supplementary Data Set 1.
(d) The NAD+ levels in myoblasts but not myotubes are sensitive to PARP inhibition. Proliferating (GM) and differentiated C2C12 cells (DM) were treated with 100 nM PARP inhibitor ABT-888. Data is presented as mean + s.d. of 4 independent experiments (untreated set to 1; *p<0.05).
(g) Rescue of mitochondrial activity by genetic and pharmacologic PARP inhibition. Maximal respiratory capacity in fatty acid primed C2C12 cells treated with siRNA for 4 days and was rescued by co-administration of 100 nM PARP inhibitor ABT-888 for 16 hours (left panel) or co-transfection of PARP-1 siRNA (right panel). Data is mean + s.d. (n=6 independent experiments; *p<0.05) and si Ctrl cells treated or not with DMSO vehicle (left and right panel, respectively) were set to 100%.
(h) Same conditions as in (g) but mitochondria were isolated prior to the analysis of respiration.
Europe PMC Funders Author Manuscripts
Figure 7. The influence of macroH2A1.1 on mitochondrial function is mediated by the NAD+ precursor NMN.
(a) Schematic representation of the NAD+ salvage pathway and its reported compartmentalization.
(b) The level of mRNA encoding the enzymes of the NAD+ salvage pathway was analyzed by RT-qPCR in proliferating (GM) and differentiated C2C12 cells (DM, day 4) treated with si macroH2A1.1 or control. Data is mean + s.d and mRNA levels in differentiated control cells were set to 1 (n=4 independent experiments; * = p<0,05). The reported main localization of the encoded enzymes is indicated.
(c) Quantification of the metabolites of the NAD+-salvage pathway by LC-MS/MS in proliferating (GM) and differentiated C2C12 cells (DM, day 4) treated with or without si macroH2A1.1. Data is mean + s.d. of 4 independent experiments (*p<0.05).
(d) Quantification of the metabolites mitochondria isolated from C2C12 myotubes at 4 day of differentiation treated with si macroH2A1.1 or control si RNA (Ctrl). Data was
normalized for mitochondrial NDUFA9 protein levels and is represented as mean + s.d. of 4 independent experiments (* = p<0,05).
(e) NMN rescues mitochondrial capacity. Using fatty acid oxidation assay, the maximal respiratory capacity in fatty acid primed C2C12 cells treated with siRNAs and 500 nM NMN for 24 hours was analyzed at day 4 of differentiation. Data is represented as mean + s.d. of 6 independent experiments (*p<0.05).
(f) Same conditions as in (e) but mitochondria were isolated prior to the analysis of respiration.
(g) Schematic summary of our results showing how NMN links nuclear PARP-1 inhibition by macroH2A1.1 to the maintenance of the mitochondrial NAD+ pool.