Applying Lean Manufacturing Initiatives to Naval Ship Repair Centers Implementation and Lessons Learned
by
Brian P. Murphy
Naval Engineer Degree M.S. Mechanical Engineering Massachusetts Institute of Technology, 2000
B.S. Mechanical Engineering Technology B.S. Energy Engineering Technology Rochester Institute of Technology, 1989
Submitted to the Department of Ocean Engineering in partial fulfillment of the requirements for the degree of
Master of Science in Ocean Systems Management
at the
Massachusetts Institute of Technology
February 2004
MASSACHUSETTS INST E
OF TECHNOLOGY
SEP 0 1 2005
LIBRARIES
©2004 Brian P. Murphy. All rights reserved.
The author hereby grants to MIT permission to reproduce and to distribute publicly paper and electronic copies of this thesis document in whole or in part.
Signature of Author... ... ... g I ' " ' ' .... ... . . . . Depart'dnt of Ocean Engineering
January 16, 2004
Certified
by ...
..
.V. ,-'. ... Henry S. Marcus
. n -\
A'Professor of Marine Systems Thesis Supervisor
Accepted by ... . .. ..
--
... Michael Triantafyllou Chairman, Department Committee on Graduate StudiesARCHIVES
-Applying Lean Manufacturing Initiatives to Naval Ship Repair Centers-Implementation and Lessons Learned
by
Brian P. Murphy
Submitted to the Department of Ocean Engineering in partial fulfillment of the requirements for the degree of
Master of Science in Ocean Systems Management
Abstract
The United States Navy is under pressure to reduce the cost of fleet maintenance in order to redirect funds for the construction of new ships and submarines. The Navy looks to private industry for process improvement ideas such as the Theory of Constraints, Six Sigma and Lean Manufacturing Principles.
This thesis examines the Lean Manufacturing movement in the private sector of ship repair and how it eventually came to government owned ship repair operations. Recent National
Ship Research Program (NSRP) initiatives provide shipyards a strategy of how to select areas of an operation for Lean improvements. The Norfolk Naval Shipyard method is a combination of the Theory of Constraints, Six Sigma and Lean Principles called Lean Sigma.
The Lean Sigma methodology for planning, executing and sustaining lean improvement and how to measure success with various metrics is presented. Lean Sigma is implemented into the Electric Motor Rewind and Repair Center as a case study. Before and after assessments, lessons learned, and recommendations from the implementation case study are presented. Details of the challenges and pitfalls encountered during the Lean Sigma implementation in the areas of culture, budget, management, metrics and cost benefit measurement, are described throughout the test case. In conclusions key elements for successful Lean transformation and a vision for the future Lean Ship Repair Enterprise are presented.
Author's Biographical Information
LCDR Murphy enlisted in the Navy's Nuclear Power program in his senior year at Kenmore East Senior High School, Tonawanda, NY in 1981. Qualifying in submarines and
advancing to Machinist Mate Second Class (MM2 (SS)) aboard the USS Bremerton (SSN 698) out of Pearl Harbor, HI, he qualified in all mechanical operator watches up through Engineering Watch Supervisor (EWS) and Leading Engineering Laboratory Technician.
He was released to the NROTC program at Rochester Institute of Technology in NY for undergraduate education, completing bachelor's degrees in Mechanical Engineering and Energy Engineering with honors. He was commissioned as an Ensign in 1989.
LCDR Murphy returned to the submarine force, attending the Nuclear Power and Submarine Officer Training Pipeline, then serving aboard the USS George C. Marshall
(SSBN 654) as Chemistry and Radiological Controls Assistant and Electrical Division Officer, conducting patrols out of Groton, CT and Holy Loch, Scotland. After conning
Marshall from Groton through the Panama Canal and north to Puget Sound Naval Shipyard
(PSNS) for inactivation and decommissioning, he transferred to the USS George Washington
Carver (SSBN 656) and served as the Main Propulsion Assistant during operations as an
attack submarine out of Bangor, WA. Carver was eventually ordered to decommission at PSNS where LCDR Murphy served as Defueling Engineering Officer of the Watch and Ship's Duty Officer, and completed Nuclear Engineer qualification.
LCDR Murphy's next assignment was at the Nuclear Power Training Unit, Ballston Spa, NY, where he served as Operations Officer, Shift Engineer and Instructor at the Dl G Prototype Plant. After Instructor Duty, he reported to the Precommissioning Unit Louisiana (SSBN 743) serving on as Damage Control Assistant, Quality Assurance Officer, Ship Safety Officer, Initial Criticality Coordinator and Shipyard Liaison Officer at Electric Boat, Groton, CT. The last of the Tridents, USS Louisiana (SSBN 743) was commissioned in September
1997.
In May 1997, LCDR Murphy joined the Engineering Duty Officer community and reported to the Massachusetts Institute of Technology's Ocean Engineering Department for graduate studies. He achieved the degrees of Naval Engineer and Masters in Mechanical Engineering in the class of 2000. His thesis topic was "Methodology for Implementation of Automation Systems to Reduce Manning of Ships." Following postgraduate studies, LCDR Murphy reported tlo Naval Diving and Salvage Training Center for Basic Diving Officer and Salvage Officer Class where he was the class leader and Salvage Officer Honorman.
LCDR Murphy has been assigned to Norfolk Naval Shipyard (NNSY) since March of 2,001 serving as an Assistant Project Superintendent on USS Boise (SSN 764) and USS
Montpelier (SSN 765) Docking Selective Restricted Availabilities (SRA), then serving as
Project Superintendent for the USS Hampton (SSN 767) docking SRA and the USS
Jacksonville (SSN 699) Interim Dry-docking (IDD). He is currently the NNSY Regional
Maintenance Officer responsible for submarine and surface ship depot level maintenance conducted at the Naval Base during restricted, technical and voyage repair availabilities assigned by the Type Commanders and for Regional Repair Center (RRC) operations of the Mid Atlantic Regional Maintenance Center (MARMC)
LCDR Murphy's special qualifications include Submarine Project Superintendent, Diving and Salvage Officer, Nuclear Engineer, Engineering Duty Officer, Submarine Warfare Officer, underway Officer of the Deck, Engineering Officer of the Watch and Submarine Duty Officer. He is a licensed Professional Engineer in the Mechanical Engineering field.
Acknowledgements
This thesis would not have been possible without the support and the expert assistance of the Process Improvement Team, Code 2390, at Norfolk Naval Shipyard. They are effecting a lean transformation at the shipyard, one individual at a time. I want to specifically thank the Civilian Managers, Mr. Jim Tice and Mr. Mike Johnson in the Mid Atlantic Regional Repair Centers for encouraging me to pursue this work. Thanks to the men and women who work in the Motor Rewind and Repair shop for sharing their knowledge and opinions and for participating in the lean improvement workshops.
I wish to thank Professor Henry Marcus, for his continuing support as my professor, advisor and mentor in Ocean Systems Management, whenever asked.
And finally it is appropriate to thank the United States Navy for the professionally and personally enriching opportunities given and their support throughout my career.
To The Mid Atlantic Regional Repair Center
of Norfolk, Virginia
Camnbridge,
Massachusetts, January, 2004
Table of Contents
Abstract ... 2
Author's Biographical Information ... 4
Table of Contents ... 6
List of Figures ... 7
1 Introduction ... 9
1.1 Factors M otivating the US Navy Repair Community to Change ... 9
1.2 The Goal - to Create a Lean Ship Repair Enterprise ... 10
1.3 National Shipbuilding Research Program (NSRP) Initiatives ... 10
1.4 Overview of the Approach Used in this Thesis ... 11
2 Naval Ship Regional Repair Centers (RRC) Background ... 12
2.1 Planning ...12
2.2 Assist Shops ... 12
2.3 RRC Process Outline ... 12
2.4 W ork Ordering and Execution Processes ... 13
2.5 Current Business Challenges of the RRCs ... 14
3 Background Theory ... 17
3.1 Theory of Constraints (TOC) ... 17
3.3 Lean M anufacturing ... 19
3.4 Six Sigma Background ...21
4 The "Lean Sigma" Methodology - A combination of techniques . ...23
4.1 Define ... 24 4.2 Commit ... 25 4.3 Characterize ...26 4.4 Improve ... 27 4.5 Implement ...28 4.6 Closure ...29
5 Measures of Effectiveness (MOEs) and other Metrics ... 31
5.1 Importance of M etrics ... 31
5.2 M id-Atlantic Regional M aintenance M OEs ... 32
:5.3 Specific Definitions of Each M etric ... 33
5.3.2 Regional Approved Metrics ... 33
5.3.3 Mid-Atlantic Selected Metrics Description ... 34
6 Test Case in the Electric Motor Regional Repair Center ... 36
6.1 Custom er Focus ... 37
6.2 Electric Motor Repair Organization, Capacity and Capability ... 38
6.3 Value Stream Map (VSM) Creation ... 39
6.4 Lean Improvement Workshop Execution ...41
6.4.1 Observations and Brainstorming Results ...43
6.4.2 Applying The Five Ss of Lean Manufacturing ... 45
6.5 Results: Both Tangible and Intangible ...47
6.5.1 W aste Reduction Results ...48
6.5.2 Value Stream Improvement ...49
6.6 Capital Investm ent A nalysis ...50
7 Conclusions ... 52
7.1 Organizational History, Cultural and Policy Barriers ...52
7.2 Lessons Learned ...54
7.2.1 Change Management in Lean Sigma Implementation ... 55
7.3 Requirements for Long Term Success ...55
7.4 Future Application to Other Repair Centers ... 56
7.4.1 Vision - Lean Ship Repair Enterprise ... 56
8 Glossary ... 57
9 References ... 58
List of Figures Figure 1 Repair Centers Functional Description ... 14
Figure 2 Repair Center Manning Table ... 15
Figure 3 Fiscal Year 2002 Expenditures by Repair Center ... 16
Figure 4 Six Sigma Graphical Representation ...22
Figure 5 Block Diagram of the Lean Sigma Method ...24
Figure 6 Continuous Process Improvement ... 30
Figure 7 Reactionary Process Improvement ... 30
Figure 8 Motor Repair Shop Turn Around Time (TAT) ... 36 7
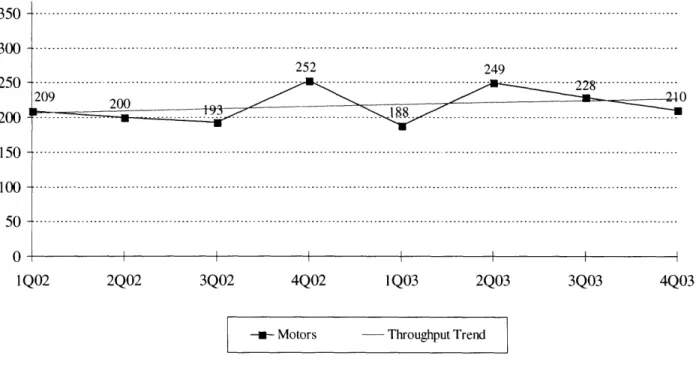
Figure 9 Motor Repair Shop Throughput ...37
Figure 10 Motor Repair Shop Contract Cost (x 1,000) ...37
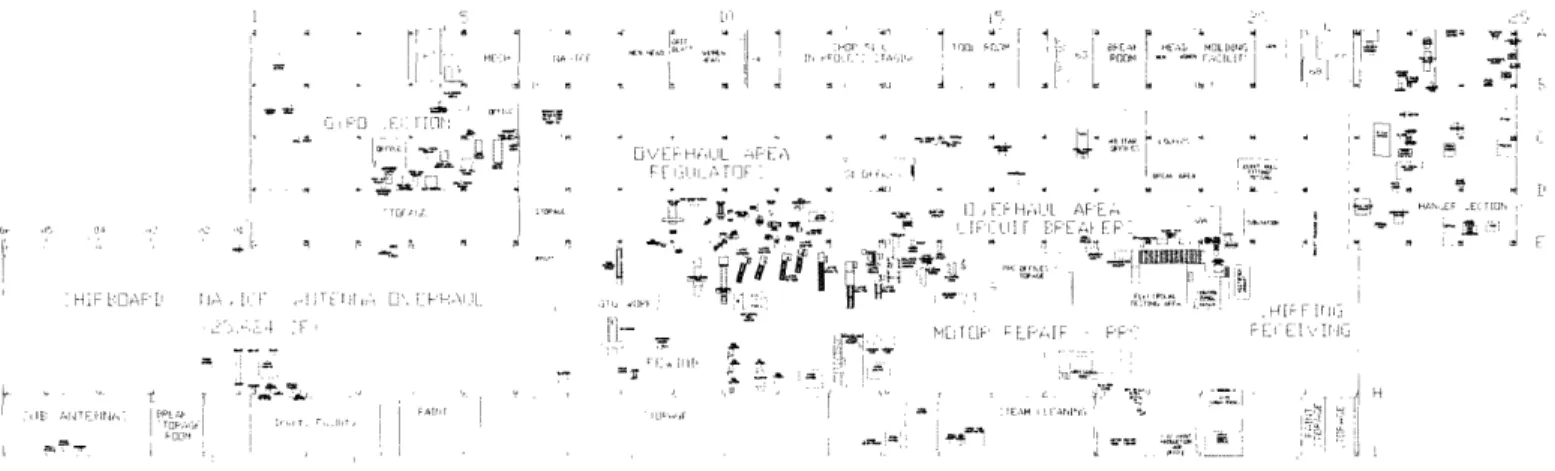
Figure 11 Motor Rewind and Repair Floor Layout ...39
Figure 12 Motor Repair Value Stream Map-Current State ...40
Figure 13 Legend of Symbols for Value Stream Map ... 41
Figure 14 The Four Phases of Executing a Lean Improvement Workshop ... 42
Figure 15 Brainstorming: Problems and Potential Solutions List ...44
Figure 16 Comparison of Before and After Motor Repair Shop LIW ... 47
Figure 17 Monthly Labor Savings from Eliminated NVA Steps ... 49
1 Introduction
1.1 Factors Motivating the US Navy Repair Community to Change
The United States Navy is under pressure to reduce the cost of fleet maintenance in order to make the savings available to fund the construction of new ships and submarines. The current budgeted new ship build rate has not sustained the goal of maintaining a 300-ship navy. As a result of President Reagan's drive toward a 15 carrier, "600 Ship Navy" during the eight years of his administration, by the time he left office in January 1989, the Navy had become a 15-carrier Navy of 594 ships deployed around the world. The total ship count has dipped to 12-carriers in a 295 ship Navy today in spite of government defense reviews that suggest 300 is the minimum to sustain our Navy's mission statement.
The Navy is also going through a period of significant operational change from a rotationally deployed Navy to a "surge on demand" capable Navy. The surge Navy must be able to deploy forces in different combinations of ships and on different timelines to meet fairly unpredictable threats. This rapid surge was experienced during Operation Iraqi
Freedom when 70% of all U.S. naval forces were rapidly deployed.
The Naval Sea Systems Command (NAVSEA) is the largest of the Navy's five major acquisition and fleet support organizations, managing nearly one-fifth the service's annual budget, or almost $20 billion annually to fund ship repair, modernization and new
construction. NAVSEA is transitioning to a new business model to better serve the rapidly evolving fleet; to strengthen relationships with industry, and to devise improved methods to fund the construction of new ships with a limited budget.
NAVSEA has high expectations that process improvement initiatives within its maintenance organizations will provide for the redirection of maintenance savings into new ship construction, and also provide increased repair capacity to support a surge force for action when called upon. NAVSEA must become more efficient to sustain the fleet for the on-going war on terrorism, and to build and refurbish this force for the future.
NAVSEA looks to private industry for process improvement ideas that have been successfully implemented. This "tool box" contains initiatives such as Vision and Mission Development, Change Management, Assessment Models, Value Stream Analysis,
Brainstorming, Win/Win Agreements, Prioritization, the 5 Why's, the Theory of Constraints, Pull Systems, Root Cause Analysis, Supply Chain Management, Critical Chain Project
Management, 7 Management & Planning Tools, Capacity Analysis, Takt Charts, Process and Data Analysis Tools, Six Sigma and Lean Manufacturing Principles.
1.2 The Goal - to Create a Lean Ship Repair Enterprise
The NAVSEA leadership wants to create a Lean Ship Repair Enterprise. Although NAVSEA is a government organization, private industry processes and corporate strategies can provide significant advantages to the government. Instead of a drive to increase profit margin through improvement initiatives, the Navy strives to increase maintenance capacity, and to redirect maintenance savings into new ship construction. The largest sector of the NAVSEA organization is the Naval Shipyards at Pearl Harbor, HI, Puget Sound, WA, Portsmouth, NH, and Norfolk, VA. The leadership wants to effect a lean transformation of our Naval Shipyards, with the desired outcome being a commitment to Lean as a business strategy to improve shipyard performance in both the short and long term view.
Lean history over the past several years has been that each shipyard is learning and
doing Lean "proof-of-concept" activities with varying strategies and pace. Resultant improvements have been mostly localized successes.
The Norfolk Naval Shipyard (NNSY), as a unique government facility of NAVSEA, has combined the basic principles of the Theory of Constraints, Lean Manufacturing and Six Sigma into a methodology called "Lean Sigma". Lean Sigma considers the differences in culture and processes between a profit driven private shipyard and a government operated shipyard. This thesis applies the Lean Sigma approach to the Electric Motor Repair Center as a test case and provides an adjusted methodology with the lessons learned and
recommendations for applying the technique to other government job shop facilities.
Expectations are that Lean improvements will rapidly improve shipyard performance, promote collaboration, standardization and alignment of other improvement initiatives and eventually provide a comprehensive, long-term, improvement methodology.
1.3 National Shipbuilding Research Program (NSRP) Initiatives
Lean Implementation is ongoing in the Naval Ship Industry to varying degrees at companies like Northrop Grumman Newport News, Avondale, Ingalls, General Dynamics Electric Boat, Bath Iron Works, NASSCO, Todd Pacific, and Atlantic Marine.
The NSRP sponsored a Lean Enterprise Project. The participants (Todd Pacific Shipyards, Atlantic Marine, and Puget Sound Naval Shipyard) have developed models for the
application of lean manufacturing concepts to multiple market segments of the U.S. shipbuilding and ship repair industry. In October 2003, the NSRP team presented their experiences in
developing an "ideal" model for lean ship repair and some methods or approaches for transition to a lean ship repair environment. NNSY has developed and continues to improve their Lean Sigma implementation method while sharing experiences with the NSRP team.
1.4 Overview of the Approach Used in this Thesis
This thesis describes a methodology for implementing a lean transformation.
This thesis highlights a specific implementation, the methodology used and the key aspects of the improvements that are applicable to other job shop environments. The research for this thesis was completed at Regional Repair Centers (RRC) of the Mid-Atlantic Regional Maintenance Center, a US Atlantic Fleet maintenance consortium. The RRCs are job shop type facilities handling low volumes of varied components. The strategic goal of the project was to improve ship repair operations by focusing on more throughput and shorter cycle time while minimizing cost.
Chapter 1 of this thesis presents the motivation and history behind the US Navy's entry into the Lean Ship Repair enterprise.
Chapter 2 of this thesis describes the background of the Motor Rewind and Repair shop and the specific nature of the shop that lends itself to an implementation of Lean.
Chapter 3 provides background discussion on the Theory of Constraints, lean manufacturing and six sigma and provides a framework for utilizing a combination of them (called Lean Sigma) in a job shop repair setting.
Chapter 4 of this thesis describes the methodology for implementing Lean Sigma in a job shop repair environment.
Chapter 5 of this thesis describes Measures of Effectiveness and other metrics and their relative importance to the success of Lean improvement.
Chapter 6 describes the test case implementation and results in the Motor Repair Center; and some of the barriers to implementing Lean Sigma in a traditional ship repair environment, including technical, cultural and organizational issues. The specific issues confronted in this implementation are detailed and suggestions on dealing with these issues are presented.
Chapter 7 evaluates the Lean Sigma process and summarizes the lessons learned. The recommendations for successful implementation of future Lean Sigma workshops are presented. Many acronyms are used in this thesis and are described in detail in the text. If used more than once the acronyms are also included in a glossary at the end of the thesis.
2 Naval Ship Regional Repair Centers (RRC) Background
The RRCs of the Mid-Atlantic Regional Maintenance Center (MA-RMC)
are consolidated job shops. They were created in 1999, by combining redundant U.S. Navy repair capabilities in the region, from multiple locations into a single shop. The RRCs were designed to eliminate redundancy of capability and capacity. By reducing excess infrastructure, integrating military and civilian personnel, and streamlining the administrative processes, a greater
percentage of each maintenance dollar can be used to accomplish productive maintenance. Evaluating the RRCs for lean process improvements is essential in today's geopolitical environment.
2. Planning
RRC work does not normally allow for advanced planning. As a result, authorization to perform work and required funding must be in place prior to knowing what work is to be performed. This allows production to start work upon the customer's request without administrative delays. The automated issuance of a job order to the Production Manager is authorization by the RRC Business Operations Office to perform work.
2.2 Assist Shops
Each RRC has a specified production focus. To complete a repair from cradle to grave, other RRCs must be utilized for processes outside of the shop floor. The term "assist shop" is used to describe this arrangement. The senior Production Manager, or designated representative, is the single point of contact for execution of work and is responsible to identify the need and request all assist shops required. The funded job order will normally acknowledge all potential assist shops necessary to receive temporary funding. Assist shops include, but are not limited to, other production, quality assurance, and engineering. In addition, the Production Manager is responsible to obtain all assist shop estimates and provide funding once the decision is made by the manager that the estimated hours are acceptable.
2.3 RRC Process Outline
The RRCs introduce functional and technical complexity into the implementation. The RRCs are a joint line of business between the Ship Intermediate Maintenance Activity (SIMA), and Norfolk Naval Shipyard (NNSY). They couple the knowledge and experience of the long standing civilian shipyard tradesman and the SIMA sailors by working side by side. The RRCs
being of the Shipyard have the authority to work depot level repairs for the items they are
designated. Being of SIMA, the sailors gain experience and knowledge by working a larger depth and breadth of repairs not normally conducted at the Intermediate level.
2.4 Work Ordering and Execution Processes
The RRCs receive work requests from three different sources. Work is sent to them via SIMA Norfolk like any other SIMA Work Center. The RRCs also receive work from the
Shipyard for work that is for a ship in a Chief of Naval Operations (CNO) availability, at Norfolk Naval Shipyard. The remainder of work is given to them from the Naval Inventory Control Point (NAVICP), to refurbish material to be put back in inventory in the Naval Supply System.
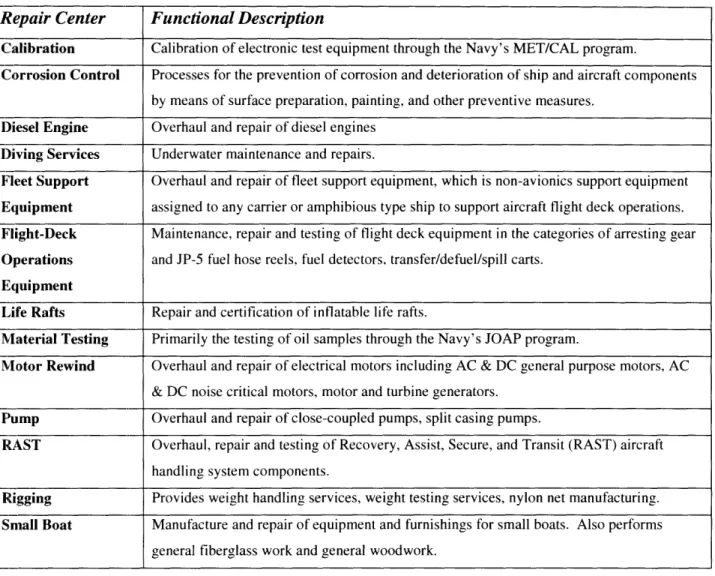
Business processes exist at these activities for: brokering, planning, scheduling, execution of work, accumulation of equipment history, inspections, status accounting, progressing, Human Resources, material procurement and handling. Functionally this means that for work identified from the ship an RRC will be notified that this work has been assigned to them. All of the planning for the maintenance order will occur in detailing the tasks and operations to be performed. There are thirteen RRCs located at both Norfolk Naval Shipyard and the Norfolk Naval Base 12 miles to the north. Figure 1 describes their functions, and Figure 2 describes their manpower. The first four are at the Naval Station, Norfolk waterfront, and the rest are within the industrial boundaries of Norfolk Naval Shipyard. The combined monetary resources expended per year are $58.8 Million, to provide service to a large customer base.
Figure 1 Repair Centers Functional Description
2.5 Current Business Challenges of the RRCs
There are currently 2 major categories of work being accomplished in the RRCs. The RRCs work on equipment that is dismantled from a ship and is to be reinstalled, and they refurbish material either for Rotatable Pool capabilities or Refurbish Material to be placed back into an inventory such as NAVICP or specialized inventories such as Carper assets.
Most shops, as in SIMA, have a small inventory of Rotatable Pool assets or ready for issue materials they have refurbished. These are items that have been pulled from Decommissioned ships or OEM supplied inventories as part of the procurement process. The rotatable pool process is a critical success factor in being able to turn high priority work around in a timely manor. The rotatable pool process relies on refurbishment orders to correctly identify the object of the order. Repair Center Functional Description
Calibration Calibration of electronic test equipment through the Navy's MET/CAL program.
Corrosion Control Processes for the prevention of corrosion and deterioration of ship and aircraft components by means of surface preparation, painting, and other preventive measures.
I)iesel Engine Overhaul and repair of diesel engines
I)iving Services Underwater maintenance and repairs.
Fleet Support Overhaul and repair of fleet support equipment, which is non-avionics support equipment
Equipment assigned to any carrier or amphibious type ship to support aircraft flight deck operations.
Flight-Deck Maintenance, repair and testing of flight deck equipment in the categories of arresting gear
Operations and JP-5 fuel hose reels, fuel detectors. transfer/defuel/spill carts.
Equipment
Life Rafts Repair and certification of inflatable life rafts.
Material Testing Primarily the testing of oil samples through the Navy's JOAP program.
Motor Rewind Overhaul and repair of electrical motors including AC & DC general purpose motors, AC
& DC noise critical motors, motor and turbine generators. Pump Overhaul and repair of close-coupled pumps, split casing pumps.
RAST Overhaul, repair and testing of Recovery, Assist, Secure, and Transit (RAST) aircraft handling system components.
Rigging Provides weight handling services, weight testing services, nylon net manufacturing.
Small Boat Manufacture and repair of equipment and furnishings for small boats. Also performs general fiberglass work and general woodwork.
The object of a refurbishment order is a material that arrives in inventory in a less than optimal condition and is returned to inventory in a rotatable or ready for issue valuation. These rotatable assets are then held in inventory waiting for the next time critical job needing that item. Flight Deck Operations RRC is a prime example of this type of process.
Customer Self Help
Regional Repair Center-Employee Count Civilian Military in Shop Contractor
(CC) Corrossion Control 0 30 0 0
(DE) Diesel Engine Repair 10 38 0 0
(DV) Diving 25 76 0 0
(FOE) Flight Deck Ops. Equip.(fuel handling) 0 7 0 0
(FSE) Fleet Support Equip. 0 5 110 70
(LR) Liferafts 8 1 0 0
(MR) Motor Repair 28 0 0
(PUP) Pump Repair (ship to shop) 43 26 0 0
(PUG) Pump Repair ( water front) 19 0 0
(RA) Rast 1 28 0 0
(RS) Rigging Services 14 0 0
(SB) Small Boat Repair, Wood Working, Fiberglass 6 82 20 0
Totals 154 293 130 70
Total Labor Force 647
Figure 2 Repair Center Manning Table
Another flavor of refurbishment is where NAVICP feeds items to be refurbished to the shops to be accomplished as time permits. This work is reimbursable, much like the repair of a non-navy ship would be.
The Pump shop in particular is problematic in the nature of their work. They are the third work center to get the pump after it has been dismantled and rigged off the ship. They have to
disassemble the pump to assess root cause of problems. At this point, shop reports are filed to order additional parts, and a true assessment as to the nature of the repair is made. This leaves little time for parts to be bought and shipped, the repair to be made, and the pump and motor to be reassembled, balanced, and reinstalled for testing. This process also does not lend to ordering the parts ahead of time efficiently or projecting an accurate planned cost of the work. Rules of thumb need to be developed for average costs to be budgeted by type of pump to estimate the costs that will be incurred because little material can be planned in a task list for this type of work. The pump and the motor RRCs are the largest work centers and have large volumes of work at any
one period of time. Being that the work is already time critical, any process delays such as fiunding or material routing mistakes are amplified.
FY-02 EXpenditures by Regional Repair Center
Calibration Corrosion Control Diesel Diving Fleet Support Flightdeck U Liferaft Material Lab Motor Rewind Pumps RAST Rigging Small Boat -~~~~~~~~~~~~~~~~~~~~~~~~~~~~~~ -{r
-~~~~~~~~~~~
_
I
l
I - - - -~ ~ ~ -- ---I II $2,000,000 $4,000,000 $6,000,000 $8,000,000 $10,000,000 $12,000,000 $14,000,000 $16,000,000 Expenditures ($K)* AIRLANT, Active * AIRLANT, Active, N42 * SUBLANT, Active
* SURFLANT, Active, N42 * SURFLANT, Active, N75 SURFLANT, Active, N76 SURFLANT, Reserve, N75 * SURFLANT, Reserve, N76 [ OPW
Figure 3 Fiscal Year 2002 Expenditures by Repair Center
There are thirteen repair centers in all, and the goal is to implement Lean Sigma in all of them. The motor repair center was chosen as a good test case due to the manageable scope of a lean analysis of its reasonable shop flow. Strategically, its relative importance as the shop with the second largest volume of work could result in a visible victory, to get organizational buy-in
3 Background Theory
Increased competition between various types of manufacturing companies in the last few decades has brought about several manufacturing concepts including, Theory of Constraints (TOC), Lean Manufacturing, and Six Sigma. The overall goal of these production systems is to increase organizational effectiveness through cost efficiency and increased profits. Although these systems differ on the approach, the underlying concept remains the same: Produce the necessary product when customers need it without unnecessary investments in capital, people or inventory. These concepts are all based on fundamental operations management science.
Naval ship repair facilities that are owned and operated by the government are obviously not operating with profit as a goal. The motivation is to get more maintenance accomplished for
the same budget. Efficiencies are expected to reduce cycle time so naval units receive an overhauled motor quicker with a resultant benefit of more ship operational time available. This means an increased throughput or capacity to meet emergent work demands. To recap, the government owned and operated repair center goals are reduced maintenance time resulting in additional operational time for ships, increased capacity for additional maintenance that may be necessary in times of conflict, as well as maintenance savings that can be redirected to building new ships.
Other Benefits of Efficiency gains are improved customer satisfaction, improved safety, increased capacity, shortened cycle time, improved flexibility, reduced cost, and improved space utilization.
3.1 Theory of Constraints (TOC)
Theory of Constraints is a proven management philosophy for project management, manufacturing or integrating both together with a focus of increasing throughput of an
organization. Traditional project management concepts have been around for over thirty years. Early studies noted that for Department of Defense projects, cost and schedule overruns were often two to three times the initial estimates and that project durations were frequently 40 to 50 percent greater than the original estimates. The manufacturing as well as repair and overhaul business has stimulated introduction of many management philosophies that have attempted to provide managers the ability to look at the right information at the right time to make the best decisions. All try to maximize shop performance, to meet schedule, quality and cost goals.
Critical Path Method (CPM) -based project management was introduced as a solution for performance problems with a goal of delivering projects within the original cost and time
estimates. CPM fails to provide the improved performance partially because of the way the performance of projects and managers are measured. In today's Project Management
environment, the Critical Path (longest series of dependent tasks to achieve the shortest duration) does not take into consideration resources and the continuous conflict for those resources. At the same time, management measures concurrent and dependent projects and commodities, which should be integrated, as discreet parts each striving to meet established individual performance
measures leading to significant sub-optimization of production capabilities.
TOC emerged from the shop floor. The Drum-Buffer-Rope Methodology is a shop floor planning algorithm that plans and schedules, focusing on maximizing the performance of the constrained resource, using buffer management to ensure effective control to achieve maximum throughput. The basis for the concept lies in normal statistical variation, or an acceptance and accommodation that "Murphy" will strike. If the planning and execution processes do not
properly allow for Murphy along with a measurement system, which allows local decisions to be measured against the global goal, then sub-optimization will be the norm.
In 1997, Dr. Eliyahu Goldratt introduced the first significant new approach to project management that addresses both the human side and the algorithmic methodology side of project management in a unified discipline called Critical Chain. Using Critical Chain Project
Management projects are completed in significantly shorter time than traditional CPM techniques. Of significance is that Critical Chain project management is also simpler to use and requires less work for the project team in both the planning and tracking phases of projects.
The Theory of Constraints is a holistic management philosophy that applies to running and improving organizations. It views every organization with three fundamental assumptions: that every system has a goal and a necessary set of conditions. That every system is more that the sum
of its parts. That very few variables limit the performance of the system at any given time. TOC is most appropriate to the Regional Maintenance environment because it supports NAVSEA requirement to srignificantly improve on:
1. Throughput of commodities and end items 2. Net Operating Revenue
3. Reduce Cycle Time
4. Reduce Inventory and increase inventory turns 5. Due Date Performance (Schedules)
6. Better meet and respond to customer's needs TOC uses five (5)-focusing steps:
1. Identify the Constraint ... the single weak link ...be it a machine, labor, supplier, market or policy/procedure.
2. Exploit the Constraint ... never let the constraint be idle ...ensure maximum production through the constrained resource.
3. Subordinate to the Constraint ... ensures flow of all other resources is based on the constraint.
4. Elevate the Constraint ... if additional capacity is required to meet the goal ... elevate the need of the constraint.
5. Return to step 1 ... don't let inertia take over ... continue to review and find the new constraint.
Theory of Constraints addresses "exploitation of constraints" and "subordination to constraints" as necessary elements for properly managing daily activities of the organization. Exploitation means ensuring the weakest links in the organization are fully utilized and meet the goal of the organization as a whole. Subordination means to design the processes throughout the organization so every process supports the exploitation in the best way possible. Under
Subordination every process has a clear objective that can be translated into measurements and support the exploitation.
Theory of Constraints is a powerful management philosophy that has been utilized by the private sectors for years and only recently it has been incorporated into Navy activities. A great example is at the Naval Aviation Depot Cherry Point, NC. The results have been realized quickly
and they are impressive. The successful training and lean implementation last year on the H-46 helicopter rework line has resulted in the recent improvements on the H-53 helicopter line.
Today, the Fleet Commanders are having their aircraft, which undergo intensive and individually developed rework and modification, returned to service 30% faster with extremely few quality defects, in addition to the fact they have about half as many out of service at any given time. The net result is faster, better, cheaper and increased availability of assets.
3.3 Lean Manufacturing
The Lean Manufacturing system that was developed by Taiichi Ono at Toyota has come to be understood as a combination of production methods that improve competitiveness through
reduced manufacturing costs. "The main purpose of the system is to eliminate through improvement activities various kinds of waste lying concealed within a company" (Monden, 1997). Eliminating waste in manufacturing processes translates into reduced costs, and thus increasing profits. Several techniques have been used to manage the elimination of waste.
The theory behind just in time production is to produce only what is needed when it is needed in the quantities needed. The Toyota Production System achieves just in time production through eliminating excessive production resources, overproduction, excessive inventory and
unnecessary capital investment. (Monden, 1997)
Heijunka (Production Leveling) implies that eliminating inter-process variability smoothes
the production demands, and the amount of inventory and excess capacity necessary to sustain the desired service levels will be reduced. The concept of smoothed production requires that each
type of product be produced at the average demand rate. To achieve this, flexible types of machinery with optimized setup times must be in place. This will result in the ability to shift to changes in the market demands, a balance between processes and increased ability to introduce
ne w products.
The Japanese term kaizen literally means, "change for the better." By continuously examining the current production methods and eliminating waste, "the levels of quality, lead time and cost reduction can be improved" (Monden, 1997). A continuous cleanup activity within an organization with strong management support can be an extremely powerful tool both for improving operations and increasing the effectiveness of the employees. By capturing every employee's creativity and knowledge, an organization can target waste in the business processes and eliminate them on a continuous basis.
Lean manufacturing is the elimination of excess productive capacity. In a high volume production environment, it is possible to balance the production tasks of line employees to minimize the idle time. Where each task is timed and matched to the cycle time of the process to enable a level production schedule. Achieving balanced flow requires the elimination of inter-process variability to ensure constant production rates. Large fluctuations in inter-processing times create excessive disturbances in the production schedules. Lean manufacturing suggests that variability must be eliminated from the process and the process steps must be balanced. Once the factory reduces the variability significantly, a lean manufacturing based approach to managing operations can be utilized. Balanced flow lines and single order flow can then be implemented.
The Mid-Atlantic Regional Maintenance Center (MA-RMC) has taken an initiative to integrate Lean Manufacturing techniques into its production system primarily through Kaizen
events, which MA-RMC calls Lean Improvements Workshops (LIW's). The MA-RMC has run several LIW's in the traditional Lean Manufacturing approach.
One of the weaknesses of the LiW approach at the MA-RMC is that the
repair centers are continually under significant schedule pressures and are not willing to limit production for an entire week to conduct the kaizen event to try to gain long-term improvements.
This can drive the selection of areas for improvement to be focused on areas that are not critical to near term production. Therefore, even if the LIW is a success and improves the efficiency of the area, it may not have a significant impact on the organization as a whole. A high number of LIW's results in many small incremental improvements in the organization, but the focus must shift to more detailed value stream mapping and constraint analysis. The other difficulty lies in obtaining tangible results. This a challenge to the management team in documenting Lean Sigma improvement success and progress.
3.4 Six Sigma Background
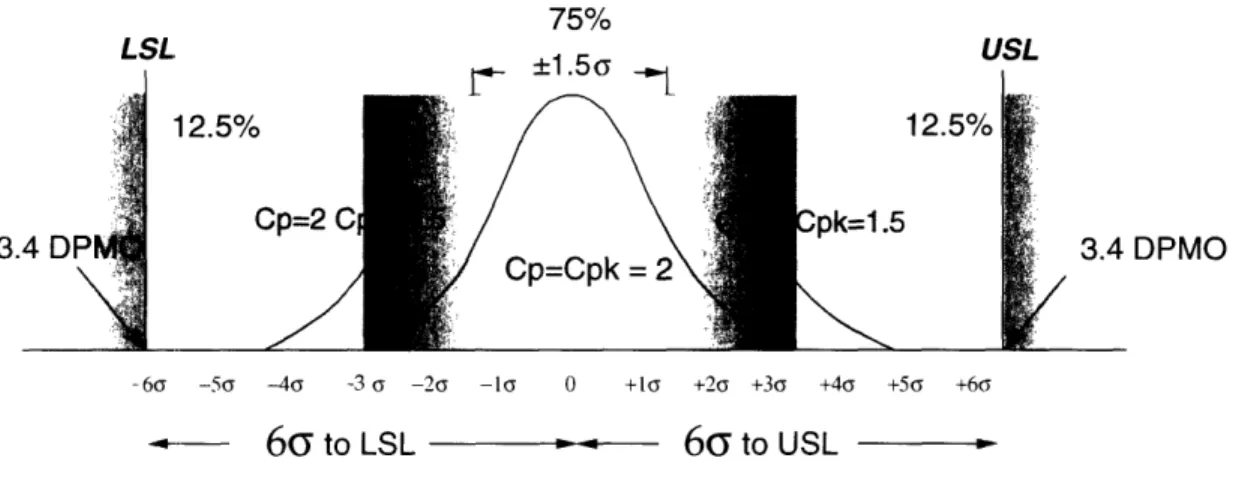
"Six Sigma" is an optimized performance level; approaching zero defects in any process whether it produces a product, a service or a transaction. Six Sigma seeks near-zero defects and variability. This requires having a common focus on excellence throughout the organization. The objective of a successful "six sigma" program is that all processes (manufacturing, service or administration) are predictable and capable. A predictable process has virtually no out of control points due to special causes. A capable process has a Process Capability Index or Cpk > 1.5 so it
will always be within specifications.
Why is 99% success not good enough? Because 99% can mean 20,000 lost postal mail items per hour, 15 minutes of unsafe drinking water per day, 2 bad landings per day at a major airport, 5000 incorrect surgical operations per week, 7 hours of lost electricity per month, or 20,000 incorrect prescriptions per month. The Six Sigma process theory is illustrated graphically in Figure 4.
Statistical Definition of Six Sigma
Statistical Definition 75% LSL ._+ +1 ~ e , USL 3 DPMO -66 -5( -4( -3 6 -20 -1( 0 +1l +20 +36 +46 +5( +65 - 6( to LSL - 66 to USL Evolution to:A Management driven, scientific methodology for product and process improvement which creates breakthroughs in financial performance and Customer satisfaction
Figure 4 Six Sigma Graphical Representation
The levels of six sigma as spelling errors would be equivalent to: 1(=170 misspelled words per page of a typical book, 26=25 misspelled words per page of a typical book, 3(= 1.5 misspelled words per page of a typical book, 46=1 misspelled word in 30 pages of text, 5(=1 misspelled word in a set of encyclopedias and 6(= 1 misspelled word in all books of a small library.
The characteristics of living the government paradigm of "just meeting spec" are: large independent inspection groups; frequent bad parts either reworked or scrapped; no constancy of purpose; external forces driving change only when costs or scrap levels are quite
4 The "Lean Sigma" Methodology - A combination of techniques
The basic elements of lean are the elimination of waste, workplace organization (5s), value stream mapping and Lean Improvement Workshops
Lean Sigma is a combination of techniques devised for Naval Shipyard personnel to continually improve their work processes. Improvements are based on appropriate customer value data, in order to deliver the best possible products and service to the customer. Lean Sigma is targeted towards shipyard maintenance activities more than manufacturing, but the Process, Principles, and various methods can apply to a wide range of activities: Engineering and design, Production, refit, conversions, Overhauls, maintenance and repair, Logistical support,
Administrative systems, Supply management.
Key Lean Sigma Tactics are to Focus on the total system. Do only what is needed, when needed, as dictated by your customers needs. Use existing assets to accomplish the change to avoid adding unnecessary sophistication. Eliminate anything that does not add value as waste. Continuous improvement is through the elimination of variations. Give everyone ownership in the change process so that continuous improvement becomes a way of life. The underlying principles of Lean Sigma are:
1) Know what is "value" to the customer.
2) Make the Value Stream flow by the elimination of variation and waste. 3) Focus on the constraints to deliver value to the customer.
4) Get buy-in and commitment to improvement at all levels of the organization. 5) Use the right improvement tools at the right time.
6) Continuously improve processes and products.
Start by evaluating the value stream. It is that sequence of value added (VA) activities that directly contributes to providing customer value
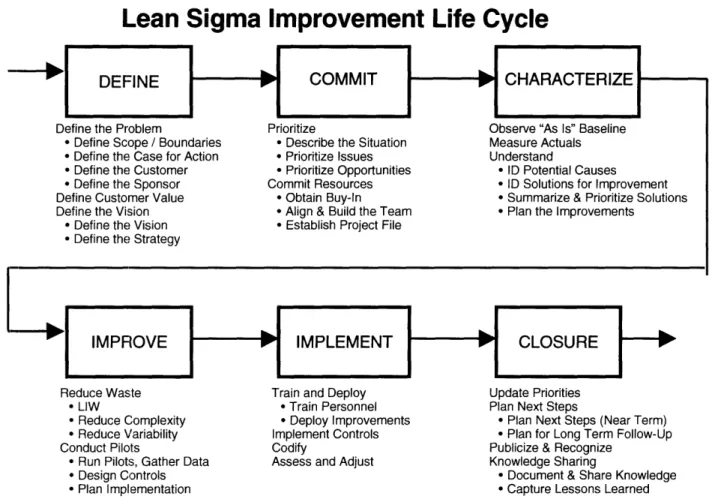
The Lean Sigma method is outlined as a sequence of stages called Define, Commit, Characterize, Improve, Implement, and Closure. Each stage is outlined in the next sections.
Lean Sigma Improvement Life Cycle
I
I
Define the Problem
* Define Scope / Boundaries * Define the Case for Action * Define the Customer * Define the Sponsor Define Customer Value Define the Vision
* Define the Vision * Define the Strategy
I Prioritize
* Describe the Situation * Prioritize Issues * Prioritize Opportunities Commit Resources
* Obtain Buy-In * Align & Build the Team * Establish Project File
Observe "As Is" Baseline Measure Actuals Understand
* ID Potential Causes
* ID Solutions for Improvement * Summarize & Prioritize Solutions * Plan the Improvements
IMPROVE IMPLEMENT CLOSURE
Reduce Waste * LIW
* Reduce Complexity * Reduce Variability
Conduct Pilots
* Run Pilots, Gather Data * Design Controls * Plan Implementation
Train and Deploy * Train Personnel * Deploy Improvements Implement Controls Codify
Assess and Adjust
Update Priorities Plan Next Steps
* Plan Next Steps (Near Term) * Plan for Long Term Follow-Up Publicize & Recognize
Knowledge Sharing
* Document & Share Knowledge * Capture Lessons Learned
Figure 5 Block Diagram of the Lean Sigma Method
4.1 Define
Begin by defining the problems within the process through observations and discussion, and by defining the current state of the process. Then build the future state of how the process is desired. The challenge is to establish a sense of urgency in the organization and convince them that continuing "business as usual" is more dangerous than jumping into the unknown of process improvements.
A. Define the Scope and Boundaries of the problem to address what areas are included and what is not. Address customer value in detail (breadth of focus) and determine what areas may be ripe for lasting change (depth of focus).
Define the Case for Action - why tackle this problem? Define the Customer - how will it benefit the customer? Define the Sponsor - who will provide resources?
The sponsor's role is to authorize activities, commit resources, lead the initiatives, and own the problems and their solutions. Ensure the right sponsor for the desired change is chosen (go only high as needed). Skipping a level can create a gap between. The champion is the lean enthusiast who wants this improvement initiative to work. The champion can serve as sponsor
B. Define Customer Value - what matters to the customer and their priorities. Ultimately the customer is the Navy's ship and submarine crews and their supporting organizations. They want their ships returned at full operational capability, with continually improving cost,
schedule and quality performance. They also want agile and flexible shipyards to meet changing operational demands.
C. Define the Vision - what is the desired End State?
D. Define the Strategy - layout how to reach the End State; what are the major tasks to pursue, and who must participate to effect these changes?
E. Outputs From The Define Part of Lean Sigma Problem Statement
Defined Work Scope Defined Work Boundaries A Case for Action
Identified Customer Identified Sponsor
List of Stakeholders in the organization Customer Value Statement
Vision Statement
Strategy (Top Level Plan)
4.2 Commit
Commit resources critical to getting the job done because "without commitment to action its all been just talk up to this point".
A. Prioritize - what is most important?
Describe the Situation - list all of the issues and opportunities-brainstorm with appropriate representation of all levels in the organization. Choose individuals who have experience and interest in change.
Prioritize Issues and Opportunities - ask what needs to be solved first, and where can we make gains; always be looking for "long poles" (hardest issue to solve) and "low hanging firuit" (easily implemented improvements).
B. Commit Resources - who will participate and support?
Obtain Management Buy-In - ensure all parties commit to the Vision and resources needed to get there.
Align and Build the Team -carefully involving the right people and the right skills; begin team-building. Create a list of opportunities for change. Get buy-in from the team, the
organization, the department, and the affected workers. Choose to work on initiatives that are good for both the department and the customer.
Establish Project File - this addresses the administrative aspects at the start, and will aid in tracking progress, and determining results to be presented to management.
C. Outputs From Commit
Description of Current Situation Prioritized List of Issues
Prioritized List of Opportunities Buy-In from Stakeholders Win-Win Contract
Committed Funding
Assigned Resources (People) Established Team
Team Charter Initial Project File
4.3 Characterize
A. Observe "As s" Baseline - determine what is reality (vs "on paper"), and conduct in-depth observation and analysis.
C. Understand - develop a common picture get team together daily or as necessary to share findings and ensure management is engaged and endorses the action items.
Identify Potential Causes - what are the root causes?
Identify Solutions for Improvement - what should be done to eliminate the root causes? Summarize and Prioritize Solutions - how might we tackle things, which can we do, and which should we do first?
Plan the Improvements - schedule time and resources to pursue the prioritized solutions Successful change requires that each action item be assigned someone responsible with estimated completion and start date. Smaller groups can meet and better define the plan.
D. Outputs From Characterize List of Observations
Baseline Process-current state
Measurements-metrics, times, distances Summary Observations-spaghetti diagram List of Potential and Root Causes
List of Potential Solutions
Summarized and Prioritized Solutions Improvement Plan of Action
4.4 Improve
Go to work on the problems.
Develop the improvements; create the path to success. A. Reduce Waste - eliminate complexity and variability.
LIW - Focused Lean Improvement Workshops-conduct a LIW.
Reduce Complexity - simplify and streamline- through value stream mapping of current and future state.
Reduce Variability - standardize on best practices; eliminate variation. B. Conduct Pilots - test out improvements and evaluate results.
Run Pilots, Gather Data - test out, confirm data.
Design Controls - procedures to keep the improvements working as intended.
Plan Implementation - determine how to roll out the improvements to the workforce; communications, timing of changes, and training.
C. Leadership
Champion of transformation vs. defend status quo- do politicking to convince the naysayers. Demonstrate the vision in action- nurture successes.
Ask questions, rather than give answers - to energize and empower the workers. D. Outputs From Improve
LIW Results
Process Improvements Pilot Results
Control System Design(s) Implementation Plan
4.5 Implement
Implement and emnbed the improvements as much as possible. Keep a plan of action to accomplish the more difficult improvements.
A. Train and Deploy - ensure everyone knows what the new processes are and what to do.
Train Personnel - formal or OJT - involve the second and third shifts so it is not seen as a dayshift only and so things don't go back the way they were overnight!
Deploy Improvements - establish new processes.
B. Implement Controls - establish procedures to keep things going.
C. Codify - document the changes in shop manuals or doctrine, putting it down preserves it so as personnel come and go the process will continue.
I). Assess and Adjust - make refinements to accommodate differences from pilots. The refinements require periodic meetings to achieve consensus on the solution.
E. Outputs From Implement Trained Personnel Deployed Improvements Imnplemented Controls Codified Improvements Assessment Results Documented Adjustments
4.6 Closure
The shop must sustain the gains that have been made. Sustainment is the most difficult part of transformation by Lean Sigma. Follow up is the key to sustainment, therefore develop a 30, 60, and 90-day plan. Ensure that the sponsor in management owns the plan and that every action has its own line item with an "owner" and estimated completion dates.
A. Update Priorities - update the "to do" list.
B. Plan Next Steps - the next long pole or low hanging fruit. Plan Next Steps (Near Term) - next project(s) to pursue.
Plan for Long Term Follow-up - 3 months, 6 months, 1 year, etc., to ensure process discipline.
C. Publicize and Recognize - COMMUNICATE! Tell management of your successes. Try to show improvements to the "bottom line" with metrics.
D. Knowledge Sharing - "sharpen the saw" and tell others about it. Document & Share Knowledge - maintain project notebooks.
Capture Lessons - what worked well, what didn't work well, and root causes? Thank the persons who emerged as lean champions.
E. Outputs From Closure Updated Priorities List of Next Steps
Long Term Follow-up Plan of Action Publication Materials
Completed Recognition Events Published Project Notes
Documented Lessons Learned
The progression of process improvement works best in sustaining the gains if the trend is to steadily improve, rather than a series of reactionary improvements.
Figure 6 Continuous Process Improvement
Proces
* While reality is...
s Improvement
- Entropy
- Shift in Customer Needs
ovement
Crisis Next Crisis
Process Performance Curve
Figure 7 Reactionary Process Improvement
Process Improvement
0
- ontinually Improve Wlithout Process Degradation
Process Performance Curve
5 Measures of Effectiveness (MOEs) and other Metrics
5.1 Importance of Metrics
The importance of metrics cannot be overstated. They are used for making a case to management that the resources spent on Lean Sigma improvement are well worth it. Conversely, management can use the metrics to kill a project if the metrics do not support continuing the effort. As such the indicators used must be able to show measurable improvement, measure important aspects of the business (customer value), and be specific and accurate. Metrics
(measurements) allow comparisons among current performance, past performance, and standards. The metrics chosen will communicate priorities. Behaviors and actions are driven by what is measured. When metrics are not aligned with goals, then the goals may not be met.
Measurements should encourage the "parts" to do what is good for the "whole". That is to encourage the desired behavior and discourage sub-optimization of sectors within the
organization. Good metrics are meaningful at each level and related among the levels of the organization. Measurements should direct focus to those areas that need attention or
improvement. By identifying the "vital few" constraints or bottlenecks we can drive continuous improvement through smart measurement to allow smart choices based on qualitative, financial, and technical data.
The challenge to the Naval Repair Centers is in calculating a Return on Investment (ROI) in a non-profit organization. The Navy gains for the same budget are increased capacity (surge), increased throughput (more maintenance completed), and more rapid turn around time. The increased capacity should also eliminate the need for contracting additional work to the private sector, saving the customer additional expense. The Military Industrial interdependence and politics will dictate that we continue to contract some work to the private sector to maintain that capability outside of the Navy. Standard measures for facility cost/square feet are $13 per square foot per quarter. This figure will be used in calculating facility cost savings from space
reductions. Labor reduction savings are based on an annual labor cost/person of $50,000 for military personnel and $75,000 for civilian personnel. As efficiency goes up the capacity goes up. Obvious savings could be in manpower reduction if the new capacity exceeds demand. This would be a tangible ROI, however it impacts people's lives and is currently the greatest concern of the labor union in regard to lean initiatives.
At NAVSEA Headquarters, the motivation behind process improvement is to save money on maintenance to redirect the funds for new ship construction. As in all organizations, there is a fierce competition for funding among the improvement projects. Therefore the projects that get the highest level buy-in will be funded and survive. These are projects that can deliver or are predicted to deliver tangible monetary results. The CEO and upper management want to have tangible results to the organization's bottom line. Even excellent projects can be cancelled if the ROI or cost avoidance cannot be shown.
The Fleet business office monitors the RRC work by tracking MOEs. MOEs are designed to give managers a tool in the decision making process. They provide a meaningful benchmark, create a sound basis for manning and facilities decisions and monitor the impact of these decisions. Desirable attributes for all MOEs are that they should be simple and few, relevant to decisions, credible, universal, and automated.
5.2 Mid-Atlantic Regional Maintenance MOEs
The Navy selected MOEs on a national, regional, and self-determined basis for monitoring the repair center performance back in 1999, when the RRCs were established. A business case analysis (BCA) was performed and the metrics were baselined at RRC inception.
National MOEs measure total cost, space, and personnel in a designated geographic location (Region). The metrics are collected annually and measured against the regional baseline footprint. The measurement is for all maintenance performed in a region. National metrics are reported in the annual business plan and are standardized for all regions.
Regional MOEs measure the performance of a RRC and other cost centers within the region. The data is collected quarterly and provides the input for an annual report. Included as regional measurements are manpower utilization, responsiveness (measured by turn around time (TAT)), shop throughput and contracted costs. These metrics are standardized in all regions.
Mid-Atlantic Selected Metrics are selected measurements by the Regional Business Office. They are defined as performance measurements for the RRCs. These MOEs are titled as Navy Enlisted Classification (NEC) Tracking, Quality, Adherence to Schedule, Overtime, RRC Utilization, and Personnel Utilization. The selected metrics are unique to the Mid-Atlantic Region.
5.3 Specific Definitions of Each Metric 5.3.1 National Metrics
A. Regional Cost - Cost of the operation of a RRC and cost of similar work being performed in the region measured against the BCA Baseline footprint.
B. Regional Square Feet - Total space occupied by a RRC and total space utilized for similar work in the region measured against the BCA Baseline footprint.
C. Regional Personnel - Total personnel (military and civilian) assigned to the RRC and personnel in the region performing similar work measured against the baseline foot print.
5.3.2 Regional Approved Metrics
A. Utilization - Is categorized into two (2) groups, Production and Support Percentage:
Al. Production - Number of production man-hours (MH) expended against a 2,008 MHs work year. The 2,008-hour work year is pro-rated by workdays in each quarter and is compared against the number of expended man-hours for the RRC in the quarter. A percentage is used as the number of man-hours utilized per person. The expected average percentages are 85% for civilian and 65% for military.
Expended MH's
--- Production Utilization Gross Available
A2. Support Percentage - Number of support personnel based on a total head count minus persons assigned to direct labor. Number of personnel is determined from the RRC employment database. Support man-hours are also tracked to measure indirect overtime.
Support Personnel
--- Support Percentage Gross Personnel
B. Responsiveness - Average number of days to complete a component in a RRC (Turn Around Time).
Sum of (completion date - induction date)
--- TAT Number of jobs completed
C. Throughput - Total number of units processed through a RRC in a given timeframe (each quarter).
D. Contract Cost - Quantity and cost of components normally worked by the RRC that are completed by a private resource. A percentage in this metric indicates the amount contracted by private resources compared to the total amount of components completed by the RRC.
5.3.3 Mid-Atlantic Selected Metrics Description
A. NEC Tracking - Number of military personnel onboard with appropriate Navy Enlisted Classification (NECs) or training to perform work in a designated RRC versus number of personnel required.
NEC's On Board
--- = % of NEC's Achieved NEC's Required
B. Quality - Total discrepancies found by either the RRC's Quality Control/Assurance in the backshop or other portions of repair process or by the customer after the item has been tested and turned over. The quality process is RRC specific due to the differences in their primary functions. A percentage is used to identify the components with or without discrepancies.
C. Schedule - Components meeting the required delivery date that is agreed between the RRC, RSG Production Control and the Customer.
D. Overtime - Number of hours worked in excess of a 40 hour work week. Expended Overtime
--- % of overtime Utilized Expended Straight Time
E. RRC Utilization - Number of components worked in a RRC versus components worked in the region (Applies to regional repair centers that are not in their end state).
Units Processed in a RRC
--- % RRC is Utilized Units Processed in the Region
F. Personnel Utilization - Number of personnel assigned to a RRC versus number of personnel in the region performing similar work (Applies to regional repair centers that are not
completely consolidated).
RRC Personnel
--- = % RRC Personnel are Utilized Region Personnel
G. RRC Cost - Total operational cost.
H. RRC Space - Total space occupied by a RRC.
1. RRC Personnel - Total personnel, both military and civilian in a RRC.
6 Test Case in the Electric Motor Regional Repair Center
The customer's greatest expenditures are for pump overhauls and secondly for motor repairs. The Electric Motor RRC was chosen for the first Lean Sigma improvement workshop
since the motor shop has a more manageable scope and logical flow than the myriad of pump styles and types of problems occurring in the Pump RRC. The motor repair layout is logical and appears to have a single piece flow basis and had some lean ideas already in place. Its relative importance as the shop with the second largest volume of work could result in a visible victory, to get organizational buy-in and momentum to carry on future Lean Sigma applications to the other shops in the region. The pump repair shop is planned for the next Lean Sigma effort since it performs the largest volume of work. The experience and corporate exposure gained from the motor repair LIWM can be used to gain endorsement for a pump repair LIW.
The Electric Motor RRC metrics maintained and monitored by the customer are
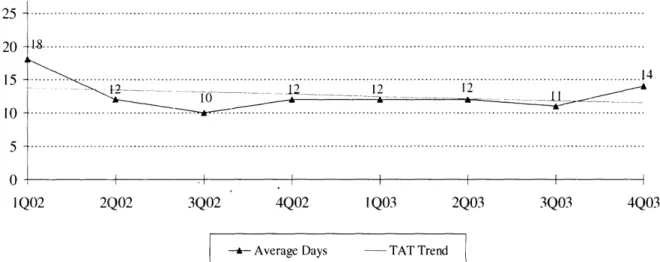
manpower utilization and support percentages, average turn-around time (from receipt to shipping back the refurbished motor), throughput in motors per quarter, contract costs (to compensate for shop overload), schedule adherence, quality and overtime usage. This test case LIW focused on improving TAT, throughput, and contract cost.
25 20 -15 -10 - 5-0 ... ... ... ... .... ... . 14.. .~~~~~~~~~~ A - 1 ...' ... . ... " '. ...' . ... 4 "'- - - - --' . ... .. ...- -I . I i I I I I Q02 2Q02 3Q02 4Q02 I Q03 2Q03 3Q03 4Q03
-- -Average Das - TAT Trend
Figure 8 Motor Repair Shop Turn Around Time (TAT)
Currently the TAT is 14 days per motor with a throughput of 210 motors last quarter. Due to shop overload the contract cost was $210,000 for work that the Motor RRC could not do last quarter. The L1W goals are to reduce TAT, increase throughput and eliminate contract costs. Figures 6, 7 and 8 show the Motor RRC performance on these metrics over the past two years.
350. 3 5 0 - ---- --- --- --- --- ---- -- -- --- --- --- --- --- --- -- -- --- -- --- -- ---- --- --- ---- --- ---- --- --- ---- --- ---- --- --- ---...-- -- --..
300
. ...-...
...
252 249 2 5 0 - .-- - - -. :: . . . ...-209
200
_
!9,---_--t24
150 ... ... ... ... ... ... ... ... ... ... ... ... ... ... ... ... ... ... ... 200 100. 50. 0I I I I I 1Q02 2Q02 3Q02 4Q02 1Q03 2Q03 3Q03 4Q03--- Motors - Throughput Trend
Figure 9 Motor Repair Shop Throughput
$500 ...- '45' ... $450 .; $400 ... . .. .. $350 $300 $350 ... ... .... .. ... \. ... .... ... ... $ 3 -- -- - -- -- - -- -- - -- -- --- -- - -- -- - -- - . .. . ... . ... . .. .. .. . -$203 $201 ;9s0 ...-.---- / \z $
$ 150
0
$ 5.-..90._'
2 .=X .-.$100
-...
-1~~~~~~~~~~~~~~~~~~~~~~~~~~_.
...
$. 6 /...
... ...
7...
... -- ---
- -"--
.". -- .'..
-
- -
-.
-$ 5 0 ... ... ... ... ... ... $0 I I I I I I1Q02 2Qo2 3Qo2 4Qo2 IQ03 2Qo3 3Qo3 4Qo3
i - Contract Costs - Contract Costs Trend
Figure 10 Motor Repair Shop Contract Cost (x 1,000)
6.1 Customer Focus
Focus on the constraints, to deliver customer value by continuously striving to improve processes and products. Any step or activity in a process is considered value added (VA) if it meets all of the following criteria. The customer wants it, it changes the form, fit, or function of