ANALYSES OF FAILURES OF FILLET WELDS
by LI LIANG
B.S., Mechanical and Manufacturing Engineering
Beijing University of Aeronautics and Astronautics, Beijing, P.R. China 1988
Submitted to the Department of OCEAN ENGINEERING in Partial Fulfillment of the Requirements for the Degree of
MASTER OF SCIENCE IN OCEAN ENGINEERING at the
MASSACHUSETTS INSTITUTE OF TECHNOLOGY FEBRUARY 1997
Copyright, @Massachusetts Institute of Technology
Signature of Author
Department of Ocean Engineering January, 1997
Certified by
Department
Professor Koichi Masubuchi of Ocean Engineering, Thesis Supervisor
Accepted by
I-Professor Kim J. Vandiver Chairman, Committee for Graduate Studies
APR 2
9
1997
Analyses of Failures of Fillet Welds
byLi Liang
Submitted to the Departments Ocean Engineering February, 1997, in partial fulfillment of the
requirements for the degree of Master of Science in Ocean Engineering
Abstract
This thesis studied plastic failures of fillet welds in ship structures. Different rupture modes were studied separately. Purposes of the analyses were to simulate the failures of fillet welded ship structures which are subjected to extreme plastic
deformations caused by collision or grounding accidents.
The numerical study of plastic failure of a cruciform fillet weld under tension was performed by finite element method (FEM) using ABAQUS software. The
inhomogeneous material properties which are caused by welding heat affect were approximately simulated by hardness measurement. For the FEM model, the input contour line of the weld was made by measuring the fusion line from an etched specimen macro-photo.
In three point bending tests, with the pictures obtained from the video micro-scope and the video printer, the tearing work per unit length of the fillet weld was calculated. Also, the strain concentration factor of the end fillet weld caused by the geometry discontinuity of the end fillet weld and the undercut defect was studied. The tearing criterion of the end fillet weld around the pedestal on the base plate was calculated as a function of the deformed curvature of the base plate.
Thesis Supervisor: Koichi Masubuchi
Acknowledgment
I would like to express my deepest gratitude to my advisor, Professor Koichi Masubuchi, for his advice and support throughout the study. His practical insight in engineering and professional seriousness in research have been inspiring and will always be.
I also want to thank Professor Frank A. McClintock, for his enthusiastic support and encouragement in theory development.
My appreciation also goes to the sponsors of the Tanker Safety Program and Oil Tanker Side Collision Program. With their generous support, I was able to finish this thesis with two reports.
Thanks go to my laboratory mates Mr. Hideki Shimizu, Mr. Yunchin Hsiao, Mr. David Walworth, Lt. Athanasios G. Sampos, Mr. Eko Kuswantoro,. Lt. Robb Wilcox, Ms. Regina Midaugh, Ms. Juliana Atmadja, Mr.Akira Umekumuni, Mr. Akira
Yamamoto, and Dr. Gokhan Goktug, for the friendship and fun we shared at the welding system laboratory. Their encouragement and help are priceless in the limited period of my staying at MIT. I am grateful to Mr. Tony Zona, our beloved technician, for his tremendous help in the research projects.
My special thanks go to Ms. Danielle Guichard-Ashbrook, the assistant dean of the international student office, for helping me pulling through the hard time in my life.
4 Table of Contents A bstract... .. ... ... 2 Acknowledgments ... ... Table of C ontents ... ... 4. L ist of Figures ... ... 7 List of Tables. . . . ... ... 9 Chapter 1 Introduction ... 10 1.1 B ackground ... 10
1.2 Objectives and Approaches ... ... 14
1.3 O rganization of thesis ... ... 16
Chapter 2 Analysis of Cruciform Fillet Weld under Tension ... 17
2.1 Overview ... ... 17
2.1.1 B ackground .. ... ... 17
2.1.2 Basic approaches ... 18
2.2 Cruciform Fillet Weld under tension test Description... 18
2.3 Material Properties Supporting Data ... ... ... 19
2.3.1 Power-law fitting of the uniaxial tensile test of EH 36 carbon steel from data of Kawasaki Heavy Industries ... 19
2.3.2 Hardness measurement... 21
2.4 C alculation ... ... ... ... 22
2.5 C onclusions ... 23
Chapter 3 Tearing Work of the Side Fillet Weld ... 29
3.1 Overview ... 29
3.2 Theories A pplied ... 29
3.3.1 Specimen preparation and instrumentation...33
3.3.2 Experimental recording ... 35
3.3.3 Post failure specimen examination ... 37
3.4 Calculations...38
3.4.1 Calculation of R, from load vs. displacement data ...38
3.4.2 Calculation of RC from post failure measurement data ... 39
3.5 Conclusions ... 40
Chapter 4 Strain and Stress Concentration Analysis of the End Weld with an U ndercut D efect... ... ... 55
4.1 Overview...55
4.2 Theories Applied...56
4.2.1 Linear elastic fracture mechanics ...56
4.2.2 Dynamic fracture ... 58
4.2.3 Elasto-plastic fracture mechanics (EPFM) ... 60
4.3 Experim ent D escription... ...63
4.3.1 Specimen preparation and instrumentation ... 63
4.3.2 Experiment observation ... 65
4.4 Calculations ... 66
4.5 Conclusions ... 68
Chapter 5 An Analysis of the Plastic Failure of the Base Plate near the End Fillet W eld ... 78
5.1 Overview ... 78
5.2 Theory Applied... ... ... . ... 79
5.2.1 Bending and tension combined load vs. pure bending moment ...79
5.2.2 Tearing of the base plate at the web end ... ... 80
5.2.3 Low cycle fatigue for repeated loading ... 84
5.3 Experiment Performance... ... 84
5.5 Conclusions ... ... 89
Chapter 6 Conclusions and Recommendations ... 98
References ... ... 101
A ppendices ... .. 110
Appendix 1 Literature Review ... 110
Appendix 2 Experiment Description ... 113
Appendix 3 Calculation (Computer programs etc.) ... 118
List of Figures
Figure 2-1 Figure 2-2
Figure 2-3 Figure 2-4
Cruciform testing specimen subject to tensile load ...24
Computer simulated stress strain relation curve of EH36 steel...25
The hardness measurement of a weldment showing a narrow HAZ...26
The contour line measured from the specimen No. 6...27
Figure 2-5 An FEM model of the specimen No. 6 ... 28
Figure 3-1 TWB specimen test configuration ... 41
Figure 3-2 Wide plate bending specimen dimension drawing ... 42
Figure 3-3 Slip line fields, crack tip opening displacement for initiation, CTODi=ui, and alternating cracking and sliding off during growth to final separation at u f... ... .4 3 Figure 3-4 Geometry and definitions of a fillet weld ... 44
Figure 3-5 Control volume for the critical tearing work per unit length Rc in peeling ... . ... .... ... .... ... 45
Figure 3-6 Peeling of an elastoplastic metal epoxy joint by an end force ... 46
Figure 3-7 Figure 3-8 Figure 3-9 Figure 3-10 Figure 3-11 Figure3-12 Peeling of an elastoplastic metal-epoxy joint by an end couple ...47
Beveled and unbeveled web ... 48
Wide plate bending experiment setup ... 49
Comparison of load vs. displacement diagrams of Specimen 1 and Specimen S...50~....³...50.
Schematic drawing of the cracking process of the specimens during tests..51
Figure 3-13 Post failure pictures of specimen 3 ... 53
Figure 3-14 Schematic drawing bending moment of the specimen ... 54
Figure 3-15 Specimen 2 and specimen 3 load vs. displacement curves ... 55
Figure 4-1 Cross section of a fillet weld for hardness measurement, with an undercut exist at the vertical toe of the weld ... 69
Figure 4-2 Geometry difference of specimen 5 and specimen 6 ... 70
Figure 4-3 Displacement vs. nominal strain for the geometry of the experiments simulated by FEM. ... ... 71
Figure 4-4 Definition of J-integral ... ... 72
Figure 4-5 Load displacement diagram for cracked body of non-linear elastic m aterial ... 73
Figure 4-6 Relationship between a surface crack dimensions and equivalent through thickness crack dim ension. ... ... 74
Figure 4-7 Figure 4-8 Figure 4-9 Figure5-1 Figure 5-2 Figure 5-3 Figure 5-4 Figure 5-5 Figure5-6 Figure 5-7 Figure 5-8 Specimen 5 load vs. displacement curves. ... 75
Specimen 6 load vs. displacement curves. ... 76
Comparison between monotonic and cyclic stress-strain curves for ASTM A-36 structural steel...77
Specimen setup with the supporting blocks...90
Pictures of failed specimen 7 with the base plate shearing off at the toe of end w eld ... .. 9 1 Schematic drawing of the base plate shearing off around the pedestal...92
Combined load of tension and moment diagram ... 93
The real case and idealized and model comparison...94
Load vs. displacement diagram of the test ... ... 95
Schematic drawing of post fracture measurement of specimen 7...96
List of Tables
Table 2-1 Stress-strain relation of the base metal ... 20
Table 2-2 Tensile strength of the weldment of a cruciform specimen ... 22
Table 3-1 The chemical composition and mechanical specifications of base metal AH-36 and weld metal TGS-50... 34
Table 3-2 Specimen characteristics of Specimens 1,2,3 and 4...35
Table 4-1 Specimen characteristics of Specimens 5 and 6 ... 64
Table 4-2 The end fillet weld dimension measurement of Specimen 5 and Specimen 6 ... . . ... ... ... 64
Table 5-1 Dimensional descriptions ... 86
Table 5-2 Specimen 7 material descriptions... 86
Table 5-3 The input parameters for calculation the coefficients ...88
Chapter
1 Intro.
Chapter 1
Introduction
1.1
Background
In the Joint MIT-Industry Project on Tanker Safety, the grounding damage of oil tankers has been extensively studied. Renewed consideration of the crash worthiness of oil tankers has demonstrated the need for the detailed characterization of the fillet welds that join the stiffeners to the hull platings due to grounding loads [Wierzbicki, et al,
1991]. This research program led to a later research program entitled "Rupture Analysis of Oil Tankers in Side Collusion" which was performed for the Volpe National
Transportation System Center, the Department of Transportation.
Current fillet weld design standards in ship building industry only ensure safe performance under normal operating conditions. These fillet welds, generally speaking, do not withstand grounding forces [McDonald, 1993]. Investigation of the damages encountered in the grounding of the Exxon Valdez and the data of large-scale grounding tests, performed by Mitsubishi Heavy Industries Ltd., have shown failure of the fillet welds in the damage area. The welding team in the Joint MIT -Industry Project on Tanker Safety has been working to understand the failure of fillet weld and to provide the improvement of weld design.
During grounding accidents, The a ship with stiffeners integrated together with hull platings can take more energy than a ship with the stiffeners apart from the hull platings. Hence, increasing the tearing work or tensile strength of fillet welds so as to
-Chapter
1 Intro.
shift the deformation and fracture to the areas away from the fillet welds is desirable in the grounding or collision of a ship. In the mean time, the understanding of initiation of the tearing off of the weldment is crucial to understand the whole process of the plastic rupture of the fillet welded ship structures.
Increasing welding penetration is a promising approach of increasing the strength of fillet welds subjected to tension loading [Masubuchi, 1968]. Commonly, penetration can be obtained by beveling plates. But, beveling plates raises the fabrication cost. Fortunately, penetration without beveling plates can be obtained by alternative methods. Relatively deeper penetration can increase joint strength without adding any weld materials [Wilcox, 1995]. Fifty six cruciform specimens welded by gas metal arc welding (GMA), under different welding parameters, were tested under tension had shown that deeper penetrating welds gave three to four times plastic extension as compared to welds without penetration. By increasing welding current and torch travel speed, a deeper penetration can be achieved without increasing the energy consumed compared with the manufacturer recommended welding parameters [Wilcox, 1995].
In the previous numerical studies on the strength of fillet welds, the geometry of the fillet welds was idealized as a triangle that virtually neglected the existence of
penetration. The material was considered to be homogeneous [Atmadjia, 1995]. Both of these assumptions conflict with the real characteristics of fillet weld. Firstly, the
materials of weldment are inhomogeneous due to the welding heat involvement. The mechanical properties vary substantially within a narrow region of weldment [Harrison,
Chanter 1 Intro.
JWS]. Secondly, the main purpose of cruciform fillet weld tensile tests is to test the effect of penetration effects on the tensile strength of different specimens that were fabricated by GMA welding under different welding parameters. The numerical model without penetration loses its vigorousness under such an assumption. Calculating the tensile strength without considering the penetration, will give a limit load much less than the test value. The error was about 15% compared with the experiment results as shown in by Atmadjia, 1995. This thesis studied the tensile strength of the cruciform fillet welds with the considerations of changing of material properties of different areas and
penetration by inputting the fusion line of the fillet weld as a weld contour line. The fusion line of the fillet weld was measured from the etched macro surface of a slice of the fillet weld of a specimen.
Compared to a butt weld, a fillet weld has larger geometrical discontinuity that results to more severe stress and strain concentration. With a larger stress concentrator, the welded structures may fail in brittle mode that sustain much less energy. Seven relatively wide plate attached with a stiffeners by fillet welds were studied by standard three-point bending test. The test was performed to simulate the most severe situation of loading on still exiting fillet weld structures. This relatively small scale test has been desired to predict the plane strain fracture toughness of the fillet weld. The tearing work per unit length R, of the fillet weld fitted in the formula proved by a much larger scale test to separate the stiffener from the base plate by tearing [Koga, 1992].
Most of the brittle fractures initiated and occurred from and near the defects in the stress concentrated region of a welded structure. After the initiation of small cracks in the
Chaoter 1 Intro.
structure, if the structure is subjected to extreme plastic deformation, the already existed cracks may become the source of the ductile fracture. The welding defects, including lack of penetration, undercuts, inclusions, and arc strikes, if located at the stress concentrated region, the combination of these contributions of defects and stress concentration caused by geometry discontinuity prescribes the undesirable fate of the fillet weld structure. To simulate the negative effect of a possible existing undercut, a notch was intentionally machined at the toe of the fillet weld. Theoretically, in the above mentioned the stress and strain concentration region, if the plastic zone size caused by the stress concentrator is larger than the defect size, the linear elastic fracture mechanics (LEFM) cannot be applied [Hagiwara, 1985]. Therefore, the general yielding fracture mechanics is the practical assessment in this thesis.
The plastic failure initiations at different for different weldments and load patterns are different. Three modes of tearing off the base plate from the fillet weld plastically were discussed by McClintock, 1997. The tearing mode of the base plate around a pedestal under the fillet weld at the end of the joint of base plate and the stiffener was studied in this thesis. A critical value of the vertical displacement of the pedestal material under the fillet weld at the end weld was obtained. This critical vertical displacement pec can be used to judge whether the base plate is going to be torn off or not at a certain curvature of the base plate caused by grounding or collision. Also, design of the weldment can be associated with this critical value because vpec is a function of
Chanter 1 Intro.
the weldment, including the leg-length, the width of the half span between two stiffeners, the thickness of the base plate, and the thickness of the stiffener.
1.2
Objectives and Approaches
Tests are desired to give quantitative design and fitness-for-service data, such as limit load and tear resistance per unit length as a function of welding parameters and resulting leg length and penetration. A numerical computational method offers the advantages in predicting some factors that are difficult to measure accurately and were usually given by roughly approximated in empirical formula.
Finite element method makes it possible to calculate the weld structure with inhomogeneous material in the weldment. By using FEM, the geometry contour of the fillet weld can be accurately simulated as an input function. In this sense, a more realistic model can predict a lower limit load for the cruciform fillet weld under tension for the experiments. In this thesis, several attempts of gradually reducing the number of
assumptions were made to check the results respectively. The first attempt was to change the fillet weld contour line only, and still applying the perfect plastic material property for calculation. This output was aimed to get the contribution of the penetration effect. The second trial was to transform the hardness measurement to the flow stress of the material, then extrapolate the mechanical properties of the materials by power-law rule
[McClintock, et al, 1966a]. This model had been desired to check the inhomogeneous properties for the calculation.
Chapter
1 Intro.
The tear resistance of fillet welds crucial criterion to judge whether the welds are strong enough to hold the structure membranes together as an integrated structure after the crack initiated at a certain region. The tearing work per unit length of the fillet weld R,
determines the possibility of whether the stiffener plates of an oil tanker are integrated with hull platings, when the hull platings are penetrated by grounding rock or collision.
The studies of the notched wide plate specimen bending, is desired to give the designers and manufacturers of ships the quantitative evaluation of the role of the undercut welding defect. Therefore, industry rules can strictly warn people to avoid the welding defects at the stress concentration region. The weld shape effect was studied with the combined contribution of notch effect of an undercut at the toe of the end weld. FEM calculation of the plastic strain was performed to get an insight of the failure phenomena.
The tearing off of the base plate around the pedestal under the stiffener and the fillet weld was studied. A criterion, the critical vertical displacement of the pedestal vpec, was obtained through experimental and analytical studies. This criterion was formulated as a function of the material power law exponent n and dimensions of the weldment. These dimensions include the thickness of the base plate t, the thickness of the web (stiffener) tw, the horizontal leg-length of side fillet weld d, the width of the plate w. With the vertical displacement ve known as an important function, the curvature K of the
Chanter 1 Intro.
base plate of the ship structure upon grounding or collision accidents is related to the failure of a certain kind of fillet welds which have sudden ends.
1.3
Organization of thesis
Chapters 2 focuses on the analysis of cruciform fillet weld under failure under tension. Chapter 3 focuses on the tearing work of the plated bending test. Chapter 4 discusses the effect of welding defect -undercut on the bending test. Chapter 5 studies the initiation of the tearing off of the base plate at the toe of the end fillet weld of the fillet welded structure. Chapter 6 draws conclusions on of the failure studies of fillets welds. Relevant figures are attached to the end of each chapter. At the end of thesis Appendices are included
Appendix 1 Literature survey
Appendix 2 Experimental description
Appendix 3 Calculation (computer programs, etc.) Appendix 4 Experimental results.
These appendixes should be useful for those people who are interested in studying further details.
ChaDter 2 Cruci. tensile test
Chapter 2
Analysis of Cruciform Fillet Weld under Tension
2. 1 Overview 2.1.1 Background
In the Joint MIT -Industry Project on Tanker Safety, the grounding damage of oil tankers has been extensively studied. The better understandings of fillet welds performance are needed. Investigation of the damages encountered in the grounding of Exxon Valdez and the data provided by Mitsubishi Heavy Industries' large-scale
grounding tests have shown failure of the fillet welds in damage area. The welding team in the Joint MIT -Industry Project on Tanker Safety has worked to the understanding and the improvement of weld design.
Different methods can be applied to increase the strength of fillet weld under tension load. These methods are mentioned by Masubuchi. 1968. They are increasing the welding material strength, increasing weld sizes and increasing the penetration of a weld. Different regulatory agencies allow various amount of leg length reduction with the penetration increased. Usually in industries, penetration is obtained by beveling plates which will take more labor and material costs. However, penetration can be obtained without beveling plates by another method. Relatively deeper penetration can increase joint strength without adding substantial weld materials. More than 50 cruciform specimens welded under different welding parameters were tested under tension have shown that deeply penetrating welds showed three to four times plastic extension as compared to welds without penetration. By increasing welding current and torch travel speed, a deeper penetration can be achieved without increase the energy consumed compared with the manufacturer recommended welding parameters. [Wilcox, 1995].
From the experimental analyses, we are not very clear about the failure process that is the crack propagation procedure in the welds. By studying the macro fractograph or simply the failure surface of a tested specimen, it is hard to get more detailed
Chapter 2 Cruci. tensile test
information of the crack propagating process before the crack makes the structure fail. In order to have some insight view of the failure mechanism of those fillet welds, a
numerical method is used to get the information of crack initiation and propagation process. In this chapter, the failure test of specimen No. 6 from Wilcox tests [Wilcox,
1995] as a simulation prototype model was chosen because it has the optimal combination of strength and energy consumed to fabricate it.
2.1.2 Basic approaches
In the previous numerical studies of the fillet welds, the geometry of the fillet welds had been idealized as a triangle that neglecting penetration [Atmadjia, 1995] and the materials of base plates and weld had been assumed to be homogeneous. These assumptions are not appropriate for the study of the fillet welds when penetration and welding parameters that greatly affect the geometry and the materials of both weld metal and heat-affected-zone (HAZ) when mechanical properties are considered. By
connecting hardness measurement to the mechanical properties of the fillet welds [Middaugh, 1995] and measuring the fusion line of the specimen No. 6, an FEM simulates the test more closer to the reality.
2.2
Cruciform Fillet Weld under Tension Test Description
Ideally, people want to perform a test on smaller scale than the real case.However, due to the metallurgical and geometric complexity of a fillet weld, a small scale test may not accurately interpret the actual fracture behavior of large welds. Thus,
cruciform fillet tests were thus performed in real scale by Lt. Robb Wilcox. Figure 2-1 shows the dimensions of a tested specimen.
Test Materials
Base plate: EH-36 tb=25mm B=127mm Weld metal: EXCEL-ARCO 71 flux cored wire
Chanter 2 Cruci. tensile test
2.3
Material Properties Supporting Data
2.3.1 Power-law fitting of the uniaxial tensile test of EH36 carbon steel from experiment data of Kawasaki Heavy Industries
The true stress-strain relationship of the base metal EH-36 low-alloy carbon steel that the specimen were made from based on the Swift power-law
a=
oj(cE + Ep)n 2-1From the experimental data obtained from Kawasaki Heavy Industries (Appendix-4), we can get the yield strength YS, tensile strength TS, and the uniform strain E, at tensile strength a,. The Yield strength YS is calculated as
YS = ao . 2-2
Under necking condition, dP=O, thus the tensile strength is
do-de . 2-3
Substitute Eqn. 2-1 into Eqn.. 2-3, we obtain
n = , +co 2-4
Knowing that tensile strength TS is the force divided by the original area, we have
P P A
TS- x
-Ao A Ao 2-5
where log(A/Ao) is the uniform strain c at ac. Here, we have the tensile as
TS= o( e,, + o)"e~. - 2-6
From Eqn. 2-2 and Eqn. 2-6, we obtain
TS E + )6 +,eE
TY .o 2-7
Applying Eqn. 2-7, we can solve 60. Consequently, we use Eqn. 2-4 and Eqn. 2-6 to calculate n and cy out respectively.
Based on the experiment data provided by Kawasaki Heavy Industries (Appendix -4), The material properties can be assumed as: so=0.014, n=0.184, and 0,=705 GPA. Equation 2-8 gives the numerical approximation with these parameters
Chapter 2 Cruci. tensile test 20
o(c) = 705*(c + 0.0014)0184 2-8
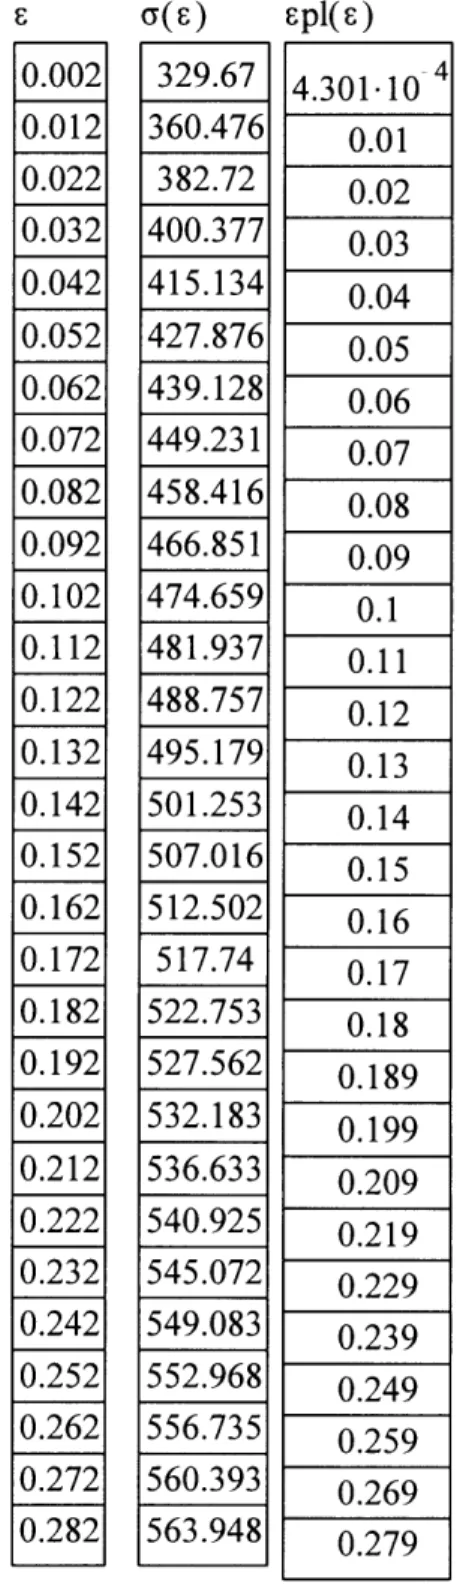
The tabular input material mechanical property (Table 1) is calculated based on Eqn. 2-8. And Figure 2-2 shows draw fitted power-law of stress-strain curve.
Table 2-1 stress-strain relation of the base metal.
Go(s)
:pl(E)
0.002 329.67 4.301-10 4 0.012 360.476 0.01 0.022 382.72 0.02 0.032 400.377 0.03 0.042 415.134 0.04 0.052 427.876 0.05 0.062 439.128 0.06 0.072 449.231 0.07 0.082 458.416 0.08 0.092 466.851 0.09 0.102 474.659 0.1 0.112 481.937 0.11 0.122 488.757 0.12 0.132 495.179 0.13 0.142 501.253 0.14 0.152 507.016 0.15 0.162 512.502 0.16 0.172 517.74 0.17 0.182 522.753 0.18 0.192 527.562 0.189 0.202 532.183 0.199 0.212 536.633 0.209 0.222 540.925 0.219 0.232 545.072 0.229 0.242 549.083 0.239 0.252 552.968 0.249 0.262 556.735 0.259 0.272 560.393 0.269 0.282 563.948 0.279Chapter 2 Cruci. tensile test 21 2.3.2 Hardness measurement
The Vickers hardness value Hv is obtained by dividing the load P on an indenter in kilograms by the contact area Ac of the impression in mm2 , which can in turn be found from the diagonal d of the pyramid [ McClintock et al, 1966]
P 1.8544P
Av
d
2A, d 2-9
We can approximate the tensile strength of the material using the relationship of hardness and tensile strength. This simple relationship, defined by McClintock et al, 1966, s suitable for perfect plastic material and can be used as an assumption of our weld metal and heat-affected-zone (HAZ) calculation. The relation is expressed simply as
TS(ksi) = 0.3 Hv. 2-10
This is only a rough assumption of the material, ignoring the strain hardening effect of the material and assumes the material to be homogeneous. ASTM standards do not recognize it as an official conversion between hardness and tensile strength [ASTM 1994]. However, due to the difficulty of measuring the teasel in micro-scale, despite the imprecise nature of the hardness and tensile strength relationship, the hardness
measurement still offers us an accessible approach for the detailed examination of weld and its vicinity areas. This micro-scale measurement is suitable for the finite element method when material has to be divided into dimensions.
From the data provided by Regina Middaugh, 1995, we can approximate the weld region into three areas. Namely, weld metal, base metal and heat-affect-zone (HAZ) ( Figure 2-3). The weld metal has the hardness range from 270 to 332. The base metal has the hardness range from 185 to 222. The HAZ which here is simply considered as the small area extended from the fusion line to the base metal has the hardness range from 315 to 497. This area is the most complex area in microstructure of the material. And it has the highest hardness. In plastic analysis, however, because this area is very narrow and has much higher yield strength according to Eqn. 2-10, and the deformation is rather small, we can assume these three areas to be locally homogeneous and have uniform hardness. The assumption was made as follow :
Chanter 2 Cruci. tensile test
hardness of base metal is 200, hardness of weld metal is 300, hardness of HAZ is 400. Based on the assumption. The tensile strengths of the materials are given as in Table 2-2.
Table 2-2 Tensile strength of the weldment of a cruciform specimen.
HAZ Weld metal
Base metal 120 90
2.4
Calculation
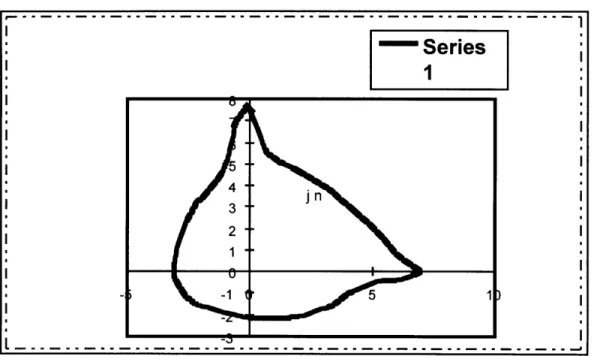
FEM geometry models were made by taking the advantage of symmetriy of the cruciform specimen structure. The middle plane of the middle plate which was not clutched by the tension machine was "cut" in the middle.. The purpose of doing this is to save the calculation resource of a computer. The clutched plate could also be cut in the middle as symmetric reasons. However, the boundary conditions of that middle plane is not easy to define. So the cruciform specimen turned to a T form. And this middle plane we defined is fixed in 1,2,3,4,5,6 axes as boundary conditions. The weld contour lines were inputted by the fusion line measured from polished micro picture of the specimen No. 6 (Figure 2-4). The right side and left side of fillets were assumed exact same which
in actual case there was a slight difference. A two dimensional (2-D) geometry model thus was built. In the weld, the elements was generated according to the grain growing direction. This approach will take metallurgical factors into consideration, although it was tedious to make a mesh like that. The material properties were inputted by field option which allowed none-linear plastic behavior of the material. Three models were run. First model just consider the weldment as a homogeneuos material. The result showed that the fracture path was in the weld. The second model assumed the material of the weld and the base metal were different. However, because the weld metal is softer than the base metal the fracture path was further moved to the fillet weld. The fact is the real fracture path of the specimen No. 6 test was moved to the base metal due to the penetration. And it took large force to break the specimen than the FEM models mentioned above. The FEM models consider the load pattern as displacement of the
Chanter 2 Cruc. tensile tes
... r- .... ... . ....Chapter 2 Cruci. tensile test
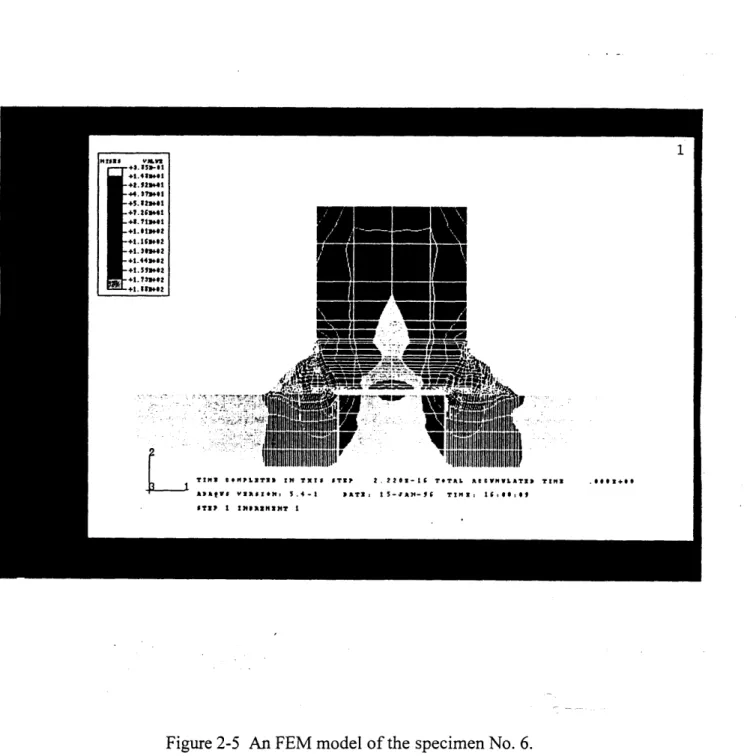
clutched end of the specimen. After this calculation, the third model which considers the HAZ hardening effect was made. The HAZ area was approximately assumed to be just one element away from the fusion line which is not very accurate in this case. However, the calculation showed a satisfactory result. Figure 2-6 shows the von Mises plastic stress
contour distribution of this model.
2.1
Conclusions
The FEM model can be used to calculate the plastic stress and strain field of the specimen in case the model is appropriately built. The consideration of the geometry of the weld contour line is crucial when the penetration is taken into account. The material properties is only an approximation. Micro scale properties of the material near the weld are needed. However, this will involve much more research than a middle scale project can afford. Due to the complexity brought by the welding process, it is still difficult to scale down the behavior of a weld. More fundamental research is needed.
ChaDter 2 Cruci. tensile test
20 mm
C~hanter 2 C~ruci. tensile test
a(E ) 450
.329.67
o0.o002
I
Stress strain curve
Figure 2-2 Computer simulated stress strain relation curve of EH36 steel. ,563.948 .0.28Z C hanter ... 2" . . .... ... . ... I -I
Chanter 2 Cruci. tensile test
Vicker's Microhardness Measurements for a Common
Shbiping Steel Welded vith an E7016 Electrode
The eld metal is relatively homogeneous does not include the weld HAZ. For more research, please refer to:
in the weld region. This behavior does not information about this microhardness
Figure 2-3 The hardness measurement of a weldment showing a narrow HAZ.
Chapter 2 Cruci. tensile test 27
-Series
-sI
Figure 2-4 The contour line measured from the specimen No. 6. I I I I I I I I I I I I I I I I I
Chanter 2 C~ruci. tensile test
Figure 2-5 An FEM model of the specimen No. 6.
hanter 2 Cruci. tensile
test--Chapter 3 Cal. of R
Chapter 3
Tearing Work Per Unit Length of the Side Fillet
Weld R,
3.1
Overview
This chapter is aimed at calculating the tearing resistance of fillet welds by
relatively small scale tests. Three-point-bending-test data of Specimen 2 and Specimen 3 were used in calculations.
As discussed in chapter 2 (Figure 2-1), tearing is one of the most important fracture modes of T-joints found in service especially during accidents. The peeling of the stiffeners from hull platings, or vice versa,is important in estimating the amount of
damage that would occur upon grounding or collision of an oil tanker. Substantial studies have been performed by the team of the MIT-Industry Tanker Safety Program. The tearing work per unit length Rc has proved to be one of the key criteria in analysis of the mechanism of the peeling of the fillet weld [Kirkov, 1994].
In the tanker safety report (TSR) #29, Kirkov performed experiments on the transversely welded beam (TWB) specimens. Specimen configuration is shown in Figure
3-1. However, this experiment requires large capacity bending machine and not intuitively simulate the tearing the base plate from the stiffener phenomenon.
Tearing work per unit length Rc was studied in this experiment. Specimen 2 and Specimen 3 which have different weld sizes were tested simply by a three point bending test of a wide plate with a reinforcement of a web joined by fillet weld. Figure 2-2 shows the configuration of the specimen. Two approached were tried to calculate the tearing work per unit length Rc. And the results are within 3% difference. This experiment was proved to be practical in studying Rc in a relatively small scale test.
Chapter 3 Cal of 14
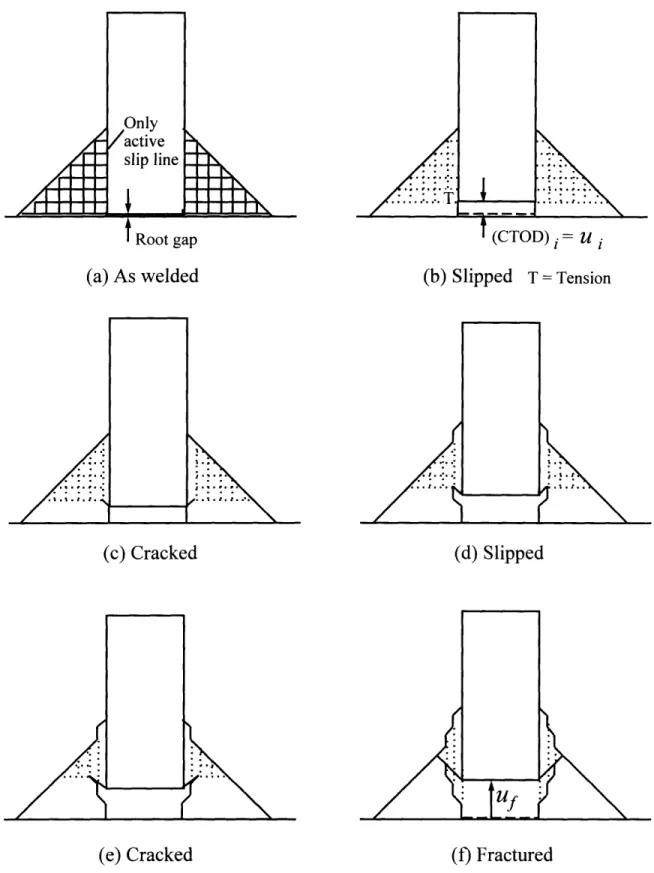
The slip line analysis is frequently used in analyzing the plastic failure problems. It is based on the ideas of the material blocks of the structures would slide along a certain orientations which the stress of shearing in the term of K reaches yield. Figure 3-3 gives the slip line fields of an idealized situation that no penetration of is made on the double fillet welded structure.
By using the slip line field theory the plastic failure path of a two-sided fillet weld may be predicted. Slip lines represent the orientations of maximum shear in a stress field, along which deformation is expected to occur. Considering a T-joint in tension and using the upper bound theorem a limit transverse load that will ensure the weld deformation can be calculated.
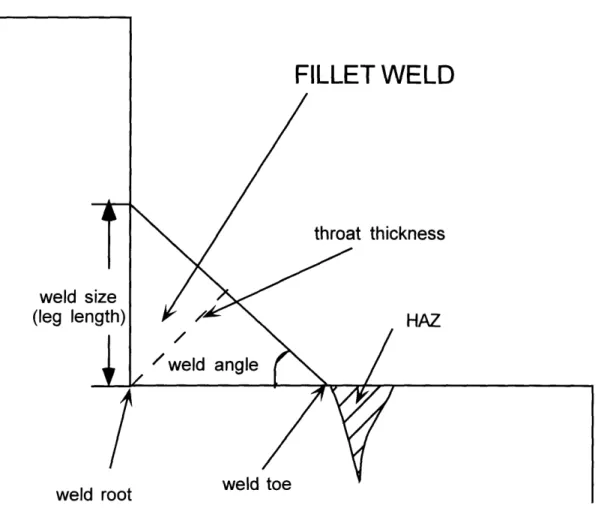
Such solutions have been obtained for homogeneous, non-hardening fillet welds with arbitrary crack tips and weld angle [McClintock, TSR 26]. For the special case of the 450 weld angle the limit load per unit length is given by
PL = 2kd , 3-1
where k is the shear strength of the weld and d is the minimum leg length (Figure 3-4). In fracture mechanics, k is approximated by: k = TS / -3, where TS is the tensile
strength of the weld metal. Experimental results have shown that a value of
k = 0.75 -TS gives a better approximation in the case of the fillet welds, reflecting the effect of plastic instability absence [Krumpen, 1983].
The tearing resistance of a fillet weld can be determined by the work required by a transverse load to cause separation of the web from the base plate, normalized per unit length of the fractured weld. Assuming negligible elasticity effects, the ideal work per unit length can be estimated as
Chanter 3 Cal. of RL
Ridea,, 1/2 PLd = kd2 . 3-2
This work is ideal, since, besides plastic sliding, fracture also takes place and slip occurs at an angle to the vertical. Assuming that cracking initiates at a displacement ui and fracture is completed at a displacement u., the fracture work per unit length ("tearing resistance") can be approximated by
Rc = PL(u, + u)/2 - Puc , 3-3
where
uc is defined as an effective critical displacement (Figure 3-3)
[McClintock, TSR26].
Regarding the peeling fracture of a double sided fillet weld the control volume of Figure 3-5 can be considered. Assuming that a critical bending moment Mc is applied, resulting to a critical curvature ic, then as an element material moves by SL the slope changes by 80. The work that the moment does is McSO = Mc~c36L. Assuming that
there is little interaction between the work to bend the plate and that to tear the weld. Then, as in McClintock, TSR 26, we have
Total work = Plate bending work + Weld tearing work,
McKcSL = fMd 8L + RcL ; M, cc = Mdr± + Rc 3-4
0 0
From this the tearing resistance can be found
Kc' MA4
Rc
=
M c - Md =
-fdM
.
3-5
0 0
Peeling fracture has been investigated based on the idea of an elastic-perfectly plastic beam glued on a rigid block. Chang et al. considered an end force loaded beam
Chanter 3 Cal. of RI
loading (Figure 3-7). Both of those works result to closed form solutions of the fracture work which can be adapted to the case of peeling fracture.
The tearing resistance of a fillet weld for an end loaded beam is
-(1- v2)bl/20y3/2pl /-2(I + 8V)b3/2C5r/2h2
3E F6o-bh2-3PI 6E 6aobh2-3PI
(11 + 16 ) 2 3/2 (1 +2v2)bay2h
36E 2 6aybh -3Plba/2 + E
36E E
3-6
where
P is the end load,
I is the length of the beam plus the crack length,
b is the half beam width, h is the half beam height
and oy, E and v the flow stress (yield strength), Young's modulus and
elastic Poisson's ratio of the beam material. The formula is valid when
2aybh -> Pl Ž -abh.
3 3-7
For the moment loaded case, which actually corresponds to that described also by McClintock in TSR26, fracture occurs under a critical moment
Mc
=
(Bh2ay)[1
--
REaY2h)
3-8Rc = (BhU,2 / E) 1- (1- Mc / Barh2),
2 2I
Chaoter 3 Cal. of R,.
where
B is the full beam width.
This formula is valid for
M c < Bcrh 2 = M,, 3-10
where
ML represents a limit bending moment where plastic collapse of the base
plate precedes fracture.
3.3
Experiment Performance
3.3.1 Specimen preparation and instrumentation
AH36 base plates of 3/8" (9.5mm) thick and the web plates of 20mm or 9.5 mm thick were cut to desired dimensions in the machining shop at MIT. The chemical composition and mechanical specifications of AH36 are listed in Table 3-1 [ABS, 1985]. Also, see Fig. 3-2 for the details of specimen dimensions. Because the ductile strength of a weld is mainly determined by the weld size and penetration, deeper penetration can give a stronger weld [Wilcox. TSR50]. In this experiment, the penetration had been
experimentally controlled by beveling the web before welding was performed. See Figure 3-8 for the beveled and unbeveled web. Weld size was controlled by applying multi-passes of welding when the specimens were fabricated. GTAW welding was applied at the Welding System Laboratory at MIT using the XMT'T 300 CC/TIG DC INVERTER ARC WELDER welding machine. The welding material used in this experiment was TGS-50 manufactured by Kobe Steel that is equivalent to AWS A5.18. Specifications of TGS-50 are also listed in Table 3-1. The specimen preparation before welding for each specimen and welding conditions are listed in Table 3-2.
Bending of the specimens was performed using the Baldwin TEG Univ. bending machine located at the Remergence Laboratory in the Department of Civil Engineering at
Chanter 3 Cal. of IR
MIT. The maximum loading capacity of this bending is 60,000 lbs. In Appendix-2, the calibration reference for the Baldwin TEG Univ. Machine-60,000 bending machine is attached. The video microscope (HI-SCOPE COMPACT MICRO VISION SYSTEM MODEL KH-2200 MDR) and a VCR video recorder were used to record and monitor the crack formation and propagation process during the tests. See the Appendix-2 for more detailed description of video microscope. Figure 3-9 shows the picture of experimental setup of three point bending with two ends simply supported by two roller.
Table 3-1 The chemical composition and mechanical specifications base metal AH-36 and TGS-50.
Base metal Weld metal
o,(N / mm2) 281 340
a,, (N / mm2) 346 470
Reduction in area (%) 61.1 36
Charpy energy absorption Not assigned 220 (-30" C) (Joules) C
(%)
0.29 max 0.080 Si(%)-
0.700 Mn (%) 0.60-0.90 1.310 P (%) - 0.011 S (%) 0.010Chanter 3 Cal. of
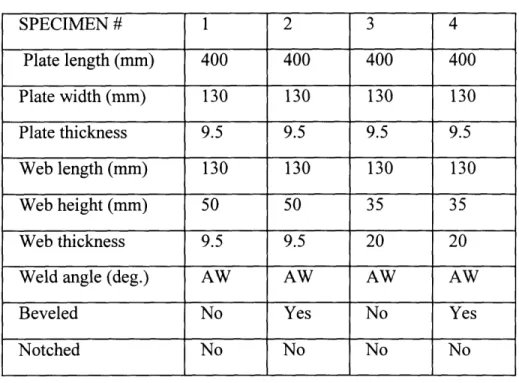
R-Table 3-2 Specimen Characteristics
* AW means as welded without any post welding machining.
3.3.2 Experimental recording
The displacements were read from the displacement gauge placed at the end of one piston arm of the bending machine. The loads were read from the meter on the bending machine. At each recording point, by pressing the timing button of the video recorder, the picture was obtained of the focused area of the specimen that was recorded at the same time as displacement and load data were being read. The crack phenomena of Specimens 2 and 3 can be schematically described in Figure 3-9. Specimens 2, 3 and 4 all sustained the first loading which means they didn't show any visible crack on the screen of video monitor through the microscope. However, Specimen 1 failed at the beginning of the first loading. A crack formed at the toe of the weld of Specimen 1, and the load dropped drastically from that point. This phenomenon can be clearly seen from the recorded load vs. displacement diagram. In Fig. 3-10, the load vs. displacement
curves of Specimen 1 and Specimen 4 were put together for comparision. The early stage load drop of Specimen 1 compared with Specimen 2, Specimen 3 and Specimen 4 clearly
SPECIMEN # 1 2 3 4 Plate length (mm) 400 400 400 400 Plate width (mm) 130 130 130 130 Plate thickness 9.5 9.5 9.5 9.5 Web length (mm) 130 130 130 130 Web height (mm) 50 50 35 35 Web thickness 9.5 9.5 20 20
Weld angle (deg.) AW AW AW AW
Beveled No Yes No Yes
Notched No No No No
Chapter 3 Cal. of It
demonstrates the crack forming in Specimen 1 at the low displacement stage. This was because the weld angle at the toe of the weld at the end of the web is about 900 and the fillet weld of Specimen 1 has a convex contour. In other words, the result was the worst weld for Specimen 1. The large geometry gradient may theoretically be considered to have an infinite concentration factor. And consequently, it caused the fillet weld crack at the early stage of the loading of Specimen 1. This explanation offered a reason to take Specimen 1 as a singular case that is beyond the scope of this study assuming people in the practical world should have the common sense to reject weldment with such an extreme convex geometry. Since Specimens 2, 3 and 4 all didn't show any crack at the surface during the first load, and the Baldwin TEG Univ. Machine 60,000 bending machine has the limitation for the displacement that didn't allow an possibility to continuously load beyond 200, a reverse load had to be applied to flatten the plates and then to apply the second load. In the real collision accident, the deformation of the plating may not need to reach 200 to get fracture. This is because in the real ship
structure, the plating is constrained by periphery as an integrated structure. Tension will be created inside the plate which will lower the critical limit load of fracture of the
weldment. In an experiment, it is hard to simulate the three dimensional (3-D) load effect. In the later part of this report, Chapter 5, the combination of bending and tension loads was tested in Specimen 7. Both Specimen 2 and Specimen 3 were found to have cracks during the second load. Specimen 4 did not show any observable crack even after the second load because it has both larger weld leg length and larger penetration which was guaranteed by multi-pass welding and beveling the web before welding.
Figure 3-11 was drawn from the video recorded data to show the observation of cracking formation and propagation procedure. In Figure 3-11, the crack started from a certain point of the root of the weld O' then went through the weld to a point of the surface of weld Os. This process was not observed by the micro video because it had been hidden beneath the weld metal before the crack broke through to the surface. However, it is safe to assume this procedure as mentioned above because from the FEM model we made we found that at the root of the fillet weld there was a large stress
Chapter 3 Cal. of It
concentration if the root gap existed. Strictly speaking, every fillet weld has root gap if it does not have complete penetration. At this moment, we still don't have the experimental method to get the inside information. In the future, further studies are needed. The crack then grew to the corner of the web point C, turned 90 0 to tear the web apart following the path sr . This particular process was well recorded and can be accurately correlated with the load and displacement recordings. By studying the portion we have good record data
on, regardless the progress of crack from point O' to point Os that we still need further
information about, the weld tearing process can be fairly well studied.
The crack propagating history from Os point to point C occurred in a very short
period of time and was unstable. Further studies on this initiation period are discussed in the next two chapters. In Report 3 of Rupture Analysis of Oil Tankers in Side Collision program, by A.F McClintock, mathematical models were built. Neglecting this unstable period which is from Os to C, the calculation was performed as described later in this chapter, Sec.3.4. A Matlab program that fulfills this calculation task is attached in Appendix-4 of this report.. The test records of loads and displacements for each specimen are listed in Appendix-3.
3.3.3 Post failure specimen examination
After the loading experiment, Specimens 2 and 3 were cut and ground for post failure analysis. The cut was made close enough to the tip of the crack such that we could measure the displacement of the web to the base plate by assuming the
measurement was close to the data of the crack tip displacement. A video microscope was applied to fulfill this measurement because it reduced the measurement error by the factor of its magnification. A ruler was put under the scope to get the scales of
measurements. Figure 3-12 shows that the displacement at the crack tip of Specimen 2 is approximately 0.46 mm. Figure 3-13 tells that the displacement at the crack tip of
Specimen 3 is about 0.32 mm. With these displacement measurements, calculations based on Elastic-plastic-Fracture mechanics theory were carried out in Sec. 3.4. below.
Chanter 3 Cal. of
R-Chapter 3 Cat of R
3.4
Calculations
3.4.1 Calculation of R, from load vs. displacement data
Two assumptions were made to carry out the calculation. First, a constant moment applied at the crack tip with the crack advancing was assumed. Secondly, The
separating base plate is considered as an continuously elongating cantilever beam. With the above two assumptions, each load was extrapolated by a second order curve
extrapolation with respect to each displacement point. for the load with respect to each displacement point. These load points are imaginary loads that could give and energy consumed by bending a continuous elongated cantilever beam as shown in Figure 3-14. Equations 3-1 is from Eqn. 3-1 la through Eqn.3-1 Id is a set of equations used to calculate the load P'i.m
Mo = Po x Lo, 3-11a
Lim ai + Lo, 3-1 lb
ai =Z Aai, 3-11c
Mi = P im x Lim, 3-11id
where
M0 is the initial moment when the crack just started,
P0 is the load when crack began to propagate to the web side weld, L0 is the initial arm length for the moment applied at the crack tip, Lim is the arm length for the moment applied at the crack tip for the imaginary ith load and displacement after crack started,
Mi is the moment applied at the crack tip for the imaginary the ith load and displacement after crack started,
ai is the crack length at the ith load and displacement after crack started, Aai is the crack growth length at the ith load and displacement after crack started,
P'im is the imaginary the ith load needed to be calculated by extrapolating.
The work Wb0 for bending a beam with crack propagating can be calculated by integrating the load-displacement curve as Eqn. 3-12
Chapter 3 Cal. of It
WhO= fP,•dc=E1P,*(c+,±+ci) . 3-12
2
ai 2
It should be stated that Mo in Eqn. 3-12 is the calculated at point O. This point can be assumed to be the point when load began to stably drop in the measured load
displacement diagram. For Example, in Figure 3-14, it is indicated by the arrow.
The imaginary work W'im can be calculated also by Eqn. 3-12 with the imaginary load Pim' vs. displacement ci. Thus, the difference between W'im and Wb0 gives the total tearing work Wtear that consumed by the crack propagating at the weld up to a certain measured length. As Eqn. 3-13 shows below
Wtear = W'im - WbO . 3-13
The tearing work per unit length which is an important criterion for judging the strength of fillet weld RC then can be calculated by Eqn. 3-14 as below
Re =Wtear /ai . 3-14
For Specimen 2, this calculation gives Re = 658 Nmm/mm, while for Specimen 3, Rc = 852 Nmm/mm. The calculation was performed by Matlab. See Appendix-4 for the programs. Figure 3-15 schematically shows the calculations of the R, using the load vs. displacement diagrams for Specimens 2 and 3.
3.4.2 Calculation of R, from post failure measurement data
McClintock, 1995, gave an model to calculate the tearing work of plastic failure by measuring the displacement uf and assuming perfect plastic for the material behavior for the weld metal. Also, the assumption of homogeneity was made for the weld metal [McClintock, TSR 56]. This offered us another approach to check our calculation results for tearing work per unit length Re. Equation 3-1 PL =2 k d, k = TS/ JF3 .and Eqn.3-3
Rc = PL(u + uf )/2 = Pu( give the calculation algorithm for the tearing work per unit
length for the fillet weld.
For Specimen 2, the leg length is 3 mm, and from the post fracture specimen, the ut +u, was measured as 0.42 mm (Fig. 3-1). For Specimen 3, the leg-length is
Chaoter 3 Cal. of R
approximately 4 mm, and the ui +uf was measured as 0.35 mm (Fig. 3-1). The calculated Rc Specimen 2 and Specimen 3 are 627 N mm/mm and 839 N mm/mm, respectively.
The reason for the lower values calculated by the post fracture analytical approach rather than by the integration method could be caused by the assumptions that the weld metal is homogenous and non-strain-hardening. The calculation from the experimental load vs. displacement curve included the strain-hardening effect for the weld metal.
3.5
Conclusions
The tearing work per unit length of the fillet weld calculated from the experiment data and post failure analysis are close to each other within 5% difference. Additionally, by using the calculation approach of load vs. displacement integration, in which bending of a continuously elongated cantilever beam is assumed as the crack tip advances, the two idealized assumptions for the material namely homogeneity and perfect plasticity
vanished. This confirms that the small scale test (three point bending of a fillet welded wide plate structure) can give fairly reasonable data. It is easier to perform than the traditional tearing test. The requirement for the ordinary bending machine is less than the huge tension machine and easier to operate. And the video microscope recording offers advantages for the new approach for doing fracture analysis experiments. For the design of the ship structure, the conclusion can be made that people can increase the tearing strength of a fillet weld by either increasing the weld metal strength (TS) or by increasing the weld size. In other words, the tearing work per unit length of fillet weld is a function of material properties and weld size. Even the data from Specimen 1 and Specimen 4 were not used in quantitative calculation, they offered qualitative criteria of the weld performance by geometry contour and size.
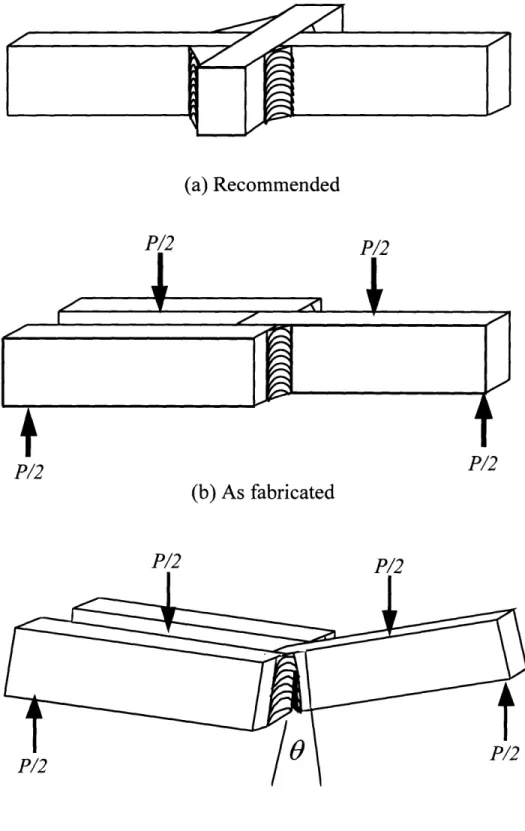
Chapter 3 Cal. of Rt (a) Recommended P/2 P/2 P/2
(b) As fabricated
P/2 (c) CrackedFigure 3-1 TWB specimen test configuration (Kirkov, TSR 29). P/2
Chapter 3 Cal. of R 42
P it
55mm
95mm 351m 115mm
5Pmm
. 130mm
1
400mm
Wide plate bending specimen dimension drawing.
Note P: Loading Position S: Supporting Position t: Web Thickness (20mm or 9.5mm)
ii
I
-.
I I I Figure 3-2Chapter 3 Cal. of IR
A
/activeslip line
t
Root gap(a) As welded
(b) Slipped T = Tension(c) Cracked (d) Slipped
(e) Cracked
(f) Fractured
Figure 3-3 Slip line fields, crack tip opening displacement for initiation, CTOD,=ui, and alternating cracking and sliding off during growth to final separation at uf.
Chanter 3 Cal. of R,
weld size
(leg length) /
/ weld angle
weld root weld toe
FILLET
WELD
throat thickness
HAZ
Figure 3-4 Geometry and definitions of a fillet weld (Sampos, 1996).
M(3g
=
Kc
SL=-
9L/pC)
Pc
(little interaction)
Mc K cSL
=
(j
KCMdr)SL
Figure 3-5 Control volume for the critical tearing work per unit length Rc in peeling. Note that an oblique crack front leads to crack growth through the weld in locally plane
strain conditions (TSR 26, McClintock, 1994).
Rc SL
Chamter 3 Cal. of IR
7
Figure 3-6 Peeling of an elastoplastic metal epoxy joint by an end force (Atkins and Mai,1987).
/ /
hi
=
, b /uu/,
LT•
Figure 3-7 Peeling of an elastoplastic metal-epoxy joint by an end couple (Chang et. al, 1972)
Chaoter 3 Cal. of R,
web
I
3mm
--- nbeveled web
Chapter 3 Cal. of R 48
specimen
supportfixture
video
Figure 3-9 Wide plate bending experiment setup.
Chanter 3 Cal. of iL 70n
6000
5000
4000
3000
2000
1000
n0
500
1000
1500
2000
2500
3000
Figure 3-10 Comparison of load vs. displacement diagrams of Specinien 1 and Specimen 4
Chapter 3 Cal. ofR_
Zoomed View
Orr: Crack originated at the root of the weld. Os: Crack appears to the surface of the weld. C : Crack propagate to the corner of the weld. S: Crack propagate to the web side fillet weld. T: Crack propagation tip at the fillet weld.
Figure 3-11 Schematic drawing of the cracking process of the specimens during tests.
Chapter 3 Cal. of R,
L ...I1
mm
a) Specimen 2 cross sectional view of the fillet weld after fracture.
1
mm
b) Displacement of the web from the base plate for specimen 2.
Figure 3-12 Post failure pictures of Specimen 2. Chapter 3 Cal. of R,
r
1 1Bl l ! i *• fP1I
1 mm
a) Specimen 3 cross sectional view of the fillet weld after fracture
1 mm
b) Displacement of the web from the base plate for specimen 3.
Figure 3-13 Post failure pictures of specimen 3.
CIL
12 r I -F I?Chapter 3 Cal. of RL
Base plate Web
P
0a) Bending moment before the crack goes to the side fi.
Base plate Web
llet
b) Bending moment after the crack goes to the side fillet
Schematic drawing bending moment of the specimen. Figure 3-14
Chapter 3 Cal. of kR
500
1000
1500
2000
2500
3000
Specimen 2
0
500
1000
1500
2000
2500
3000
Specimen 3
Figure 3-15 Specimen 2 and specimen 3 load vs. displacement curves (Mc means the constant moment).
6000
5000
4000
3000
2000
1000
n
7000
6000
5000
4000
3000
2000
1000
0
7nnChapter 4 Notch effect
Chapter 4
Strain and Stress Concentration Analysis at the
Fillet Weld Toe with Simply Supported Boundary Condition
4.1
Overview
This chapter discusses results of a study of the strain and stress concentration effect on the toe of end fillet weld with a machined notch that simulates the undercut defect. Three point bending tests of Specimen 5 and Specimen 6 with different welding angle geometries were performed.
Undercut is a common defect in fillet welds. Undercut is usually caused by either improper welding performance or by too high welding current. A severe undercut would deteriorate the mechanical performance of the structure. Figure 4-1 shows the typical undercut occurrence [TSR 56, 1996]. Figure 4-1 is a hardness distribution diagram of a fillet weld. An undercut exists at the vertical toe of the fillet weld. Due to the multiple causes for the undercut, it is hard to totally eliminate undercuts in production welds. Various non destructive test (NDT) methods can be applied to find undercut of a weld. However, most NDT tests are time consuming. And repairing welding for the defect weld is not hasty either. The purpose of this study is to point out the priority level of undercuts that may give a guidance to the manufacturer to pay more attention at the more vulnerable structure parts during welding. Or, when the NDT test is performed, more efforts should be spent to those particularly locations.
Little literature is available on the notch effect at the real weld which is subjected to large plastic deformation. The crack tip opening displacement (CTOD) test is designed for small strains. Nevertheless, in collision or grounding accidents, ships structures have had large plastic deformation before they failed. In other words, the strains at the local area of the welds in ship structures upon accidents may go far beyond the elastic strain range.
Chapter 4 Notch effect
In this chapter, by applying the available theory combining the experimental results and numerical simulation, a quantitative plastic strain value (ef) is calculated with the relation of the weld angle. See Figure 4-2 for the weld angle of specimens 5 and 6. Results show that Specimen 5 which has a welding angle of 570 sustained much less displacement compared to Specimen 6 with a smaller welding angle of 420. The FEM simulation shows that the fracture happened at e= 16% at the toe of the end fillet weld when displacements reached the failure points for both Specimen 5 and Specimen 6. See Figure 4-3 of FEM calculation result.
4.2
Theories Applied
4.2.1 Linear elastic fracture mechanics
The linear elastic fracture mechanics (LEFM) theory can be usefully applied as long as the plastic zone is small compared to the crack size. This is usually the case in materials where fracture occurs at stresses appreciably below the yield stress and under conditions of plain strain. Under conditions of general yield the plastic zone spreads through the entire cracked region. The crack will propagate if the plastic strain at the crack tip exceeds a critical value. Assuming negligible strain hardening, the stress at the crack tip hardly increases after general yield. Consequently, the fracture condition is more strain controlled. A commonly used but not strictly correct measure for the plastic strain at the crack tip is the crack tip opening displacement (CTOD). Therefore, it can be argued that fracture occurs at the exccedance of a critical CTOD [Broek, 1991].
Using a model derived by Dugdale (1960), which assumes a crack with a tip plastic field replaced by a crack with an effective length and no plasticity, the CTOD S is given by
8
= 8a nsec , 4-1
if= ( -In k'2°'a where
Chanter 4 Notch effect
a is the real crack length, o, is the yield strength,
E is the Young's modules of the material,
o is the applied stress.
Crack extension or propagation is assumed to occur when the CTOD reaches a critical value c . In the case of LEFM, the CTOD is given by
4 K 2
r Eoy
and Sc is equivalent to KX. according to Broek. The limitation of the above theory is
that it may not give good estimation when strain goes to plastic domain.
An alternative method to characterize elastic plastic fracture mechanics (EPFM) is by the use of the J-integral. This integral is defined as
4-2
J= Wdy-T c. ds, 4-3
with
W
=W(x, y)
=
W(E) =
a, d.,
,
4-4where
F is a closed contour followed counter clockwise direction in a stressed solid,
T is the tension vector (traction) perpendicular to F in the outside
direction, T = a•,,n, u is the displacement in the x-direction, ds is an element of contour line F.
![Figure 2-1 Cruciform testing specimen subject to tensile load [Wilcox,1995].](https://thumb-eu.123doks.com/thumbv2/123doknet/13943793.451926/24.918.117.745.167.811/figure-cruciform-testing-specimen-subject-tensile-load-wilcox.webp)