Mutational signature in colorectal cancer caused by
genotoxic pks
+E. coli
Cayetano Pleguezuelos-Manzano1,2,*, Jens Puschhof1,2,*, Axel Rosendahl Huber2,3,*, Arne van
Hoeck2,4, Henry M. Wood5, Jason Nomburg6,7,8, Carino Gurjao7,8, Freek Manders2,3, Guillaume
Dalmasso9, Paul B. Stege10, Fernanda L. Paganelli10, Maarten H. Geurts1,2, Joep Beumer1,
Tomohiro Mizutani1,2, Reinier van der Linden1, Stefan van Elst1, Genomics England Research
Consortium!, Janetta Top10, Rob J.L. Willems10, Marios Giannakis7,8, Richard Bonnet9,11, Phil
Quirke5, Matthew Meyerson7,8, Edwin Cuppen2,4,12,13, Ruben van Boxtel2,3,�, Hans Clevers1,2,3,� 1. Hubrecht Institute, Royal Netherlands Academy of Arts and Sciences (KNAW) and UMC Utrecht, 3584 CT Utrecht, The Netherlands. 2. Oncode Institute, Hubrecht Institute, 3584 CT Utrecht, The Netherlands.
3. The Princess Máxima Center for Pediatric Oncology, 3584 CS Utrecht, The Netherlands.
4. Center for Molecular Medicine and Oncode Institute, University Medical Centre Utrecht, Heidelberglaan 100, 3584CX, Utrecht, The Netherlands. 5. Pathology and Data Analytics, Leeds Institute of Medical Research at St James’s, University of Leeds, Leeds, LS9 7TF, UK.
6. Graduate Program in Virology, Division of Medical Sciences, Harvard Medical School, 77 Avenue Louis Pasteur, Boston, MA 02115, USA. 7. Department of Medical Oncology, Dana-Farber Cancer Institute and Harvard Medical School, Boston, Massachusetts.
8. Broad Institute of MIT and Harvard, Cambridge, Massachusetts.
9. University Clermont Auvergne, Inserm U1071, INRA USC2018, M2iSH, F-63000, Clermont-Ferrand, France. 10. Department of Medical Microbiology, University Medical Center Utrecht, Utrecht, the Netherlands. 11. Department of Bacteriology, University Hospital of Clermont-Ferrand, Clermont-Ferrand, France. 12. Hartwig Medical Foundation, Amsterdam, The Netherlands.
13. CPCT consortium, Rotterdam, The Netherlands.
! Full author list at the end of the manuscript
* Co-first author � Lead Contact
Abstract
1
Various species of the intestinal microbiota have been associated with the development
2
of colorectal cancer (CRC)1,2, yet a direct role of bacteria in the occurrence of oncogenic
3
mutations has not been established. Escherichia coli can carry the pathogenicity island
4
pks, which encodes a set of enzymes that synthesize colibactin3. This compound is
5
believed to alkylate DNA on adenine residues4,5 and induces double strand breaks in
6
cultured cells3. Here, we expose human intestinal organoids to genotoxic pks+ Escherichia
7
coli by repeated luminal injection over a period of 5 months. Whole genome sequencing
8
of clonal organoids before and after this exposure reveals a distinct mutational signature,
9
absent from organoids injected with isogenic pks-mutant bacteria. The same mutational
10
signature is detected in a subset of 5876 human cancer genomes from two independent
11
cohorts, predominantly in CRC. Our study describes a distinct mutational signature in CRC
12
and implies that the underlying mutational process directly results from past exposure to
13
bacteria carrying the colibactin-producing pks pathogenicity island.
14
The intestinal microbiome has long been suggested to be involved in colorectal cancer (CRC) 15
tumorigenesis1,2. Various bacterial species are reportedly enriched in stool and biopsies of CRC
16
patients6-9, including genotoxic strains of Escherichia coli (E. coli)3,6,10,11. The genome of these
17
genotoxic E. coli harbors a 50 kb hybrid polyketide-nonribosomal peptide synthase operon (pks, 18
also referred to as clb) responsible for the production of the genotoxin colibactin. pks+ E. coli are
19
present in a significant fraction of individuals (~20% healthy individuals, ~40% inflammatory bowel 20
disease, ~60% familial adenomatous polyposis and CRC)6,10,11. pks+ E. coli induce - amongst 21
others - interstrand crosslinks (ICLs) and double strand breaks (DSBs) in epithelial cell lines3,10– 22
12 and in gnotobiotic mouse models of CRC, in which they can also contribute to
23
tumorigenesis6,10,11. Recently, two studies have reported colibactin-adenine adducts, which are
24
formed in mammalian cells exposed to pks+ E. coli4,5. While the chemistry of colibactin’s
25
interaction with DNA is thus well-established, the outcome of this process in terms of recognizable 26
mutations remains to be determined. Recent advances in sequencing technologies and the 27
application of novel mathematical approaches allow classification of somatic mutational patterns. 28
Stratton and colleagues have pioneered a mutational signature analysis which includes the bases 29
immediately 5′ and 3′ to the single base substitution (SBS), and a number of different contexts 30
characterizing insertions and deletions (indels)13,14. More than 50 mutational signatures have thus
31
been defined in cancers. For some, the underlying causes (e.g. tobacco smoke, UV light, specific 32
genetic DNA repair defects) are known13,15,16. However, for many the underlying etiology remains
33
unclear. Human intestinal organoids, established from primary crypt stem cells17, have been
34
useful to identify underlying causes of mutational signatures18: After being exposed to a specific
35
mutational agent in culture, the organoids can be subcloned and analyzed by Whole Genome 36
Sequencing (WGS) to reveal the consequent mutational signature16,19,20.
37
In order to define the mutagenic characteristics of pks+ E. coli, we developed a co-culture protocol
38
in which a pks+ E. coli strain (originally derived from a CRC biopsy21) was microinjected into the
39
lumen of clonal human intestinal organoids22 (Fig. 1a, b). An isogenic clbQ knock-out strain,
40
incapable of producing active colibactin21,23, served as negative control. Both bacterial strains
41
were viable for at least 3 days in co-culture and followed similar growth dynamics (Fig. 1c). DSBs 42
and ICLs, visualized by γH2AX and FANCD2 immunofluorescence, were induced specifically in 43
epithelial cells exposed to pks+ E. coli (Fig. 1d, e, Extended Data Fig. 1a), confirming that pks+ E.
44
coli induced DNA damage in our model. This co-culture induced no significant viability difference
45
between organoids exposed to pks+ and pks∆clbQ E. coli, although there was a modest decrease 46
when compared to the dye-only injected organoids (Extended Data Fig. 1b, c).We then performed 47
repeated injections (with pks+ E. coli, pks∆clbQ E. coli or dye-only) into single
derived organoids, in order to achieve long-term exposure over a period of 5 months. 49
Subsequently, sub-clonal organoids were established from individual cells extracted from the 50
exposed organoids. For each condition, three subclones were subjected to WGS (Fig. 2a). We 51
also subjected the original clonal cultures to WGS to subtract the somatic mutations that were 52
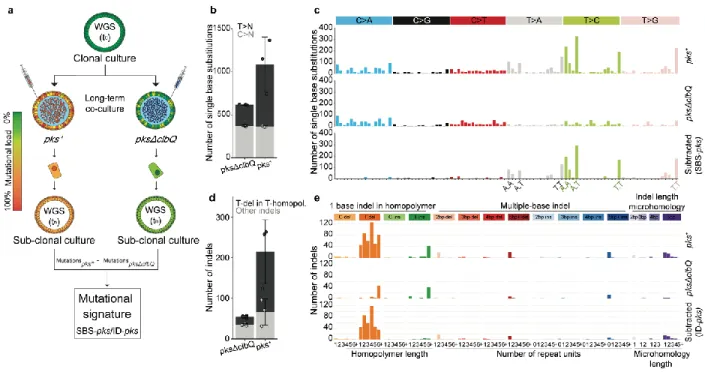
already present before co-culture. Organoids exposed to pks+ E. coli presented increased SBS
53
levels compared to pks∆clbQ, with a bias towards T>N substitutions (Fig. 2b). These T>N 54
substitutions occurred preferentially at ATA, ATT and TTT (of which the middle base is mutated). 55
From this, we defined a pks-specific single base substitution signature (SBS-pks; Fig. 2c). This 56
mutational signature was not observed in organoids exposed to pks∆clbQ E. coli or dye (Fig. 2b, 57
c, Extended Data Fig. 2a-c), proving this to be a direct consequence of the pks+ E. coli exposure. 58
Furthermore, exposure to pks+ E. coli induced a characteristic small indel signature (ID-pks),
59
which was characterized by single T deletions at T homopolymers (Fig. 2d, e, Extended Data Fig. 60
2d-f). SBS-pks and ID-pks were replicated in an independent human intestinal organoid line 61
(Extended Data Fig. 3a-d; SBS cosine similarity = 0.77; ID cosine similarity = 0.93) and with a 62
clbQ-knockout E.coli strain recomplemented with the clbQ locus (pksΔclbQ:clbQ) (Extended Data
63
Fig. 3e-h; SBS cosine similarity = 0.95; ID cosine similarity = 0.95). 64
Next, we asked if the SBS-pks and ID-pks mutations were characterized by other recurrent 65
patterns. First, the assessed DNA stretch was extended beyond the nucleotide triplet. This 66
uncovered the preferred presence of an adenine residue 3bp upstream to the mutated SBS-pks 67
T>N site (Fig. 3a). Similarly, mutations that contributed to the ID-pks signature in poly-T stretches 68
showed an enrichment of adenines immediately upstream of the affected poly-T stretch (Fig. 3b). 69
Intriguingly, the lengths of the adenine stretch and the T-homopolymer were inversely correlated, 70
consistently resulting in a combined length of 5 or more A/T nucleotides (Extended Data Fig. 4a). 71
While SBS-pks and ID-pks are the predominant mutational outcomes of colibactin exposure, we 72
also observed longer deletions at sites containing the ID-pks motif in organoids treated with pks+
73
E. coli (Fig. 3c). Additionally, the SBS-pks signature exhibited a striking transcriptional strand bias
74
(Fig. 3d, e). We speculate that these observations reflect preferential repair of alkylated 75
adenosines on the transcribed strand by transcription-coupled nucleotide excision repair. These 76
features clearly distinguish the pks signature from published signatures of alkylating agents or 77
other factors19.
78
We then assessed if the experimentally deduced SBS-pks and ID-pks signatures occur in human 79
tumors by interrogating WGS data from a Dutch collection of 3668 solid cancer metastases24. The
80
mutations a cancer cell has acquired at its primary site will be preserved even in metastases, so 81
that these provide a view on the entire mutational history of a tumor. We first performed non-82
negative matrix factorization (NMF) on genome-wide mutation data obtained from 496 CRC 83
metastases in this collection. Encouragingly, this unbiased approach identified an SBS signature 84
that highly resembled SBS-pks (cosine similarity = 0.95; Extended Data Fig. 5a, b). We then 85
determined the contribution of SBS-pks and ID-pks to the mutations of each sample in the cohort. 86
This analysis revealed a strong enrichment of the two pks signatures in CRC-derived metastases 87
when compared to all other cancer types (Fisher’s exact test p-value < 0.0001, Extended Data 88
Table 1), as is displayed for SBS-pks in Figure 4a and for ID-pks in Figure 4b. We noted 7.5% 89
SBS-pks, 8.8% ID-pks and 6.25% SBS/ID-pks high samples when applying a cutoff contribution 90
value at 0.05 (Extended Data Table 1, Fig. 4c). As expected, the SBS-pks and ID-pks signatures 91
were positively correlated in this metastasis dataset (R² = 0.46 (all samples); R2 = 0.70
(CRC-92
only); Fig. 4c), in line with their co-occurrence in our in vitro data set. The longer deletions at ID-93
pks sites were also found to co-occur with SBS-pks and ID-pks (Fig. 4e, f). Additionally, we
94
evaluated the levels of the SBS-pks or ID-pks mutational signatures in an independent cohort, 95
generated in the framework of the Genomics England 100,000 Genomes Project. This dataset is 96
comprised of WGS data from 2208 CRC tumors, predominantly of primary origin. SBS-pks and 97
ID-pks were enriched in 5.0% and 4.4% of patients respectively, while 44 samples were high in 98
both SBS-pks and ID-pks (Fig. 4d). The relative contribution of both pks-signatures correlated 99
with an R² of 0.35 (Fig. 4d). 100
Finally, we also investigated to what extent the pks signatures can cause oncogenic mutations. 101
To this end, we investigated the most common driver mutations found in 7 CRC patient cohorts25
102
for hits matching the extended SBS-pks or ID-pks target motifs (Fig. 3a, b). This analysis revealed 103
that 112 out of 4,712 (2.4%) CRC driver mutations matched the colibactin target motif 104
(Supplementary Table 1). APC, the most commonly mutated gene in CRC, contained the highest 105
number of mutations matching SBS-pks or ID-pks target sites, with 52 out of 983 driver mutations 106
(5.3%) matching the motifs (Fig. 4g). We then explored the mutations of the 31 SBS/ID-pks high 107
CRC metastases from the HMF cohort for putative driver mutations matching the extended motif. 108
In total, this approach detected 209 changes in protein coding sequences (displayed in 109
Supplementary Table 2). Remarkably, an identical APC driver mutation matching the SBS-pks 110
motif was found in two independent donors (Fig. 4h). 111
While this study was in revision, an article26 was published describing the derivation of mutational
112
signatures from healthy human colon crypts. Stratton c.s. note the co-occurrence of two 113
mutational signatures in subsets of crypts from some of the subjects. These signatures were 114
termed SBS-A and ID-A. The authors derived hierarchical lineages of the sequenced crypts, 115
which allowed them to conclude that the -unknown- mutagenic agent was active only during early 116
childhood. Intriguingly, SBS-A and ID-A closely match SBS-pks and ID-pks, respectively. Our 117
data imply that pks+ E. coli is the mutagenic agent that is causative to the SBS-A and ID-A 118
signatures observed in healthy crypts. We assessed if the SBS-pks mutational signature 119
contributed early to the mutational load of metastatic samples from the Dutch cohort by evaluating 120
their levels separately in clonal (pre-metastasis) or non-clonal (post-metastasis) mutations. The 121
accumulation of SBS-pks and ID-pks at the primary tumor site or even earlier was substantiated 122
by the abundant presence of SBS-pks in clonal mutations in the cohort (Extended Data Fig. 5c). 123
In addition to CRCs, one head and neck- and three urinary tract-derived tumors from this cohort 124
also displayed a clear SBS-pks and ID-pks signature (Fig. 4c). Both tissues have been described 125
as sites of E. coli infection27–29. This rare occurrence of the pks signatures in non-CRC tumors 126
was substantiated by a preprint report30 of signatures closely resembling SBS-pks and ID-pks in
127
an oral squamous cell carcinoma patient. 128
The distinct motifs at sites of colibactin-induced mutations may serve as a starting point for deeper 129
investigations into the underlying processes. Evidence is accumulating that colibactin forms 130
interstrand crosslinks between two adenosines4,5,12, and our data imply a distance of 3-4 bases
131
between these adenosines. These crosslinks formed by a bulky DNA adduct could be resolved in 132
different ways, including induction of DSBs, Nucleotide Excision Repair or translesion synthesis, 133
which in turn could result in various mutational outcomes. While our study unveils single base 134
substitutions and deletions as a mutational consequence, the underlying mechanisms will need 135
to be elucidated in more detailed DNA-repair studies. 136
In summary, we find that prolonged exposure of wild-type human organoids to genotoxic E. coli 137
allows the extraction of a unique SBS and indel signature. As organoids do not model 138
immune/inflammation effects or other microenvironmental factors, this provides evidence for 139
immediate causality between colibactin and mutations in the host epithelial cells. The adenine-140
enriched target motif is in agreement with the proposed mode of action of colibactin’s ‘double-141
warhead’ attacking closely spaced adenine residues4,5,12. The pronounced sequence specificity
142
reported here may inspire more detailed investigations on the interaction of colibactin with specific 143
DNA contexts. As stated above, Stratton and colleagues26 likely describe SBS-pks and ID-pks
mutational signatures of the same etiology in primary human colon crypts. This agrees with the 145
notion that pks+ E. coli-induced mutagenesis indeed occurs in the healthy colon of individuals that 146
harbor genotoxic E. coli strains31 and that such individuals may be at an increased risk of
147
developing CRC. The small number of pks signature-positive urogenital and head-and-neck 148
cancer cases suggests that pks+ bacteria act beyond the colon. Intriguingly, presence of the pks 149
island in another strain of E. coli, Nissle 1917, is closely linked to its probiotic effect32. This strain
150
has been investigated for decades for diverse disease indications33. Our data suggest that E. coli
151
Nissle 1917 may induce the characteristic SBS/ID-pks mutational patterns. Future research 152
should elucidate if this is the case in vitro, and in patients treated with pks+ bacterial strains. This 153
study implies that detection and removal of pks+ E. coli, as well as re-evaluation of probiotic strains 154
harboring the pks island, could decrease the risk of cancer in a large group of individuals. 155
156
METHODS 157
158
Human material and organoid cultures
159
Ethical approval was obtained from the ethics committees of the University Medical Center 160
Utrecht, Hartwig Medical Foundation and Genomics England. Written informed consent was 161
obtained from patients. All experiments and analyses were performed in compliance with relevant 162
ethical regulations. 163
Organoid culture
164
Clonal organoid lines were derived and cultured as described previously16,17. In brief, wild type
165
human intestinal organoids (clonal lines ASC-5a and ASC-6a, previously used in Blokzijl et al.,34)
166
were cultured in domes of Cultrex Pathclear Reduced Growth Factor Basement Membrane 167
Extract (BME) (3533-001, Amsbio) covered by medium containing Advanced DMEM/F12 (Gibco), 168
1x B27, 1x Glutamax, 10 mmol/L HEPES, 100 U/mL Penicillin-Streptomycin (all Thermo-Fisher), 169
1.25 mM N-acetylcysteine, 10 µM Nicotinamide, 10 µM p38 inhibitor SB202190 (all Sigma-170
Aldrich) and the following growth factors: 0.5 nM Wnt Surrogate-Fc Fusion Protein, 2% Noggin 171
conditioned medium (both U-Protein Express), 20% Rspo1 conditioned medium (in-house), 50 172
ng/mL EGF (Peprotech), 0.5 µM A83-01, 1 µM PGE2 (both Tocris). For derivation of clonal lines, 173
cells were FACS sorted and grown at a density of 50 cells/µl in BME. 10 µM ROCK inhibitor Y-174
27632 (Abmole, M1817) was added for the first week of growth. Upon reaching a size of >100 µm 175
diameter, organoids were picked and transferred to one well per organoid. All organoid lines were 176
regularly tested to rule out mycoplasma infection and authenticated using SNP profiling. 177
Organoid bacteria co-culture
178
The genotoxic pks+ E. coli strain was previously isolated from a CRC patient and isogenic 179
pksΔclbQ knock out and pksΔclbQ:clbQ recomplemented strains were generated based on this
180
strain21. Bacteria were initially cultured in Advanced DMEM (Gibco) supplemented with Glutamax
181
and HEPES to an O.D. of 0.4. They were then microinjected into the lumen of organoids as 182
previously described22,35. Bacteria were injected at a multiplicity of infection of 1 together with
183
0.05% (w/v) FastGreen dye (Sigma) to allow tracking of injected organoids. At this point, 5 µg/mL 184
of the non-permeant antibiotic Gentamicin were added to the media to prevent overgrowth of 185
bacteria outside the organoid lumen. Cell viability was assessed as follows: Organoids were 186
harvested after 1, 3 or 5 days (bacteria were removed by primocin treatment at day 3) of co-187
culture in cold DMEM (Gibco) and incubated in TrypLE Express (Gibco) at 37°C for 5 minutes 188
with repeated mechanical shearing. Single cells were resuspended in DMEM with added DAPI, 189
incubated on ice for at least 15 minutes and assessed for viability on a BD FACS CantoTM. Cells
190
positive for DAPI were considered dead, while cells maintaining DAPI exclusion were counted as 191
viable. Bacterial growth kinetics were assessed by harvesting, organoid dissociation with 0.5% 192
saponin for 10 minutes and re-plating of serial dilutions on LB plates. Colony forming units were 193
quantified after overnight culture at 37ºC. E. coli were killed with 1x Primocin (InvivoGen) after 3
194
days of co-culture, after which organoids were left to recover for 4 days before being passaged. 195
When the organoids reached a cystic stage again (typically after 2-3 weeks), the injection cycle 196
was repeated. This procedure was repeated 5 times (3 times for ASC Clone 6-a and the clbQ 197
recomplementation experiment in ASC Clone 5-a) to nivellate injection heterogeneity and ensure 198
accumulation of enough mutations for reliable signature detection. 199
200
Whole-mount organoid immunofluorescence, DNA damage quantification and scanning
201
electron microscopy
202
Organoids co-cultured with pks+/pksΔclbQ E. coli21 were collected in Cell Recovery Solution
203
(Corning) and incubated at 4ºC for 30 minutes with regular shaking in order to free them from 204
BME. For FANCD2 staining, organoids were pre-permeabilized with 0.2% Triton-X (Sigma) for 10 205
minutes at room temperature. Then, organoids were fixed in 4% formalin overnight at 4ºC. 206
Subsequently, organoids were permeabilized with 0.5% Triton-X (Sigma), 2% donkey serum 207
(BioRad) in PBS for 30 minutes at 4ºC and blocked with 0.1% Tween-20 (Sigma) and 2% donkey 208
serum in PBS for 15 minutes at room temperature. Organoids were incubated with mouse anti-209
γH2AX (Millipore; clone JBW301; 1:1000 dilution) or rabbit anti-FANCD2 (affinity purified in Pace 210
et al.36; 1mg/ml) primary antibody overnight at 4ºC. Then, organoids were washed 4 times with
211
PBS and incubated with either secondary goat anti-mouse AF-647 (Thermo Fisher, catalog 212
number A-21235, 1:500 dilution) or goat anti-rabbit AF-488 (Life Technologies, catalog number 213
A21206, 1:500 dilution) antibodies, respectively, for 3h at room temperature in the dark and 214
washed again with PBS. Organoids were imaged using an SP8 confocal microscope (Leica). 215
Fluorescent microscopic images of γH2AX foci were quantified as follows: Nuclei were classified 216
as containing either 0 or one or more foci. The fraction of nuclei containing foci over all nuclei is 217
displayed as one datapoint per organoid. Organoids co-cultured with bacteria for 24h were 218
harvested as described above and processed for scanning electron microscopy as previously 219
described35.
220
WGS and read alignment
221
For WGS, clonal and subclonal cultures were generated for each condition. From these clonal 222
cultures DNA was isolated using the DNeasy Blood and Tissue Kit (Qiagen) using manufacturer’s 223
instructions. Illumina DNA libraries were prepared using 50 ng of genomic DNA isolated from the 224
(sub-)clonal cultures isolated using TruSeq DNA Nano kit. The parental ASC 5a clone was 225
sequenced on a HiSeq XTEN instrument at 30x base coverage. All other samples were 226
sequenced using an Illumina Novaseq 6000 with 30x base coverage. Reads were mapped
227
against the human reference genome version GRCh37 by using Burrows-Wheeler Aligner37
228
(BWA) version v0.7.5 with settings bwa mem -c 100 -M. Sequences were marked for duplicates 229
using Sambamba (v0.4.732) and realigned using GATK IndelRealigner (GATK version 3.4-46). 230
The full description and source code of the pipeline is available at
231
https://github.com/UMCUGenetics/IAP. 232
Mutation calling and filtration
233
Mutations were called using GATK Haplotypecaller (GATK version 3.4-46) and GATK 234
Queue producing a multi-sample Vcf file20. The quality of the variants was evaluated usingGATK
235
VariantFiltration v3.446 using the following settings: snpFilterName SNP_LowQualityDepth -236
snpFilterExpression "QD < 2.0" -snpFilterName SNP_MappingQuality -snpFilterExpression "MQ 237
< 40.0" -snpFilterName SNP_StrandBias -snpFilterExpression "FS > 60.0" -snpFilterName 238
SNP_HaplotypeScoreHigh -snpFilterExpression "HaplotypeScore > 13.0" -snpFilterName 239
SNP_MQRankSumLow -snpFilterExpression "MQRankSum < -12.5" -snpFilterName
240
SNP_ReadPosRankSumLow -snpFilterExpression "ReadPosRankSum < -8.0" -snpFilterName 241
SNP_HardToValidate snpFilterExpression "MQ0 >= 4 && ((MQ0 / (1.0 * DP)) > 0.1)" -242
snpFilterName SNP_LowCoverage -snpFilterExpression "DP < 5" -snpFilterName
243
SNP_VeryLowQual snpFilterExpression "QUAL < 30" snpFilterName SNP_LowQual -244
snpFilterExpression "QUAL >= 30.0 && QUAL < 50.0 " snpFilterName SNP_SOR -245
snpFilterExpression "SOR > 4.0" cluster 3 window 10 indelType INDEL indelType MIXED -246
indelFilterName INDEL_LowQualityDepth -indelFilterExpression "QD < 2.0" -indelFilterName 247
INDEL_StrandBias -indelFilterExpression "FS > 200.0" -indelFilterName
248
INDEL_ReadPosRankSumLow -indelFilterExpression "ReadPosRankSum < -20.0"
-249
indelFilterName INDEL_HardToValidate -indelFilterExpression "MQ0 >= 4 && ((MQ0 / (1.0 * DP)) 250
> 0.1)" -indelFilterName INDEL_LowCoverage -indelFilterExpression "DP < 5" -indelFilterName 251
INDEL_VeryLowQual indelFilterExpression "QUAL < 30.0" indelFilterName INDEL_LowQual -252
indelFilterExpression "QUAL >= 30.0 && QUAL < 50.0" indelFilterName INDEL_SOR -253
indelFilterExpression "SOR > 10.0. 254
Somatic single base substitution and indel filtering
255
To obtain high confidence catalogues of mutations induced during culture, we applied extensive 256
filtering steps previously described by Jager et al.20. First, only variants obtained by GATK
257
VariantFiltration with a GATK phred-scaled quality score ≥ 100 for single base substitutions and 258
≥ 250 for indels were selected. Subsequently, we only considered variants with at least 20x read 259
coverage in control and sample. We additionally filtered base substitutions with a GATK genotype 260
score (GQ) lower than 99 or 10 in WGS(tn) or WGS(t0), respectively. Indels were filtered when
261
GQ scores were higher than 60 WGS(tn) or 10 in WGS(t0). All variants were filtered against the
262
Single Nucleotide Polymorphism Database v137.b3730, from which SNPs present in the 263
COSMICv76 database were excluded. To exclude recurrent sequencing artefacts, we excluded 264
all variants variable in at least three individuals in a panel of bulk-sequenced mesenchymal 265
stromal cells38. Next, all variants present at the start of co-culture (denominated WGS(t
0) in Fig.
266
2a) were filtered from those detected in the clonal pks+ E. coli, pksΔclbQ E. coli co-cultures
267
(denominated WGS(tn) in Fig. 2a) or dye culture. Indels were only selected when no called
268
variants in WGS(t0) were present within 100bp of the indel and if not shared in WGS(t0). In
269
addition, both indels and SNVs were filtered for the additional parameters: mapping quality (MQ) 270
of at least 60 and a variant allele (VAF) of 0.3 or higher to exclude variants obtained during the 271
clonal step. Finally, all multi-allelic variants were removed. Scripts used for filtering single base 272
substitutions (SNVFIv1.2) and indels (INDELFIv1.5) are deposited on
273
https://github.com/ToolsVanBox/. 274
Mutational profile analysis
275
In order to extract mutational signatures from the high-quality mutational catalogues after filtering, 276
we used the R package “MutationalPatterns” to obtain 96-trinucleotide single base substitution 277
and indel subcategory counts for each clonally cultured sample39 (Extended Data Fig. 1a, d). In
278
order to obtain the additional mutational effects induced by pks+ E. coli (SBS and ID) we pooled
279
mutation numbers for each culture condition (pksΔclbQ and pks+), and subtracted mutational 280
counts of pksΔclbQ from pks+ (Fig. 2c, e, Extended Data Fig 2b, d). For the clones exposed to 281
pksΔclbQ:clbQ, we subtracted relative levels of the pksΔclbQ mutations in the same organoid
282
line. This enabled us to correct for the background of mutations induced by pksΔclbQ E. coli and 283
injection dye. To determine transcriptional strand bias of mutations induced during pks+ E. coli
284
exposure, we selected all single base substitutions within gene bodies and checked whether the 285
mutated C or T was located on the transcribed or non-transcribed strand. We defined the 286
transcribed area of the genome as all protein coding genes based on Ensembl v75 (GCRh37)40
287
and included introns and untranslated regions. The extended sequence context around mutation 288
sites was analyzed and displayed using an in-house script (“extended_sequence_context.R”). 2-289
bit sequence motifs were generated using the R package “ggseqlogo”. Cosine similarities 290
between indel and single-base substitution profiles were calculated using the function 291
‘cos_sim_matrix’ from the MutationalPatterns package. 292
293
Analysis of clonal mutations in the SBS/ID-pks high CRC tumors
294
From the 31 SBS/ID-pks high CRC tumors clonal and subclonal single base substitutions were 295
defined to contain a purity/ploidy adjusted allele-fraction (PURPLE_AF) of < 0.4 or > 0.2, 296
respectively41. Signature re-fitting on both fractions was performed with the same signatures as
297
described above for the initial re-fitting of the HMF cohort. 298
Analysis of >1bp deletions matching pks-motif
299
For each > 1 bp T-deletion observed in organoid clones or the HMF cohort, the sequence of the 300
deleted bases and 5 base-pair flanking regions was retrieved using the R function “getSeq” from 301
the package “BSgenome”. Retrieved sequences were examined for the presence of a 5 base-302
pair motif matching the pks-motifs identified (Extended Data Fig. 4a) “AAAAT”, “AAATT, 303
“AATTT” or “ATTTT”. Sequences containing one or more matches with the motifs were marked 304
as positive for containing the motif. 305
NMF extraction of signatures from HMF Colorectal cancer cohort
306
In order to identify SBS-pks in an unbiased manner, signature extraction was performed on all 307
496 samples from colorectal primary tumors present in the HMF metastatic cancer database24.
308
All variants containing the ‘PASS’ flag were used for analysis. Signature extraction was performed 309
using non-negative matrix factorization (NMF), using the R package “MutationalPatterns” function 310
“extract_signatures” with the following settings: rank = 17, nrun = 200. The cosine similarity of the 311
extracted signature matching SBS-pks was re-fitted to the COSMIC SigProfiler signatures and 312
SBS-pks was determined as described above to determine similarity (Extended Data Fig. 5a, b). 313
Signature re-fitting on HMF cohort
314
Mutation catalogues containing somatic variants processed according to Priestley et al, 2019 315
were obtained from the HMF. All variants containing the ‘PASS’ flag in the HMF dataset were 316
selected. Single base trinucleotide and indel subcategory counts were extracted using the R 317
package “MutationalPatterns” and in house-written R scripts respectively. In order to determine 318
the contribution of SBS-pks and ID-pks to these mutational catalogues, we re-fitted the COSMIC 319
SigProfiler mutational SBS and ID signatures v3 (https://cancer.sanger.ac.uk/cosmic/signatures/), 320
in combination with SBS-pks and ID-pks, to the mutational catalogues using the 321
MutationalPatterns function “fit_to_signatures”. Signatures marked as possible sequencing 322
artefacts were excluded from the re-fitting. Cutoff values for high SBS-pks and ID-pks levels were 323
manually set at 5%, each. Numbers of SBS/ID-pks positive samples were compared between 324
CRC and other cancer types by Fisher’s exact test (two-tailed). 325
Mutation calling and filtration (Genomics England cohort)
326
As part of the Genomics England 100,000 Genomes Project (main programme version 7)42
327
standard pipeline, 2208 CRC genomes were sequenced on the Illumina HiSeq X platform. Reads 328
were aligned to the human genome (GRCh38) using the Illumina iSAAC aligner 03.16.02.143.
329
Mutations were called using Strelka and filtered in accordance with the HMF dataset24.
330
Before examining somatic mutations for the pks mutational signature, mutation calls were first 331
subjected to additional filtering steps similar to those previously described24. All calls present in
332
the matched normal sample were removed. The calls were split into high and low confidence 333
genomic regions according to lists available at
ftp://ftp-334
trace.ncbi.nlm.nih.gov/giab/ftp/release/NA12878_HG001/NISTv3.3.1/GRCh38/. Somatic
mutation calls in high confidence regions were passed with a somatic score (QSI or QSS) of 10, 336
whilst calls in low confidence regions were passed with a score of 20. A pool of 200 normal 337
samples was constructed, and any calls present in three or more normal samples were removed. 338
Any groups of single nucleotide variants within 2bp were considered to be miss-called multiple 339
nucleotide variants and were removed. Finally, all calls had to pass the Strelka “PASS” filter. 340
Mutational signatures were then analysed as described above for the HMF cohort. 341
342
Detection of pks-signature mutations in protein coding regions
343
Mutations were extracted from the 31 SBS/ID-pks high CRC-samples. Exonic regions were 344
defined as all autosomal exonic regions reported in Ensembl v75 (GCRh37)40. All extracted CRC
345
mutations were filtered for localization in exonic regions using the Bioconductor packages 346
“GenomicRanges”44 and “BSgenome”. In a second filtering step, the sequence context of
347
mutations was required to match the following criteria: 348
For SBS-pks: T>N mutation, A or T directly upstream and downstream, A 3 bases upstream. 349
For ID-pks: Single T deletion, A directly upstream, a stretch of an A homopolymer followed by a 350
T polymer with combined length of at least 5 nucleotides, but no stretch exceeding 10 nucleotides 351
in length. Mutations passing both filter steps were further filtered for presence of a predicted 352
“HIGH” or “MODERATE” score in the transcript with highest impact score according to the 353
reported SnpEff annotation. 354
To assess the mutagenic impact of pks, we obtained all mutations from the 50 highest mutated 355
genes in CRC from IntOGen25, release 2019.11.12. Mutations were filtered matching the pks motif
356
according to the sequence criteria stated above apart from the predicted impact score. Mutations 357
in APC were plotted using the R package “rtrackViewer”, using only exonic mutations. 358
359
REFERENCES 360
1. Allen, J. & Sears, C. L. Impact of the gut microbiome on the genome and epigenome of 361
colon epithelial cells: contributions to colorectal cancer development. Genome Med. 11, 11 362
(2019). 363
2. Gagnaire, A., Nadel, B., Raoult, D., Neefjes, J. & Gorvel, J.-P. Collateral damage: 364
insights into bacterial mechanisms that predispose host cells to cancer. Nat. Rev. Microbiol. 365
15, 109–128 (2017).
366
3. Nougayrède, J.-P. et al. Escherichia coli Induces DNA Double-Strand Breaks in
367
Eukaryotic Cells. Science 313, 848–851 (2006). 368
4. Wilson, M. R. et al. The human gut bacterial genotoxin colibactin alkylates DNA. Science
369
363, eaar7785 (2019).
370
5. Xue, M. et al. Structure elucidation of colibactin and its DNA cross-links. Science 365, 371
eaax2685 (2019). 372
6. Dejea, C. M. et al. Patients with familial adenomatous polyposis harbor colonic biofilms 373
containing tumorigenic bacteria. Science 359, 592–597 (2018). 374
7. Bullman, S. et al. Analysis of Fusobacterium persistence and antibiotic response in
375
colorectal cancer. Science 358, 1443–1448 (2017). 376
8. Kostic, A. D. et al. Fusobacterium nucleatum potentiates intestinal tumorigenesis and
377
modulates the tumor-immune microenvironment. Cell Host Microbe 14, 207–215 (2013). 378
9. Wirbel, J. et al. Meta-analysis of fecal metagenomes reveals global microbial signatures
379
that are specific for colorectal cancer. Nat. Med. 25, 679 (2019). 380
10. Buc, E. et al. High prevalence of mucosa-associated E. coli producing cyclomodulin and
381
genotoxin in colon cancer. PloS One 8, e56964 (2013). 382
11. Arthur, J. C. et al. Intestinal Inflammation Targets Cancer-Inducing Activity of the 383
Microbiota. Science 338, 120–123 (2012). 384
12. Bossuet-Greif, N. et al. The Colibactin Genotoxin Generates DNA Interstrand Cross-385
Links in Infected Cells. mBio 9, (2018). 386
13. Alexandrov, L. B. et al. The Repertoire of Mutational Signatures in Human Cancer.
387
Nature 578, 94—101 (2020).
388
14. Alexandrov, L. B. et al. Signatures of mutational processes in human cancer. Nature
389
500, 415–421 (2013).
390
15. Nik-Zainal, S. et al. Mutational processes molding the genomes of 21 breast cancers.
391
Cell 149, 979–993 (2012).
392
16. Drost, J. et al. Use of CRISPR-modified human stem cell organoids to study the origin of
393
mutational signatures in cancer. Science 358, 234–238 (2017). 394
17. Sato, T. et al. Long-term expansion of epithelial organoids from human colon, adenoma,
395
adenocarcinoma, and Barrett’s epithelium. Gastroenterology 141, 1762–1772 (2011). 396
18. Tuveson, D. & Clevers, H. Cancer modeling meets human organoid technology. Science
397
364, 952–955 (2019).
398
19. Kucab, J. E. et al. A Compendium of Mutational Signatures of Environmental Agents.
399
Cell 177, 821-836.e16 (2019).
400
20. Jager, M. et al. Measuring mutation accumulation in single human adult stem cells by
401
whole-genome sequencing of organoid cultures. Nat. Protoc. 13, 59–78 (2018). 402
21. Cougnoux, A. et al. Bacterial genotoxin colibactin promotes colon tumour growth by
403
inducing a senescence-associated secretory phenotype. Gut 63, 1932–1942 (2014). 404
22. Bartfeld, S. et al. In Vitro Expansion of Human Gastric Epithelial Stem Cells and Their 405
Responses to Bacterial Infection. Gastroenterology 148, 126-136.e6 (2015). 406
23. Li, Z.-R. et al. Divergent biosynthesis yields a cytotoxic aminomalonate-containing
407
precolibactin. Nat. Chem. Biol. 12, 773–775 (2016). 408
24. Priestley, P. et al. Pan-cancer whole-genome analyses of metastatic solid tumours.
409
Nature 575, 210–216 (2019).
410
25. Gonzalez-Perez, A. et al. IntOGen-mutations identifies cancer drivers across tumor
411
types. Nat. Methods 10, 1081–1082 (2013). 412
26. Lee-Six, H. et al. The landscape of somatic mutation in normal colorectal epithelial cells. 413
Nature 574, 532–537 (2019).
414
27. McLellan, L. K. & Hunstad, D. A. Urinary Tract Infection: Pathogenesis and Outlook. 415
Trends Mol. Med. 22, 946–957 (2016).
416
28. Zawadzki, P. J. et al. Identification of infectious microbiota from oral cavity environment 417
of various population group patients as a preventive approach to human health risk factors. 418
Ann. Agric. Environ. Med. 23, 566–569 (2016).
419
29. Banerjee, S. et al. Microbial Signatures Associated with Oropharyngeal and Oral
420
Squamous Cell Carcinomas. Sci. Rep. 7, 4036 (2017). 421
30. Boot, A. et al. Mutational signature analysis of Asian OSCCs reveals novel mutational
422
signature with exceptional sequence context specificity. bioRxiv 368753 (2018) 423
doi:10.1101/368753. 424
31. Payros, D. et al. Maternally acquired genotoxic Escherichia coli alters offspring’s 425
intestinal homeostasis. Gut Microbes 5, 313–512 (2014). 426
32. Olier, M. et al. Genotoxicity of Escherichia coli Nissle 1917 strain cannot be dissociated 427
from its probiotic activity. Gut Microbes 3, 501–509 (2012). 428
33. Beimfohr, C. A Review of Research Conducted with Probiotic E. coli Marketed as
429
Symbioflor. Int J Bacteriol 2016, 3535621 (2016). 430
431
REFERENCES FROM METHODS SECTION 432
34. Blokzijl, F. et al. Tissue-specific mutation accumulation in human adult stem cells during 433
life. Nature 538, 260–264 (2016). 434
35. Heo, I. et al. Modelling Cryptosporidium infection in human small intestinal and lung 435
organoids. Nat. Microbiol. 3, 814–823 (2018). 436
36. Pace, P. et al. FANCE: the link between Fanconi anaemia complex assembly and
437
activity. EMBO J. 21, 3414–3423 (2002). 438
37. Li, H. & Durbin, R. Fast and accurate long-read alignment with Burrows-Wheeler 439
transform. Bioinforma. Oxf. Engl. 26, 589–595 (2010). 440
38. Osorio, F. G. et al. Somatic Mutations Reveal Lineage Relationships and Age-Related
441
Mutagenesis in Human Hematopoiesis. Cell Rep. 25, 2308-2316.e4 (2018). 442
39. Blokzijl, F., Janssen, R., Boxtel, R. van & Cuppen, E. MutationalPatterns: 443
comprehensive genome-wide analysis of mutational processes. Genome Med. 10, 1–11 444
(2018). 445
40. Cunningham, F. et al. Ensembl 2015. Nucleic Acids Res. 43, D662-669 (2015).
446
41. Cameron, D. L. et al. GRIDSS, PURPLE, LINX: Unscrambling the tumor genome via
447
integrated analysis of structural variation and copy number. bioRxiv 781013 (2019) 448
doi:10.1101/781013. 449
42. The National Genomics Research and Healthcare Knowledgebase | Genomics England.
450
https://www.genomicsengland.co.uk/the-national-genomics-research-and-healthcare-451
knowledgebase/ (2017). 452
43. Raczy, C. et al. Isaac: ultra-fast whole-genome secondary analysis on Illumina
453
sequencing platforms. Bioinforma. Oxf. Engl. 29, 2041–2043 (2013). 454
44. Lawrence, M. et al. Software for Computing and Annotating Genomic Ranges. PLoS
455
Comput. Biol. 9, (2013).
456
ACKNOWLEDGEMENTS 457
We thank Hoeijmakers J., Knipscheer P and Garaycoechea J. for discussions on DNA damage. 458
We also thank Robinson P., and Vervier K., Lawley T., and Stratton M. for explorative analysis 459
and discussions. 460
This publication and the underlying study have been made possible partly on the basis of the data 461
that Hartwig Medical Foundation and the Center of Personalised Cancer Treatment (CPCT) have 462
made available to the study. 463
This research was made possible through access to the data and findings generated by the 464
100,000 Genomes Project. The 100,000 Genomes Project is managed by Genomics England 465
Limited (a wholly owned company of the Department of Health and Social Care). The 100,000 466
Genomes Project is funded by the National Institute for Health Research and NHS England. The 467
Wellcome Trust, Cancer Research UK and the Medical Research Council have also funded 468
research infrastructure. The 100,000 Genomes Project uses data provided by patients and 469
collected by the National Health Service as part of their care and support. 470
This work was supported by CRUK grant OPTIMISTICC [C10674/A27140], the Gravitation 471
projects CancerGenomiCs.nl and the Netherlands Organ-on-Chip Initiative (024.003.001) from 472
the Netherlands Organisation for Scientific Research (NWO) funded by the Ministry of Education, 473
Culture and Science of the government of the Netherlands (C.P.M, J.P.), the Oncode Institute 474
(partly financed by the Dutch Cancer Society) the European Research Council under ERC 475
Advanced Grant Agreement no. 67013 (J.P., T.M, H.C.), a VIDI grant of the Netherlands 476
Organisation for Scientific Research (NWO) (no. 016.Vidi.171.023) to R.v.B (A.R.H.) and NWO 477
building blocks of life project: Cell dynamics within lung and intestinal organoids 478
(737.016.009)(M.H.G). 479
This work was supported by the Netherlands Organ-on-Chip Initiative, an NWO Gravitation 481
project (024.003.001) funded by the Ministry of Education, Culture and Science of the 482
government of the Netherlands 483
484
AUTHOR CONTRIBUTION 485
C.P.M., J.P., A.R.H. and H.C. conceived the study; C.P.M., J.P., A.R.H., R.vB. and H.C. wrote 486
the manuscript; A.R.H, H.W, F.M. and R.vB. performed signature analysis; A.R.H., A.vH., H.W., 487
J.N., C.G., P.Q., M.G., M.M. and E.C. provided access to and analyzed patient WGS data; G.D. 488
and R.B. isolated bacterial strains and generated knockouts; C.P.M., J.P., T.M., R.vdL., M.H.G. 489
and S.vE. established and performed organoid cloning experiments; C.P.M., J.P. and J.B. 490
performed organoid co-culture experiments; P.S., F.P., J.T. and R.W. performed bacteria 491
validation and assays. 492
DATA AVAILABILITY STATEMENT 493
494
Whole-genome sequence data has been deposited in the European Genome-phenome Archive 495
(EGA; https://ega-archive.org); accession number EGAS00001003934. The data used from the 496
Hartwig Medical Foundation and Genomics England databases consist of patient-level somatic 497
variant data (annotated variant call data) and are considered privacy sensitive and available 498
through access-controlled mechanisms. 499
500
Patient-level somatic variant and clinical data have been obtained from the Hartwig Medical 501
Foundation under the data request number DR-084. Somatic variant and clinical data are freely 502
available for academic use from the Hartwig Medical Foundation through standardized 503
procedures. Privacy and publication policies, including co-authorship policies, can be retrieved 504
from: https://www.hartwigmedicalfoundation.nl/en/data-policy/. Data request forms can be 505
downloaded from https://www.hartwigmedicalfoundation.nl/en/applying-for-data/. 506
To gain access to the data, this data request form should be emailed
507
to info@hartwigmedicalfoundation.nl., upon which it will be evaluated within 6 weeks by the 508
HMF Scientific Council and an independent Data Access Board. When access is granted, the 509
requested data become available through a download link provided by HMF. 510
511
Somatic variant data from the Genomics England dataset was analyzed within the Genomics 512
England Research Environment secure data portal, under Research Registry project code RR87 513
and exported from the Research Environment following data transfer request 1000000003652 on 514
3rd December 2019.
515
The Genomics England dataset can be accessed by joining the community of academic and 516
clinical scientist via the Genomics England Clinical Interpretation Partnership
517
(GeCIP). https://www.genomicsengland.co.uk/about-gecip/. To join a GeCIP domain, the 518
following steps have to be taken: 519
1.
Your insitution has to sign the GeCIP Participation Agreement, which outlines the key 520principles that members of each institution must adhere to, including our Intellectual 521
Property and Publication Policy. 522
2.
Submit your application using the relevant form found at the bottom of the page 523(https://www.genomicsengland.co.uk/join-a-gecip-domain/). 524
3.
The domain lead will review your application, and your institution will verify your identity 525for Genomics England and communicate confirmation directly to Genomics England. 526
4.
Your user account will be created. 5275.
You will be sent an email containing a link to complete Information Governance training 528and sign the GeCIP Rules (https://www.genomicsengland.co.uk/wp-529
content/uploads/2019/07/GeCIP-Rules_29-08-2018.pdf). Completing the training and 530
signing the GeCIP Rules are requirements for you to access the data. After you have 531
completed the training and signed the rules, you will need to wait for your access to the 532
Research Environment to be granted. 533
6.
This will generally take up to one working day. You will then receive an email letting you 534know your account has been given access to the environment, and instructions for 535
logging in. 536
(for more detail, see: https://www.genomicsengland.co.uk/join-a-gecip-domain/) 537
538
Details of the data access agreement can be retrieved from: 539
https://figshare.com/articles/GenomicEnglandProtocol_pdf/4530893/5. All requests will be 540
evaluated by the Genomics England Access Review Committee taking into consideration patient 541
data protection, compliance with legal and regulatory requirements, resource availability and 542
facilitation of high quality research. 543
All analysis of the data must take place within the Genomics England Research Environment 544
secure data portal, https://www.genomicsengland.co.uk/understanding-genomics/data/ and
545
exported following approval of a data transfer request. 546
Regarding co-authorship, all publications using data generated as part of the Genomics England 547
100,000 Genomes Project must include the Genomics England Research Consortium as co-548
authors. The full publication policy is available at https://www.genomicsengland.co.uk/about-549
gecip/publications/. 550
551
All other data supporting the findings of this study are available from the corresponding author 552
upon request. 553
CODE AVAILABILITY 554
All analysis scripts are available on https://github.com/ToolsVanBox/GenotoxicEcoli. 555
CONFLICT OF INTEREST 556
The authors declare no conflict of interest. 557
558
GENOMICS ENGLAND RESEARCH CONSORTIUM AUTHOR LIST 559
Ambrose J. C. 1 , Arumugam P.1, Baple E. L. 1, Bleda M. 1 , Boardman-Pretty F. 1,2 , Boissiere J.
560
M. 1 , Boustred C. R. 1 , Brittain H.1, Caulfield M. J.1,2 , Chan G. C. 1 , Craig C. E. H. 1 , Daugherty
561
L. C. 1 , de Burca A. 1 , Devereau, A. 1 , Elgar G. 1,2 , Foulger R. E. 1 , Fowler T. 1 , Furió-Tarí P. 1 ,
562
Hackett J. M. 1 , Halai D. 1 , Hamblin A.1, Henderson S.1,2, Holman J. E. 1 , Hubbard T. J. P. 1 ,
563
Ibáñez K.1,2 , Jackson R. 1, Jones L. J. 1,2, Kasperaviciute D. 1,2 , Kayikci M. 1 , Lahnstein L. 1 ,
564
Lawson K. 1 ,Leigh S. E. A. 1 , Leong I. U. S. 1 , Lopez F. J. 1 , Maleady-Crowe F. 1 , Mason J. 1 ,
565
McDonagh E. M. 1,2 , Moutsianas L. 1,2 , Mueller M. 1,2 , Murugaesu N. 1, Need A. C. 1,2 , Odhams
566
C. A. 1 , Patch C. 1,2 , Perez-Gil D. 1 , Polychronopoulos D. 1 , Pullinger J. 1 , Rahim T. 1 , Rendon
567
A. 1 , Riesgo-Ferreiro P.1 , Rogers T. 1 , Ryten M. 1 , Savage K. 1 , Sawant K. 1, Scott R. H. 1 ,
568
Siddiq A. 1 , Sieghart A. 1 , Smedley D. 1,2 , Smith K. R. 1,2 , Sosinsky A. 1,2 , Spooner W. 1 , Stevens
H. E. 1 , Stuckey A. 1 , Sultana R. 1, Thomas E. R. A. 1,2 , Thompson S. R. 1 , Tregidgo C. 1 , Tucci
570
A. 1,2 , Walsh E. 1 , Watters, S. A. 1 , Welland M. J. 1 , Williams E. 1 , Witkowska K. 1,2 , Wood S. M.
571
1,2, Zarowiecki M.1 .
572 573
1. Genomics England, London, UK 574
2. William Harvey Research Institute, Queen Mary University of London, London, EC1M 6BQ, 575
UK. 576
577
Extended Data Table 1: SBS-pks and ID-pks levels across tissue types. Sample
578
numbers are displayed by primary tumor type per row. Numbers of samples with more
579
than 5% contribution of either ID-pks, SBS-pks or both are shown; the proportion of
580
positive samples per tissue is indicated in brackets.
581 582
Extended Data Table 1
583
Primary Tumor Location Total
number SBS-pks > 0.05 ID-pks > 0.05 SBS-pks > 0.05 & ID-pks > 0.05 CRC 496 37 (7,5%) 44 (8,8%) 31 (6,25%)
Head & Neck 61 1 (1,6%) 1 (1,6%) 1 (1,6%)
Urinary Tract 142 3 (2,1%) 6 (4,2%) 3 (2,1%)
Other 2969 12 (0,4%) 134 (4,5%) 1 (0,03%)
584 585
586 587 588 589 590 591 592 593 594 595 596
Figure 1. Co-culture of healthy human intestinal organoids with genotoxic E. coli induces
597
DNA damage. a, Schematic representation of genotoxic E. coli microinjection into the lumen of
598
human intestinal organoids. b, Scanning electron microscopy image illustrating direct contact 599
between organoid apical side and pks+ E. coli after 24h co-culture. Scale bar = 10 μm. c, Bacterial 600
load of pks+ or pksΔclbQ at 0, 1, 2 and 3 days after co-culture establishment (n = 8 co-cultures 601
per condition and timepoint, except pks+ d2 (n = 7) and pksΔclbQ d3 (n = 6)). CFU, colony forming 602
units. Center line indicates mean, error bars represent SD. d, Representative images of DNA 603
damage induction after 1 day of co-culture, measured by γH2AX immunofluorescence. One 604
organoid is shown per image with one nucleus in the inset. Yellow boxes indicate inset area. 605
Scale bars represent 10 μm (large image) and 2 μm (inset). e, Quantification of (d): Percentage 606
of nuclei positive for γH2AX foci in pks+ (n= 9 organoids), pksΔclbQ (n=7 organoids), dye (n=7 607
organoids) and mitomycin C (MMC) (n=7 organoids) after 1 day of co-culture. Center line indicates 608
mean, error bars represent SD. 609
610 611
612
613 614
Figure 2. Long-term co-culture of pks+ E. coli induces SBS-pks and ID-pks mutational
615
signatures. a, Schematic representation of the experimental setup. b, The number of single base
616
substitutions (SBS) that accumulated in organoids co-cultured with either pks+ or pksΔclbQ E. coli 617
(n = 3 clones). Box height indicates mean number of events, error bars represent SD. c, SBS 96-618
trinucleotide mutational spectra in organoids exposed to either pks+ (top) or pksΔclbQ (middle) E. 619
coli. The bottom panel depicts the SBS-pks signature, which was defined by subtracting pksΔclbQ
620
from pks+ SBS mutations. d, The number of small insertions and deletions (indels) that 621
accumulated in organoids co-cultured either with pks+ or pksΔclbQ E. coli (n = 3 clones). Box 622
height indicates mean number of events, error bars represent SD. e, Indel mutational spectra 623
observed in organoids exposed to either pks+ (top) or pksΔclbQ (middle) E. coli. The bottom panel 624
depicts the ID-pks signature, which was defined by subtracting pksΔclbQ from pks+ indel 625
mutations. 626
627 628
629 630
Figure 3. Consensus motifs and extended features of SBS-pks and ID-pks mutational
631
signatures. a, 2-bit representation of the extended sequence context of T>N mutations observed
632
in organoids exposed to pks+ E. coli. Sequence directionality indicated in grey. Green: Highlighted 633
T>N trinucleotide sequence; Blue: Highlighted A-enriched position characteristic of the SBS-pks 634
mutations. b, 2-bit representation of the extended sequence context of single deletions in T-635
homopolymers observed in organoids exposed to pks+ E. coli. Sequence directionality indicated 636
in grey. Green: Highlighted T-homopolymer with deleted T; Blue: Highlighted characteristic poly-637
A stretch. c, Mean occurrence of < 1 base pair deletions in pks+ or pksΔclbQ exposed organoids. 638
Black bars correspond to deletions matching the ID-pks extended motifs; Grey bars correspond 639
to deletions where no ID-pks motif is observed. Box height indicates mean number of events, 640
error bars represent SD (n = 3 clones). d, Transcriptional strand-bias of T>N and C>N mutations 641
occurring in organoids exposed to pks+ E. coli and pksΔclbQ E. coli. Pink: C>N; Blue: T>N; Dark 642
color: Transcribed strand; Bright color: Untranscribed strand. Box height indicates mean number 643
of events, error bars represent SD (n = 3 clones). e, Transcriptional strand bias of the 96-644
trinucleotide SBS-pks mutational signature. Color: Transcribed strand; White: Untranscribed 645
strand. 646
647 648
649
Figure 4. SBS-pks and ID-pks mutational signatures are present in a subset of CRC
650
samples from 2 independent cohorts. a, Top 20 out of 3668 metastases from the HMF cohort,
651
ranked by the fraction of single base substitutions attributed to SBS-pks. CRC metastases (in 652
orange) are enriched. Colors indicate tissue of origin. b, Top 20 out of 3668 metastases from 653
HMF cohort. Samples are ranked by the fraction of indels attributed to ID-pks. CRC metastases 654
(in orange) are also here enriched. NET indicates neuroendocrine tumor. Colors indicate tissue 655
of origin. c, Scatterplot of fraction of single base substitutions and indels attributed to SBS-pks 656
and ID-pks in 3668 metastases. Each dot represents one metastasis. Samples high for both SBS-657
pks and pks (> 5% contribution, dashed lines) are enriched in CRC (orange). SBS-pks and
ID-658
pks are correlated (R² = 0.46; only CRC, R² = 0.7). Colors indicate tissue of origin. d, Scatterplot
659
of SBS-pks and ID-pks contribution in 2208 CRC tumor samples, predominantly of primary origin, 660
from the Genomics England cohort. SBS-pks and ID-pks are correlated (R² = 0.35). Each dot 661
represents one primary tumor sample. Dashed lines delimitate samples with high SBS-pks or ID-662
pks contribution (> 5%). e, Scatterplot of SBS-pks and > 1 bp indels with ID-pks pattern in the
663
HMF cohort. Colors indicate tissue of origin. f, Scatterplot of ID-pks and >1 bp indels with ID-pks 664
pattern in the HMF cohort. Colors indicate tissue of origin. g, Exonic APC driver mutations found 665
in the IntOGen collection matching the colibactin target SBS-pks or ID-pks motifs. h, Schematic 666
representation of a driver mutation in APC causing a premature stop codon matching the SBS-667
pks motif, found in the IntOGen collection and in two independent SBS/ID-pks high patients from
668
the HMF cohort. 669
670 671
Extended Data Fig. 1. Co-culture with genotoxic pks+ E. coli induces DNA interstrand
672
crosslinks in healthy human intestinal organoids. a, Representative images (out of n = 5
673
organoids per group) of DNA interstrand crosslink formation after 1d of co-culture, measured by 674
FANCD2 immunofluorescence (green). Nuclei were stained with DAPI (blue). Yellow boxes 675
represent inset area. Scale bars represent 50 μm (large image) and 10 μm (inset). Experiment 676
was repeated independently twice with similar results. b, Gating strategy to select epithelial cells 677
(left) and to quantify viable cells (right). c, Viability of intestinal organoid cells after 1, 3 and 5 days 678
of co-culture (n = 3 technical replicates) (bacteria eliminated after 3 days of co-culture). Points 679
are independent replicates, center line indicates mean, error bars represent SD. 680
681 682
Extended Data Fig. 2. Genotoxic pks+ E. coli induce SBS-pks and ID-pks mutational
683
signatures after long-term co-culture with wild-type intestinal organoids. a, 96-trinucleotide
684
mutational spectra of SBS in each of the 3 individual clones sequenced per condition. Top 3: dye; 685
middle 3: pksΔclbQ E. coli; bottom 3: pks+E. coli. b, Total 96-trinucleotide mutational spectra of 686
pks+ and pksΔclbQ from which dye single base substitutions are subtracted. c, Heatmap depicting 687
cosine similarity between dye, pks+ E. coli and pksΔclbQ E. coli 96-trinucleotide mutational 688
profiles. d, Indel mutational spectra plots from each of the 3 individual clones sequenced per 689
condition. Top 3: dye; middle 3: pksΔclbQ E. coli bottom 3: pks+E. coli e, Total indel mutational 690
spectra of values of pks+E. coli and pksΔclbQ E. coli from which dye indels are subtracted. f, 691
Heatmap depicting cosine similarity between dye, pks+ E. coli and pksΔclbQ E. coli indel 692
mutational profiles. 693
694 695
Extended Data Fig. 3. Genotoxic pks+ E. coli and isogenic strain reconstituted with
696
pks∆clbQ:clbQ induce SBS-pks and ID-pks mutational signatures after co-culture. a,
96-697
trinucleotide mutational spectra of SBS in 3 individual clones from the independent human healthy 698
intestinal organoid line ASC 6-a co-cultured for 3 rounds with pks+ or pks∆clbQ E. coli. b, Top: 699
Total 96-trinucleotide mutational spectrum from the 3 clones from pks+ or pks∆clbQ E. coli shown 700
in (a). Bottom: Resulting 96-trinucleotide mutational spectrum from ASC 6-a co-cultured with pks+ 701
E. coli after the subtraction of background mutations from 3 parallel pks∆clbQ E. coli co-cultures
702
(cosine similarity to SBS-pks = 0.77). c, Indel mutational spectra plots from the 3 independent 703
ASC 6-a clones co-cultured for 3 rounds with pks+ or pks∆clbQ E. coli. d, Top: Total indel 704
mutational spectrum from the 3 clones from pks+ or pks∆clbQ E. coli shown in (c). Bottom: 705
Resulting indel mutational spectrum from the independent ASC 6-a co-cultured with pks+ E. coli 706
after the subtraction of background mutations from 3 parallel pks∆clbQ E. coli co-cultures (cosine 707
similarity to ID-pks = 0.93). e, 96-trinucleotide mutational spectrum from 3 individual clones of the 708
ASC 5-a line co-cultured for 3 rounds with the isogenic recomplemented strain pks∆clbQ:clbQ. f, 709
Top: Total 96-trinucleotide mutational spectrum from the 3 clones from pks∆clbQ:clbQ shown in
710
(e). Bottom: Resulting mutational spectrum after subtracting pks∆clbQ background (cosine 711
similarity to SBS-pks = 0.95). g, Indel mutational spectrum from 3 individual clones of the ASC 5-712
a line co-cultured for 3 rounds with the isogenic recomplemented strain pks∆clbQ:clbQ. h, Top: 713
Total indel mutational spectrum from the 3 clones from pks∆clbQ:clbQ shown in (e). Bottom: 714
Resulting mutational spectrum after subtracting pks∆clbQ background (cosine similarity to ID-pks 715
= 0.95). 716
717 718
Extended Data Fig. 4. Detailed sequence context for ID-pks and longer deletions by length.
719
a, 10 base up- and downstream profile shows an upstream homopolymer of adenosines favoring
720
induction of deletions. The length of the adenosine stretch decreases with increasing T-721
homopolymer length (1—8, top left to bottom right). 722
723 724