arXiv:1111.3473v1 [astro-ph.HE] 15 Nov 2011
Search for Neutrino Emission from
Gamma-Ray Flaring Blazars with the
ANTARES Telescope
S. Adri´an-Mart´ıneza, I. Al Samaraib, A. Albertc, M. Andr´ed,
M. Anghinolfie, G. Antonf, S. Anvarg, M. Ardida, T. Astraatmadjah,1,
J-J. Aubertb, B. Bareti, S. Basaj, V. Bertinb, S. Biagik,ℓ, C. Bigongiarin,
C. Bogazzih, M. Bou-Caboa, B. Bouhoui, M.C. Bouwhuish, J. Brunnerb,2,
J. Bustob, F. Camarenaa, A. Caponeo,p, C. Cˆarloganuq, G. Carminatik,ℓ,3,
J. Carrb, S. Cecchinik, Z. Charifb, Ph. Charvisr, T. Chiarusik, M. Circellas,
L. Coreb, H. Costantinib, P. Coyleb, A. Creusoti, C. Curtilb,
G. De Boniso,p, M.P. Decowskih, I. Dekeysert, A. Deschampsr,
C. Distefanou, C. Donzaudi,v, D. Dornicn, Q. Dorostiw, D. Drouhinc,
T. Eberlf, U. Emanuelen, A. Enzenh¨oferf, J-P. Ernenweinb, S. Escoffierb,
K. Fehnf, P. Fermanio,p, M. Ferria, S. Ferryx, V. Flaminiom,y, F. Folgerf,
U. Fritschf, J-L. Fudat, S. Galat`ab, P. Gayq, K. Geyerf, G. Giacomellik,ℓ,
V. Giordanou, J.P. G´omez-Gonz´alezn, K. Graff, G. Guillardq,
G. Halladjianb, G. Hallewellb, H. van Harenz, J. Hartmanh, A.J. Heijboerh,
Y. Hellor, J.J. Hern´andez-Reyn, B. Heroldf, J. H¨oßlf, C.C. Hsuh,
M. de Jongh,1, M. Kadleraa, O. Kalekinf, A. Kappesf, U. Katzf,
O. Kavatsyukw, P. Kooijmanh,ab,ac, C. Kopperh,f, A. Kouchneri,
I. Kreykenbohmaa, V. Kulikovskiyad,e, R. Lahmannf, G. Lambardn,
G. Larosaa, D. Lattuadau, D. Lef`evret, G. Limh,ac, D. Lo Prestiae,af,
H. Loehnerw, S. Loucatosx, F. Louisg, S. Manganon, M. Marcelinj,
A. Margiottak,ℓ, J.A. Mart´ınez-Moraa, A. Melif, T. Montarulis,ag,
N. Morgantim, L. Moscosoi,x,4, H. Motzf, M. Nefff, E. Nezrij,
D. Palioselitish, G.E. P˘av˘ala¸sah, K. Payetx, P. Payreb,4, J. Petrovich,
P. Piattelliu, N. Picot-Clementeb, V. Popaah, T. Pradierai, E. Presanih,
C. Raccac, C. Reedh, G. Riccobeneu, C. Richardtf, R. Richterf,
C. Rivi`ereb, A. Robertt, K. Roenschf, A. Rostovtsevaj, J. Ruiz-Rivasn,
M. Rujoiuah, G.V. Russoae,af, F. Salesan, D.F.E. Samtlebenh, P. Sapienzau,
F. Sch¨ockf, J-P. Schullerx, F. Sch¨usslerx, T. Seitz f, R. Shanidzef,
F. Simeoneo,p, A. Spiesf, M. Spuriok,ℓ, J.J.M. Steijgerh, Th. Stolarczykx,
A. S´anchez-Losan, M. Taiutie,ak, C. Tamburinit, S. Toscanon, B. Vallagex,
C. Vall´eeb, V. Van Elewyck i, G. Vannonix, M. Vecchib, P. Verninx,
E. Visserh, S. Wagnerf, G. Wijnkerh, J. Wilmsaa, E. de Wolfh,ac,
a
Institut d’Investigaci´o per a la Gesti´o Integrada de les Zones Costaneres (IGIC) - Universitat Polit`ecnica de Val`encia. C/ Paranimf 1 , 46730 Gandia, Spain.
b
CPPM, Aix-Marseille Universit´e, CNRS/IN2P3, Marseille, France
cGRPHE - Institut universitaire de technologie de Colmar, 34 rue du Grillenbreit BP 50568 - 68008 Colmar, France
dTechnical University of Catalonia, Laboratory of Applied Bioacoustics, Rambla Exposici´o,08800 Vilanova i la Geltr´u,Barcelona, Spain
e
INFN - Sezione di Genova, Via Dodecaneso 33, 16146 Genova, Italy f
Friedrich-Alexander-Universit¨at Erlangen-N¨urnberg, Erlangen Centre for Astroparticle Physics, Erwin-Rommel-Str. 1, 91058 Erlangen, Germany
gDirection des Sciences de la Mati`ere Institut de recherche sur les lois fondamentales de l’Univers -Service d’Electronique des D´etecteurs et d’Informatique, CEA Saclay, 91191 Gif-sur-Yvette Cedex,
France
hNikhef, Science Park, Amsterdam, The Netherlands
iAPC - Laboratoire AstroParticule et Cosmologie, UMR 7164 (CNRS, Universit´e Paris 7 Diderot, CEA, Observatoire de Paris) 10, rue Alice Domon et L´eonie Duquet 75205 Paris Cedex 13, France j
LAM - Laboratoire d’Astrophysique de Marseille, Pˆole de l’ ´Etoile Site de Chˆateau-Gombert, rue Fr´ed´eric Joliot-Curie 38, 13388 Marseille Cedex 13, France
kINFN - Sezione di Bologna, Viale Berti-Pichat 6/2, 40127 Bologna, Italy ℓDipartimento di Fisica dell’Universit`a, Viale Berti Pichat 6/2, 40127 Bologna, Italy
mINFN - Sezione di Pisa, Largo B. Pontecorvo 3, 56127 Pisa, Italy
nIFIC - Instituto de F´ısica Corpuscular, Edificios Investigaci´on de Paterna, CSIC - Universitat de Val`encia, Apdo. de Correos 22085, 46071 Valencia, Spain
o
INFN -Sezione di Roma, P.le Aldo Moro 2, 00185 Roma, Italy
pDipartimento di Fisica dell’Universit`a La Sapienza, P.le Aldo Moro 2, 00185 Roma, Italy qClermont Universit´e, Universit´e Blaise Pascal, CNRS/IN2P3, Laboratoire de Physique Corpusculaire,
BP 10448, 63000 Clermont-Ferrand, France r
G´eoazur - Universit´e de Nice Sophia-Antipolis, CNRS/INSU, IRD, Observatoire de la Cˆote d’Azur and Universit´e Pierre et Marie Curie, BP 48, 06235 Villefranche-sur-mer, France
sINFN - Sezione di Bari, Via E. Orabona 4, 70126 Bari, Italy
tCOM - Centre d’Oc´eanologie de Marseille, CNRS/INSU et Universit´e de la M´editerran´ee, 163 Avenue de Luminy, Case 901, 13288 Marseille Cedex 9, France
u
INFN - Laboratori Nazionali del Sud (LNS), Via S. Sofia 62, 95123 Catania, Italy v
Univ Paris-Sud , 91405 Orsay Cedex, France
wKernfysisch Versneller Instituut (KVI), University of Groningen, Zernikelaan 25, 9747 AA Groningen, The Netherlands
xDirection des Sciences de la Mati`ere Institut de recherche sur les lois fondamentales de l’Univers -Service de Physique des Particules, CEA Saclay, 91191 Gif-sur-Yvette Cedex, France
y
Dipartimento di Fisica dell’Universit`a, Largo B. Pontecorvo 3, 56127 Pisa, Italy
zRoyal Netherlands Institute for Sea Research (NIOZ), Landsdiep 4,1797 SZ ’t Horntje (Texel), The Netherlands
aaDr. Remeis-Sternwarte and ECAP, Universit¨at Erlangen-N¨urnberg, Sternwartstr. 7, 96049 Bamberg, Germany
ab
Universiteit Utrecht, Faculteit Betawetenschappen, Princetonplein 5, 3584 CC Utrecht, The Netherlands
acUniversiteit van Amsterdam, Instituut voor Hoge-Energie Fysika, Science Park 105, 1098 XG Amsterdam, The Netherlands
ad
Moscow State University,Skobeltsyn Institute of Nuclear Physics,Leninskie gory, 119991 Moscow, Russia
aeINFN - Sezione di Catania, Viale Andrea Doria 6, 95125 Catania, Italy
afDipartimento di Fisica ed Astronomia dell’Universit`a, Viale Andrea Doria 6, 95125 Catania, Italy ag
University of Wisconsin - Madison, 53715, WI, USA ah
Institute for Space Sciences, R-77125 Bucharest, M˘agurele, Romania ai
IPHC-Institut Pluridisciplinaire Hubert Curien - Universit´e de Strasbourg et CNRS/IN2P3 23 rue du Loess, BP 28, 67037 Strasbourg Cedex 2, France
aj
ITEP - Institute for Theoretical and Experimental Physics, B. Cheremushkinskaya 25, 117218 Moscow, Russia
ak
Dipartimento di Fisica dell’Universit`a, Via Dodecaneso 33, 16146 Genova, Italy
Abstract
The ANTARES telescope is well-suited to detect neutrinos produced in astrophys-ical transient sources as it can observe a full hemisphere of the sky at all times with a high duty cycle. Radio-loud active galactic nuclei with jets pointing almost directly towards the observer, the so-called blazars, are particularly attractive po-tential neutrino point sources. The all-sky monitor LAT on board the Fermi satellite probes the variability of any given gamma-ray bright blazar in the sky on time scales of hours to months. Assuming hadronic models, a strong correlation between the gamma-ray and the neutrino fluxes is expected. Selecting a narrow time window on the assumed neutrino production period can significantly reduce the background.
An unbinned method based on the minimization of a likelihood ratio was applied to a subsample of data collected in 2008 (61 days live time). By searching for neutrinos during the high state periods of the AGN light curve, the sensitivity to these sources was improved by about a factor of two with respect to a standard time-integrated point source search. First results on the search for neutrinos associated with ten bright and variable Fermi sources are presented.
Key words: ANTARES, Neutrino astronomy, Fermi LAT transient sources, time-dependent search, blazars
PACS 95.55.Vj
1 Also at University of Leiden, the Netherlands
2 On leave at DESY, Platanenallee 6, D-15738 Zeuthen, Germany 3 Now at University of California - Irvine, 92697, CA, USA 4 Deceased
1 Introduction
1
Neutrinos are unique messengers to study the high-energy universe as they
2
are neutral and stable, interact weakly and therefore travel directly from their
3
point of creation to the Earth without absorption. Neutrinos could play an
4
important role in understanding the mechanisms of cosmic ray acceleration
5
and their detection from a cosmic source would be a direct evidence of the
6
presence of hadronic acceleration. The production of high-energy neutrinos
7
has been proposed for several kinds of astrophysical sources, such as active
8
galactic nuclei (AGN), gamma-ray bursters (GRB), supernova remnants and
9
microquasars, in which the acceleration of hadrons may occur (see Ref. [1] for
10
a review).
11
Flat-Spectrum Radio Quasars (FSRQs) and BL Lacs, classified as AGN blazars,
12
exhibit relativistic jets pointing almost directly towards the Earth and are
13
some of the most violent variable high energy phenomena in the Universe [2].
14
These sources are among the most likely sources of the observed ultra high
15
energy cosmic rays. Blazars typically display spectra with enhanced emission
16
over two energy ranges: the IR/X-ray and MeV/TeV peaks. The lower energy
17
peak is generally agreed to be the product of synchrotron radiation from
ac-18
celerated electrons. However, the origin of the higher energy peak remains to
19
be clarified. In leptonic models [3], inverse Compton scattering of synchrotron
20
photons (or other ambient photons) by accelerated electrons generates this
21
high energy emission. In hadronic models [4], MeV-TeV gamma-rays and high
22
energy neutrinos are produced through hadronic interactions of the high
en-23
ergy cosmic rays with radiation or gas clouds surrounding the source. In the
24
latter scenario, a strong correlation between the gamma-ray and the neutrino
25
fluxes is expected. The gamma-ray light curves of bright blazars measured by
26
the LAT instrument on board the Fermi satellite reveal important time
vari-27
ability on timescales of hours to several weeks, with intensities much larger
28
than the typical flux of the source in its quiescent state [5].
29
This paper presents the results of the first time-dependent search for cosmic
30
neutrino sources by the ANTARES telescope. The data sample used in this
31
analysis and the comparison to Monte Carlo simulations are described in
Sec-32
tion 2, together with a discussion on the systematic uncertainties. The point
33
source search algorithm used in this time-dependent analysis is explained in
34
Section 3. The search results are presented in Section 4 for ten selected
can-35
didate sources.
2 ANTARES
37
The ANTARES Collaboration completed the construction of a neutrino
tele-38
scope in the Mediterranean Sea with the connection of its twelfth detector line
39
in May 2008 [6]. The telescope is located 40 km off the Southern coast of France
40
(42◦48’N, 6◦10’E) at a depth of 2475 m. It comprises a three-dimensional array
41
of photomultipliers housed in glass spheres (optical modules [7]), distributed
42
along twelve slender lines anchored at the sea bottom and kept taut by a buoy
43
at the top. Each line is composed of 25 storeys of triplets of optical
mod-44
ules (OMs), each housing one 10-inch photomultiplier. The lines are subject
45
to the sea currents and can change shape and orientation. A positioning
sys-46
tem based on hydrophones, compasses and tiltmeters is used to monitor the
47
detector geometry with an accuracy of 10 cm.
48
The main goal of the experiment is to search for high energy neutrinos with
49
energies greater than 100 GeV by detecting muons produced by the neutrino
50
charged current interaction in the vicinity of the detector. Due to the large
51
background from downgoing atmospheric muons, the telescope is optimized
52
for the detection of upgoing muons as only they can originate from neutrinos.
53
Muons induce the emission of Cherenkov light in the sea water. The arrival
54
time and intensity of the Cherenkov light on the OMs are digitized into hits
55
and transmitted to shore. Events containing muons are selected from the
con-56
tinuous deep sea optical backgrounds due to natural radioactivity and
biolu-57
minescence. A detailed description of the detector and the data acquisition is
58
given in [6,8].
59
The arrival times of the hits are calibrated as described in [9]. A L1 hit is
60
defined either as a high-charge hit, or as hits separated by less than 20 ns
61
on OMs of the same storey. At least five L1 hits are required throughout the
62
detector within a time window of 2.2 µs, with the relative photon arrival times
63
being compatible with the light coming from a relativistic particle.
Indepen-64
dently, events which have L1 hits on two sets of adjacent or next-to-adjacent
65
floors are also selected.
66
The data used in this analysis were taken in the period from September 6
67
to December 31, 2008 (54720 to 54831 modified Julian days, MJD) with the
68
twelve line detector. This period overlaps with the availability of the first
69
data from the LAT instrument onboard the Fermi satellite. The corresponding
70
effective live time is 60.8 days. Atmospheric neutrinos are the main source of
71
background in the search for astrophysical neutrinos. These upgoing neutrinos
72
are produced by the interaction of cosmic rays in the Earth’s atmosphere. To
73
account for this background, neutrino events were simulated according to the
74
parametrization of the atmospheric neutrino flux from Ref. [10]. Only charged
current interactions of muon neutrinos and antineutrinos were considered. An
76
additional source of background is due to downgoing atmospheric muons
mis-77
reconstructed as upgoing. Downgoing atmospheric muons were simulated with
78
the MUPAGE package [11]. In both cases, the Cherenkov light was propagated
79
taking into account light absorption and scattering in sea water [12].
80
From the timing and position information of the hits, muon tracks are
recon-81
structed using a multi-stage fitting procedure, based on Ref. [13]. The initial
82
fitting stages provide the hit selection and starting point for the final fit. The
83
final stage consists of a maximum likelihood fit of the observed hit times and
84
includes the contribution of optical background hits.
85
Upgoing tracks are also required to have a good reconstruction quality. The
86
latter is quantified by a parameter, Λ which is based on the value of the
87
likelihood function obtained for the fitted muon (see Ref. [13] for details). The
88
cumulative distribution of Λ for muons reconstructed as upgoing is shown
89
in Figure 1 along with the simulated contributions from atmospheric muons
90
and neutrinos. The angular uncertainty obtained from the muon track fit is
91
required to be smaller than 1 degree. For this analysis, events are selected
92
with Λ > −5.4. This value results in an optimal compromise between the
93
atmospheric neutrino and muon background reduction and the efficiency of the
94
cosmic neutrino signal with an assumed spectrum proportional to E−2
ν , where
95
Eν is the neutrino energy, which gives the best 5σ discovery potential. The
96
resulting sample consists of 628 events obtained in 60.8 days. The simulations
97
indicate that the selected sample contains 60 % atmospheric neutrinos; the
98
rest being mis-reconstructed atmospheric muons.
99
The angular resolution of the reconstructed neutrino direction can not be
100
determined directly from the data and has to be estimated from simulation.
101
However, comparison of data and Monte Carlo in which the time accuracy of
102
the hits was degraded by up to 3 ns constrains the uncertainty of the angular
103
resolution to about 0.1◦[14]. Figure 2 shows the cumulative distribution of the
104
angular difference between the reconstructed muon direction and the neutrino
105
direction for an assumed spectrum proportional to E−2
ν . For the considered
106
period, the median resolution is estimated to be 0.5 ± 0.1 degrees.
107
The effective area for muon neutrinos is defined as the ratio between the rate
108
of selected neutrino events and the cosmic neutrino flux. Figure 3 shows the
109
muon neutrino and antineutrino effective area of the ANTARES telescope as
110
a function of the declination of the source, after integrating over the energy
111
with an assumed spectrum proportional to E−2
ν between 10 GeV and 10 PeV.
112
In the flux limits (see Section 4), a conservative uncertainty on the detection
113
efficiency of about 30 % was taken into account. This number includes
con-114
tributions on the uncertainty of the sea water optical parameters [12] and the
115
OM properties such as efficiency and angular acceptance.
)
Λ
Track fit Quality ( -7 -6.5 -6 -5.5 -5 -4.5 -4 -3.5 -3 Number of events -1 10 1 10 2 10 3 10 4 10 5 10 data µ MC atm. ν MC atm.
Fig. 1. Track fit quality (Λ) distribution for upgoing events in data (dots) and Monte Carlo samples (atmospheric muons: dashed line; atmospheric neutrinos: continuous line). Events are selected with an error estimate lower than 1 degree. The green dashed vertical line corresponds to the optimized event selection (Λ > −5.4).
[deg] MC ν α - rec α -2 10 10-1 1 10 102
Cumulative event fraction
0 0.2 0.4 0.6 0.8 1
Fig. 2. Cumulative distribution of the angle between the true Monte Carlo neutrino direction (ανM C) and the reconstructed muon direction (αrec) for an E−2ν flux of upgoing neutrino events selected for this analysis.
3 Time-Dependent Search Algorithm
117
The time-dependent point source analysis is performed using an unbinned
118
method based on a likelihood ratio maximization. The data are parametrized
(deg) δ Declination -80 -60 -40 -20 0 20 40 Effective area (m²) 0.001 0.0015 0.002 0.0025 0.003 Aeff Aeff*vis
Fig. 3. ANTARES muon neutrino and antineutrino effective area (continuous line) as a function of the declination of the source computed from the Monte Carlo simulation for an E−2
ν flux of upgoing muons selected for this analysis. The product
of the effective area by the visibility (i.e. fraction of the time the source is visible at the ANTARES location) is shown with the dashed line.
as a mixture of signal and background. The goal is to determine, at a given
120
point in the sky and at a given time, the relative contribution of each
com-121
ponent and to calculate the probability to have a signal above background
122
in a given model. The likelihood ratio, λ, is the logarithm of the ratio of the
123
probability density for the hypothesis of signal and background (Hsig+bkg) over
124
the probability density of only background (Hbkg):
125 λ= N X i=1 logP(xi|Hsig+bkg) P(xi|Hbkg) = N X i=1 log nsig N Psig(αi, ti) + (1 − nsig N )Pbkg(δi, ti) Pbkg(αi, ti) (1)
where nsig is the unknown number of signal events determined by the fit and
126
N is the total number of events in the considered data sample. Psig(αi, ti)
127
and Pbkg(δi, ti) are the probability density functions (PDF) for signal and
128
background respectively. For a given event i, ti, δi and αi represent the time
129
of the event, its declination and the angular separation from the source under
130
consideration.
131
The probability densities Psig and Pbkg are factorized into a purely directional
132
and a purely time-related component. The shape of the time PDF for the
133
signal event is extracted directly from the gamma-ray light curve assuming
134
proportionality between the gamma-ray and the neutrino fluxes. It is assumed
135
that the muon neutrino velocity in vacuum is equal to that of light in vacuum.
136
For signal events, the directional PDF is described by the one dimensional
point spread function (PSF), which is the probability density of
reconstruct-138
ing an event at an angular distance α from the true source position. The
139
directional and time PDF for the background are derived from the data using
140
the observed declination distribution of the selected events and the observed
141
one-day binned time distribution of all the reconstructed muons respectively.
142
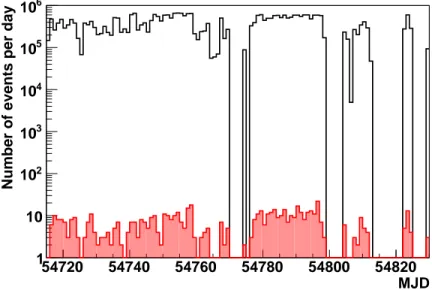
Figure 4 shows the time distribution of all the reconstructed events and the
143
selected upgoing events for this analysis. Once normalized to an integral equal
144
to 1, the distribution for all reconstructed events is used directly as the time
145
PDF for the background. Empty bins in the histograms correspond to periods
146
with no data taking (i.e. detector in maintenance) or with very poor quality
147
data (high bioluminescence or bad calibration).
148
MJD 54720 54740 54760 54780 54800 54820
Number of events per day
1 10 2 10 3 10 4 10 5 10 6 10
Fig. 4. Time distribution of the reconstructed events. Upper histogram (black line): distribution of all reconstructed events. Bottom filled histogram (red): distribution of selected upgoing events.
The statistical interpretation of the search result relies on simulated pseudo
149
experiments (PE) in which the background events are randomly generated by
150
sampling the declination and the time from the parametrization Pbkg(δi, ti)
151
and the right ascension from a uniform distribution. Events from a neutrino
152
point source are simulated by adding events around the desired coordinates
153
according to the point spread function and the time distribution of the studied
154
source. Systematic uncertainties (cf Section 2) are incorporated directly into
155
the pseudo experiment generation.
156
The null hypothesis corresponds to nsig = 0. The obtained value of λdata on
157
the data is then compared to the distribution of λ(nsig = 0). Large values of
158
λdata compared to the distribution of λ(nsig = 0) reject the null hypothesis
159
with a confidence level (C.L.) equal to the fraction of the number of PE above
160
λdata. The fraction of PE for which λ(nsig = 0) is above λdata is referred to as
161
the p-value. The discovery potential is then defined as the average number of
signal events required to achieve a p-value lower than 5σ in 50 % of the PEs.
163
In the same way, the sensitivity is defined as the average signal required to
164
obtain a p-value less than that of the median of the λ(nsig = 0) distribution
165
in 90 % of the PEs. In the absence of evidence of a signal, an upper limit on
166
the neutrino fluence is obtained and defined as the integral in energy and time
167
of the flux upper limit with an assumed energy spectrum proportional to E−2 ν
168
from 10 GeV to 10 PeV. The limits are calculated according to the classical
169
(frequentist) method for upper limits [15].
170
The performance of the time-dependent analysis was computed by applying
171
this unbinned algorithm for a single source assuming a single square-shape flare
172
with a width varying from 0.01 days to 84 days. The solid line in Figure 5 shows
173
the average number of events required for a discovery from one source located
174
at a declination of -40◦ as a function of the width of the flare. The numbers
175
in the black line are compared to that obtained without using the timing
176
information (dashed line). The flare timing information yields an improvement
177
of the discovery potential by about a factor 2-3 with respect to a standard
178
time-integrated point source search [14].
179 (days) t σ -2 10 10-1 1 10 102 <Number of events> 0 0.5 1 1.5 2 2.5 3 3.5 4 4.5 5
Fig. 5. Average number of events (solid line) required for a 5σ discovery (50 % probability) from a single source located at a declination of -40◦ as a function of the
width of the flare period (σt) for the 60.8 day analysis. These numbers are compared
to that obtained without using the timing information (dashed line).
4 Search for Neutrino Emission from Gamma-Ray Flares
180
The time-dependent analysis was applied to bright and variable Fermi blazar
181
sources reported in the first-year Fermi LAT catalogue [16] and in the LBAS
182
catalogue (LAT Bright AGN sample [17]). Sources were selected in the sky
ible to ANTARES and that had at least one day binned gamma-ray flux in the
184
high state periods greater than 80x10−8 photons cm−2 s−1 above 100 MeV and
185
showed significant time variability on time scales of days to weeks in the
stud-186
ied time period. A source is assumed variable in the LBAS catalogue when the
187
observation has a probability of less than 1 % of being a steady source. This list
188
includes six flat-spectrum radio quasars and four BL-Lacs. Only four bright
189
and nearby sources in the considered sample, PKS2155-304 [18],
PKS1510-190
089 [19], 3C279 [20] and WComae [21], have been detected by the ground
191
Cherenkov telescopes HESS, MAGIC or VERITAS. Table 1 lists the
charac-192
teristics of the ten selected sources.
193
Name OFGL name Class RA [o] Dec [o] Redshift
PKS0208-512 J0210.8-5100 FSRQ 32.70 -51.2 1.003 AO0235+164 J0238.6+1636 BLLac 39.65 16.61 0.940 PKS0454-234 J0457.1-2325 FSRQ 74.28 -23.43 1.003 OJ287 J0855.4+2009 BLLac 133.85 20.09 0.306 WComae J1221.7+28.14 BLLAc 185.43 28.14 0.102 3C273 J1229.1+0202 FSRQ 187.28 2.05 0.158 3C279 J1256.1-0548 FSRQ 194.03 -5.8 0.536 PKS1510-089 J1512.7-0905 FSRQ 228.18 -9.09 0.36 3C454.3 J2254.0+1609 FSRQ 343.50 16.15 0.859 PKS2155-304 J2158.8-3014 BLLac 329.70 -30.24 0.116 Table 1
List of bright variable Fermi blazars selected for this analysis [17].
The light curves published on the Fermi web page for the monitored sources [22]
194
are used for this analysis. They correspond to the one-day binned time
evolu-195
tion of the average gamma-ray flux above a threshold of 100 MeV since August
196
2008. The high state periods are defined using a simple and robust method
197
based on three main steps. Firstly, the baseline is determined with an iterative
198
linear fit. After each fit, bins more than two sigma (σBL) above the baseline
199
(BL) are removed. Secondly, seeds for the high state periods are identified by
200
searching for bins significantly above the baseline according to the criteria:
201
(F − σF) > (BL + 2 ∗ σBL) and F > (BL + 3 ∗ σBL) (2)
where F and σF represent the flux and the uncertainty on this flux for each
202
bin, respectively. For each seed, the adjacent bins for which the emission is
203
compatible with the flare are added if they satisfy: (F − σF) > (BL + σBL).
204
Finally, an additional delay of 0.5 days is added before and after the flare in
order to take into account that the precise time of the flare is not known (1-day
206
binned light curve). With this definition, a flare has a width of at least two
207
days. Figure 6 shows the time distribution of the Fermi LAT gamma-ray light
208
curve of 3C454.3 for almost two years of data and the corresponding selected
209
high state periods. With the hypothesis that the neutrino emission follows the
210
gamma-ray emission, the signal time PDF is simply the normalized light curve
211
of only the high state periods. The third column of Table 2 lists the flaring
212
periods for the ten sources found from September to December 2008.
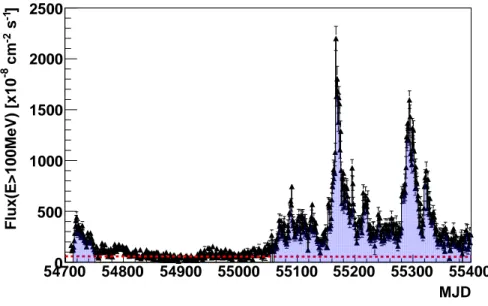
213 MJD 54700 54800 54900 55000 55100 55200 55300 55400 ] -1 s -2 cm -8 Flux(E>100MeV) [x10 0 500 1000 1500 2000 2500
Fig. 6. Gamma-ray light curve (black points) of the blazar 3C454.3 measured by the LAT instrument onboard the Fermi satellite above 100 MeV for almost two years of data. The shaded histogram (blue) indicates the high state periods. The dashed line (red) represents the fitted baseline.
The results of the search for coincidences between flares and neutrinos are
214
listed in Table 2. For nine sources, no coincidences are found. For 3C279, a
215
single high-energy neutrino event is found in coincidence during a large flare
216
in November 2008. Figure 7 shows the time distribution of the Fermi
gamma-217
ray light curve of 3C279 and the time of the coincident neutrino event. This
218
event was reconstructed with 89 hits distributed on ten lines with a track
219
fit quality Λ = −4.4. The particle track direction is reconstructed at 0.56◦
220
from the source location. The pre-trial p-value is 1.0 %. However, the
post-221
trial probability computed taking into account the ten searches is 10 %; this
222
occurrence is thus compatible with a background fluctuation. In the absence
223
of a discovery, upper limits on the neutrino fluence were computed and are
224
shown in the last column of Table 2.
MJD 54720 54740 54760 54780 54800 54820 54840 ] -1 s -2 cm -8 Flux(E>100MeV) [x10 0 50 100 150 200 250
number of coincident events
0 1 2
Fig. 7. Gamma-ray light curve (dots) of the blazar 3C279 measured by the LAT instrument onboard the Fermi satellite above 100 MeV. The light shaded histogram (blue) indicates the high state periods. The dashed line (green) corresponds to the fitted baseline. The red histogram displays the time of the associated ANTARES neutrino event.
5 Summary
226
This paper presents the first time-dependent search for cosmic neutrinos using
227
the data taken with the full twelve line ANTARES detector during the last four
228
months of 2008. For variable sources, time-dependent point searches are much
229
more sensitive than time-integrated searches due to the large reduction of the
230
background. This search was applied to ten very bright and variable Fermi
231
LAT blazars. One neutrino event was detected in time/direction coincidence
232
with the gamma-ray emission in only one case, for a flare of 3C279 in November
233
2008, with a post-trial probability of 10 %. Upper limits were obtained on the
234
neutrino fluence for the ten selected sources.
235
6 Acknowledgments
236
The authors acknowledge the financial support of the funding agencies:
Cen-237
tre National de la Recherche Scientifique (CNRS), Commissariat `a l’´energie
238
atomique et aux ´energies alternatives (CEA), Agence National de la Recherche
239
(ANR), Commission Europ´eenne (FEDER fund and Marie Curie Program),
240
R´egion Alsace (contrat CPER), R´egion Provence-Alpes-Cˆote d’Azur,
D´epar-241
tement du Var and Ville de La Seyne-sur-Mer, France; Bundesministerium
Source Vis timePDF(MJD-54000) LT N(5σ) Nobs Fluence U.L. PKS0208-512 1.0 712-5,722-4,745-7, 8.8 4.5 0 2.8 750-2,753-7,764-74, 820-2 AO0235+164 0.41 710-33,738-43,746-64, 24.5 4.3 0 18.7 766-74,785-7,805-8, 810-2 PKS1510-089 0.55 716-9,720-5,726-35, 4.9 3.8 0 2.8 788-90,801-3 3C273 0.49 714-6,716-8,742-5 2.4 2.5 0 1.1 3C279 0.53 749-51,787-809, 13.8 5.0 1 8.2 812-5,817-21,824-6 3C454.3 0.41 713-51,761-5,767-9, 30.8 4.4 0 23.5 784-801 OJ287 0.39 733-5,752-4,760-2, 4.3 3.9 0 3.4 768-70,774-6,800-2, 814-6 PKS0454-234 0.63 743-5,792-6,811-3 6.0 3.3 0 2.9 WComae 0.33 726-9,771-3,790-2, 3.9 3.8 0 3.6 795-7,815-7 PKS2155-304 0.68 753-5,766-8,799-801, 3.1 3.7 0 1.6 828-30 Table 2
Results of the search for neutrino emission in the ten selected sources. The meaning of the columns is the following: Vis: fraction of the time the source is visible at the ANTARES location; timePDF: high state periods of the light curve; LT: corre-sponding ANTARES live time in days; N(5σ): averaged number of events required for a 5σ discovery (50 % probability); Nobs: number of observed events in time/angle
coincidence with the gamma-ray emission. Fluence U.L.: Upper limit (90 % C.L.) on the neutrino fluence in GeV cm−2.
f¨ur Bildung und Forschung (BMBF), Germany; Istituto Nazionale di Fisica
243
Nucleare (INFN), Italy; Stichting voor Fundamenteel Onderzoek der Materie
244
(FOM), Nederlandse organisatie voor Wetenschappelijk Onderzoek (NWO),
245
the Netherlands; Council of the President of the Russian Federation for young
246
scientists and leading scientific schools supporting grants, Russia; National
Authority for Scientific Research (ANCS), Romania; Ministerio de Ciencia
248
e Innovaci´on (MICINN), Prometeo of Generalitat Valenciana and MultiDark,
249
Spain. We also acknowledge the technical support of Ifremer, AIM and Foselev
250
Marine for the sea operation and the CC-IN2P3 for the computing facilities.
251
References
252
[1] Becker, J.K. 2008, Phys. Rep., 458, 173. 253
[2] Urry, C.M., Padovani, P. 1995, PASP, 107, 803. 254
[3] Bloom, S.D., Marscher A.P. 1996, ApJ, 461, 657; Maraschi, L., Ghisellini, G., 255
Celotti, A. 1992, ApJL, 397, L5; Dermer C.D., Schlickeiser R. 1993, ApJ, 416, 256
458; Sikora, M., Begelman, M. C., Rees, M. J. 1994, ApJ, 421, 153. 257
[4] Gaisser, T.K., Halzen, F., Stanev, T. Phys. Rep. 258 (1995) 173; Learned, J.G., 258
Mannheim, K. Ann. Rev. Nucl. Part. Sci. 50 (2000) 679; Halzen, F., Hooper, D. 259
Rep. Prog. Phys. 65 (2002) 1025; Neronov, A., Ribordy, M. 2009, Phys.Rev., 260
D80, 083008; B¨ottcher, M. 2007, astrophys. space Sci., 309, 95. 261
[5] Abdo, A.A. et al. 2010, ApJ, 722, 520. 262
[6] Ageron, M. et al., Nucl. Instrum. Meth. A656 (2011) 11. 263
[7] Amram, P. et al., Nucl. Instrum. Meth. A484 (2002) 369. 264
[8] Aguilar, J.A. et al., Nucl. Instrum. Meth. A570 (2007) 107. 265
[9] Aguilar, J.A. et al., Astropart. Phys. 34 (2011) 539. 266
[10] Agrawal, V., Gaisser, T.K., Lipari, P. and Stanev, T. Phys. Rev. D53 (1996), 267
1314. 268
[11] Becherini, Y., Margiotta, A., Sioli, M., Spurio, M. Astropart. Phys. 25 (2006) 269
1; Carminati, G., Bazzotti, M., Margiotta, A., Spurio, M. Comp. Phys. Comm. 270
179 (2008) 915. 271
[12] Aguilar, J.A. et al., Astropart. Phys. 23 (2005) 131. 272
[13] Heijboer, A.
273
http://antares.in2p3.fr/Publications/thesis/2004/Aart-Heijboer-phd.pdf, PhD 274
thesis, Universiteit van Amsterdam, Amsterdam, The Netherlands. 275
[14] Adri´an-Mart´ınez, S. et al., ApJL 2011 accepted, astro-ph.HE/1108.0292v1. 276
[15] Neyman, J. 1937, Phil. Trans. Royal Soc. London, Series A, 236, 333. 277
[16] Abdo, A. A. et al. 2010, ApJS, 188, 405. 278
[17] Abdo, A. A. et al. 2010, ApJ, 715, 429. 279
[18] Aharonian, F. et al., A&A 430 865-875 (2005). 280
[19] Wagner, S. et al., HEAD 2010 27.06. 281
[20] Albert, J. et al., 2008a, Science, 320, 1752. 282
[21] Acciari, V.A. et al., 2008 ApJ 684 73-77. 283
[22] Monitored source list, http://fermi.gsfc.nasa.gov/ssc/data/access/lat/ 284