HAL Id: ird-01202110
https://hal.ird.fr/ird-01202110
Submitted on 18 Sep 2015
HAL is a multi-disciplinary open access
archive for the deposit and dissemination of
sci-entific research documents, whether they are
pub-lished or not. The documents may come from
teaching and research institutions in France or
abroad, or from public or private research centers.
L’archive ouverte pluridisciplinaire HAL, est
destinée au dépôt et à la diffusion de documents
scientifiques de niveau recherche, publiés ou non,
émanant des établissements d’enseignement et de
recherche français ou étrangers, des laboratoires
publics ou privés.
Visualization and Characterization of Heterogeneous
Water Flow in Double-Porosity Media by Means of
X-ray Computed Tomography Porous media
Z. Peng, Céline Duwig, P. Delmas, Jean-Paul Gaudet, A. Gastelum Strozzi, P.
Charrier, H. Denis
To cite this version:
Z. Peng, Céline Duwig, P. Delmas, Jean-Paul Gaudet, A. Gastelum Strozzi, et al.. Visualization
and Characterization of Heterogeneous Water Flow in Double-Porosity Media by Means of X-ray
Computed Tomography Porous media. Transport in Porous Media, Springer Verlag, 2015, pp.art.
0572. �10.1007/s11242-015-0572-z�. �ird-01202110�
uncorrected
proof
DOI 10.1007/s11242-015-0572-zVisualization and Characterization of Heterogeneous
Water Flow in Double-Porosity Media by Means of X-ray
Computed Tomography
Z. Peng1 · C. Duwig1,2 · P. Delmas3 · J. P. Gaudet1 ·
A. Gastelum Strozzi4 · P. Charrier5 · H. Denis1 Received: 25 March 2014 / Accepted: 4 September 2015 © Springer Science+Business Media Dordrecht 2015
Abstract Three-dimensional visualization of dynamic water transport process in soil by
1
computed tomography (CT) technique is still limited by its low temporal resolution. In order
2
to monitor dynamically water transport in soil, a compromise has to be found between water
3
flow velocity and CT acquisition time. Furthermore, an efficient image analysis method is 1
4
necessary. In this work, we followed the water transport in three dimensions by CT imaging
5
across a double-porosity media constituted of two distinct materials, i.e. sand and porous
6
clay spheres. The CT acquisition parameters were adjusted to the water pore velocity so that
7
we succeeded to register the water front displacement per time range of 25 min. We also used
8
the image subtraction method to extract water distribution evolution with time with a space
9
resolution of 6 × 10⁻³cm. Both time and space resolution are relatively high compared with
10
other dynamic studies. The water content profiles showed that the clay spheres remained
11
in their dry state during water infiltration, while the water transport only occurred in the
12
sand matrix. These results are consistent with macroscopic experiments. The water front
13
visualized by CT showed a non-symmetrical shape which was related to water transfer in
14
non-equilibrium as shown by column displacement experiments.
15
Keywords 3D visualization · Water transport · Computed tomography · Image analysis ·
16
Porous media
17
B
C. Duwigceline.duwig@ird.fr
1 IRD/UJF-Grenoble 1, LTHE UMR 5564, BP 53, Grenoble Cedex 9, France
2 LTHE, Bâtiment OSUG-B, Domaine universitaire, BP 53, 38041 Grenoble Cedex 09, France 3 Department of Computer Science, The University of Auckland, PB 92019, Auckland, New Zealand 4 UNAM, CCADET, Ciudad Universitaria, 04510 Mexico Cuidad, Mexico
5 UJF-Grenoble 1, 3SR UMR 5521, BP 53, Grenoble Cedex 9, France
uncorrected
proof
1 Introduction
18
Understanding water flow transport in porous media is a central issue to natural and engineered
19
soil science. Groundwater and vadose zone flow, contaminant transfer, and energy-related
20
activities such as geothermal energy production depend on the transport properties at pore
21
scale. To study the water transport properties in porous media, traditional methods exist
22
such as water retention (Schjonning et al. 2005;Holtham et al. 2007) and mercury intrusion
23
curves (Lugato et al. 2009) to estimate pore size distribution, or infiltration experiments to
24
estimate hydraulic conductivity (Angulo-Jaramillo et al. 2000). However, these macroscopic
25
techniques have some important drawbacks. These techniques are based on the hypothesis that
26
pores are represented by parallel tubes of different diameters. In the case of water retention
27
and mercury intrusion curves, they cannot provide an estimation of the pore shape as the total
28
porosity is calculated as the sum of accessible pores from the intrusion of the liquid (mercury
29
or water) so that unconnected pores are not detected.
30
Computed tomography (CT) of X-rays or neutrons provides reliable information at
31
microscale of porous media morphology (Sleutel et al. 2008;Luo et al. 2010;Dal Ferro
32
et al. 2012;Elyeznasni et al. 2012;Munkholm et al. 2012), multi-phase determination of
33
stationary, or transient flow (Hopmans et al. 1992;Wildenschild et al. 2005;Schaap et al.
34
2008;DiCarlo et al. 2010;Akhtar et al. 2011;Sammartino et al. 2012). According to
equip-35
ment resolution and sample size, individual grains and fluid interfaces at pore scale can be
36
achieved by CT. Furthermore, many physical and chemical phenomena occur at this scale
37
and determine soil characteristics and transport properties at macroscale.
38
One particular interest to apply CT is to observe transport phenomena across
heteroge-39
neous unsaturated porous media to better understand the impact of porous structure (pore
40
size, connectivity and porosity) on water transport properties. Indeed, the temporal and spatial
41
distribution of water in soil resulting from heterogeneous water flow is affected by the soil
42
structure, i.e. the spatial arrangement of its constituents. When the materials constituting the
43
porous media differ in size and hydraulic properties, the water distribution and flow paths can
44
reveal high complexity. However, the role played by the geometry of solid and voids and the
45
hydraulic properties of the different constituents is still unclear (Vogel and Roth 2003). Since
46
the CT techniques are able to visualize simultaneously the spatial and temporal distribution
47
of solid and liquid phases in 3D (Heindel et al. 2008;Wildenschild and Sheppard 2013), this
48
latter seems to be a good approach to overcome the lack of knowledge. Only a few authors
49
performed spatio-temporal studies of soil behaviour using CT technologies (Schaap et al.
50
2008;Vasin et al. 2008;Kneafsey et al. 2011;Sammartino et al. 2012). This is both due to
51
the trade-off between acquisition time and image quality and resolution creating a difficult
52
balance between low temporal resolution and acceptable spatial resolution. Consequently,
53
most studies of water transport in transient states were based on 2D radiography (Hopmans
54
et al. 1992;Maruyama et al. 2003;Carminati et al. 2007,2008;DiCarlo et al. 2010;Esser
55
et al. 2010).Hopmans et al.(1992) studied water infiltration during one-step outflow
experi-56
ments on repacked homogeneous samples of a sandy soil.Maruyama et al.(2003) recorded
57
the movement of soil water occurring in an Andosol sample using X-ray with a liquid
con-58
trast agent. However, the effect of the contrasting agent on the fluid physical and chemical
59
properties and its flow pattern compared to pure water was not discussed.Carminati et al.
60
(2007,2008) monitored the water exchange in 3D between wet and dry aggregates and
sim-61
ulated the observed water flow and water content distribution with Richards equation using
62
synchrotron-based X-ray tomographic microscopy.
63
uncorrected
proof
The 3D measurement of water content distribution in heterogeneous sands during
multi-64
step drainage cycles was reported bySchaap et al.(2008) andVasin et al.(2008). The later
65
used a combination of “fast” 2D neutron transmission tomography to image relatively “slow
66
transient drainage processes” (at a resolution of 0.027 cm and an acquisition time of 20 s)
67
combined with computed tomography to compute a 3D mapping of the studied sample (at
68
the same spatial resolution for an acquisition time of 2 h).Kneafsey et al.(2011) proposed an
69
indirect analysis method by observation of density changes of CT signals caused by hydrate
70
formation and water flowing in samples of methane-hydrate bearing sand.Sammartino et al.
71
(2012) used a medical four-slice helical computed tomography to attain fast acquisition of 2D
72
slices at 0.0625 cm thickness. This method provides new quantitative information on
pref-73
erential flow processes occurring in an unsaturated undisturbed soil as well as demonstrates
74
the potential for the dynamic imaging of infiltration experiments. However, several obstacles
75
in image quality persist such as low signal-to-noise ratio due to low energy of medical X-ray
76
tomography (to protect the patients) and loss of water detection due to low spatial resolution
77
as typical of commercial medical imaging apparatus.
78
To our knowledge, a dynamic approach of the 3D visualization of water flow at the
micro-79
scopic and macroscopic scales (defined as pore scale and sample scale respectively) based
80
on a compromise between spatial and temporal resolution in unsaturated porous media has
81
still not been achieved. Under this context, the goal of this work was to monitor and
charac-82
terise the 3D water flow path by computed tomography (CT) during dynamic experiments at
83
microscale spatial resolution at regular temporal increments. The CT study in a natural soil
84
reveals many difficulties such as large amount of diverse constituents, low scanned porosity
85
compared with total porosity, and large heterogeneity. As a proof of concept, the natural soil
86
was replaced by a known double-porosity media constituted of spheres made of sintered clay
87
(intra-aggregate pores at nanometre scale) and sand (inter-aggregate pores at micrometre
88
scale). The presence of two different porous media (sand and porous clay spheres) leads to a
89
heterogeneity in structure and impacts hydraulic properties. Consequently, different dynamic
90
processes at local scale between the two pore systems influence the macroscopic behaviour of
91
the media (Lewandowska et al. 2004). Water transport in double-porosity media, by numeric
92
and experimental approaches, has been extensively studied by Lewandowska and colleagues
93
(Lewandowska et al. 2004, 2005a,b, 2008; Szymkiewicz et al. 2008;Szymkiewicz and
94
Lewandowska 2008). They observed that the macroscopic behaviour of the double-porosity
95
media was mainly affected by the degree of heterogeneity of pores (local geometry and
96
conductivity contrast). Nevertheless, their numeric modelling with experimental results was
97
only validated at macroscopic scale and the kinetics at microscopic scale was not checked.
98
To overcome this lack of knowledge, we worked on the visualization and
characteriza-99
tion of heterogeneous water flow in a double-porosity media at the microscale interface
100
(6 × 10⁻³cm resolution) by means of X-ray computed tomography from an initial state (dry
101
state) to a saturated state (fully wet) following a infiltration experience. The objective was:
102
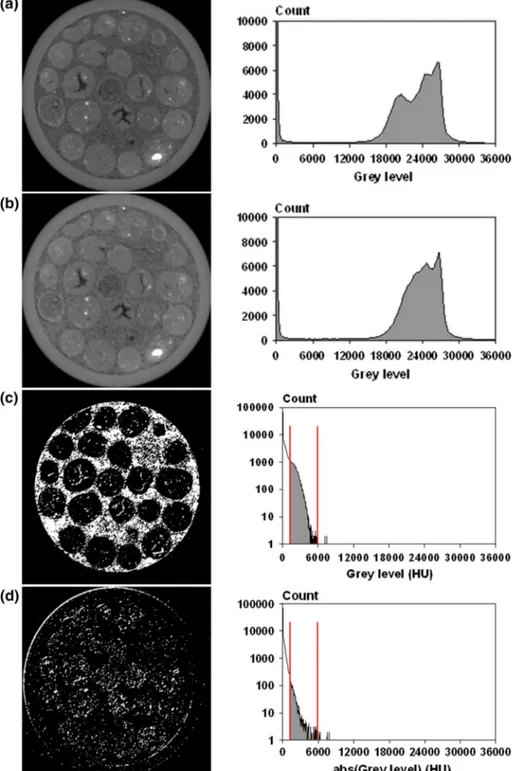
(i) to demonstrate the feasibility of CT technique to visualize water flow through
heteroge-103
neous porous media in 3D, (ii) to develop an adequate image analysis technique for image
104
acquired at different water content conditions, and (iii) to characterize water flow in the two
105
medium. The developed methodology in this study allows visualizing and characterizing the
106
3D water flow at water pore velocity in the range of saturated hydraulic conductivity of fine
107
sand.
108
uncorrected
proof
2 Material and Methods
109
2.1 Sample Preparations
110
2.1.1 Material Characterization
111
The double-porosity (DP) media are a physical model composed of sintered clay spheres
112
(biolite: ceramic shell with honeycomb core produced by firing natural clay to temperatures
113
of 1100–1200◦C in a rotating kiln) and Hostun sand (HN34). Mineralogical composition
114
of Hostun sand is mainly quartz (SiO2 > 98 %, Desaunay 2011). Its granulometry was
115
characterized by laser diffractometry (Mastersize, Malvern), and its mean grain diameter
116
was 0.0275 cm with a relatively uniform grain size distribution. The total porosity of sand
117
after packing was around 0.43 (see Table1).
118
The clay spheres porosity was determined by mercury porosimetry (AutoPore IV 9500,
119
Micromeritics). Connected porosity was 0.445 with media intra-aggregate pore size 4 ×
120
10−6cm. Solid and bulk densities of sintered clay spheres were also determined by mercury
121
porosimetry with values of 2.38 and 1.32 g cm−3 respectively. Average diameter of clay
122
spheres is 0.5 ± 0.1 cm. The permeability was estimated from mercury intrusion curves
123
through the XDQ code (Xu et al. 1997) with value of 3.3 × 10⁻¹²cm2which corresponds
124
to a hydraulic conductivity of 3.23 × 10⁻⁷cm s−1for water. This value is six times smaller
125
than that of clay spheres used inLewandowska et al.(2008) andTran Ngoc(2008).
126
2.1.2 Column
127
The double-porosity media (previously dried during 24h at 105◦C) were filled into a glass
128
column (inner diameter 2.6 cm and height 10 cm, Fig.1b), by packing the two constituents
129
(sand and clay spheres) in a periodic manner (Fig.1a) followingLewandowska et al.(2008)
130
andTran Ngoc(2008). The spheres were carefully arranged by hand in a homogeneous
131
distribution for each layer. Voids between spheres were filled by sand. This process was
132
repeated by placing layer by layer up to fill the whole column (Fig.1b). Although the spheres
133
and their packing were not completely homogeneous, the average height of the periodic
134
arrangement was 0.87 cm, as controlled by porosity determination from CT scan (twice the
135
distance between porosity maximum on Fig.1c). Three columns were built up each with an
136
equal weight fraction of sand and clay spheres (Table2). The total porosity of the DP column
137
was calculated to be around 0.44 whereas the visible porosity at CT scan resolution and pixel
138
averaging was on average 0.18.
139
2.2 Infiltration Experiment and Setup
140
The set-up representation is shown in Fig.1d. The column was vertically connected to a water
141
inlet at the top side and an outlet at the bottom side. At each side, the double-porosity media
142
were maintained by a rigid grid covered with a porous membrane. The boundary condition at
143
inlet, i.e. the water flow rate, was controlled by a peristaltic pump which was connected to a
144
water tank for water supply. The water tank was closed to avoid water evaporation. A constant
145
capillary pressure head of −60 cm was imposed at the base of the column, and the leachates
146
returns to the water tank. The weight evolution of water tank was monitored by a Mettler
147
Toledo microbalance connected to a computer. The maximum error of observations was 0.01
148
g, which corresponds to an accuracy of ±0.002 cm height of water. The room temperature
149
varied between 23 and 24◦C.
150
uncorrected
proof
Ta b le 1 Physical characteristics of the tw o media Medium Elementary p article size (cm) Sk eleton specific density (g cm − 3) Dry b ulk d ensity (g cm − 3) Mean porosity Pore sizes (cm) Ks, h ydraulic conducti vity at saturation (cm s − 1) HN34 sand 0 .0275 2 .66 a 1.51 0.43 – ∼ 3 × 10 − 5 Sintered clay spheres 0 .4–0.6 2 .38 1 .32 0 .45 b 4 × 10 − 6b 3 .23 × 10 − 7c Double-porosity media – – 1 .44 0 .44 – – aObtained from Desaunay ( 2011 ) bIntra-aggre g ate pores, obtained by mercury porosimetry cObtained with XDQ model ( Xu et al. 1997 )Author Proof
uncorrected
proof
Fig. 1 a Geometric representation of clay spheres arrangement; b schematic representation of column size; c evolution of porosity as determined by CT scan (for pores >6.3 × 10⁻³cm) with depth; d schematic representation of infiltration setup and its installation in CT measurements
Assuming the weight loss in the water tank is equal to the weight gain in soil column
151
(without taking into account the water volume in capillaries), this latter provides the
deter-152
mination of water content evolution of the soil column as a function of time during transient
153
regime.
154
Before initiating the dynamic CT imaging experiment, three water flows were tested in soil
155
columns with identical geometry to estimate water infiltration travel time in the soil column.
156
Before each infiltration, the porous media were initially kept air-dry, and the quantity of each
157
media (sand and clay spheres) was separately measured with the microbalance before packing
158
in column. The details of infiltration experience for each column are showed in Table2.
2 159
The dispersivity coefficient of the double-porosity (DP) media was determined during a
160
tracer displacement experiment in column 1, at Darcy water velocity of 6.59 × 10⁻⁴cm s−1.
161
When the water flow reached the steady state, a pulse of KBr solution (670 mg Br l−1)of
162
around 1.1 pore volume was injected at the top of the column. The pore volume is defined
163
as the volume of water in the column at steady state. Leachates were collected at the bottom
164
of the column every 5 min, and Br concentration was analysed with ionic
chromatogra-165
phy (Metrohm). Convection–dispersion transport parameters were determined from the Br
166
breakthrough curve using the CXTFIT 2.1 code (Toride et al. 1999) in inverse mode. A
167
homogeneous HN34 sand column was studied in the same set-up for comparison, with the
168
same Darcy velocity, KBr solution, and injected pore volume, and the only difference was
169
the leachates collection time (every 10 min).
170
2.3 CT Scanner Acquisition Parameters
171
The infiltration experiment was dynamically imaged using X-ray tomography technologies
172
(TomRX solutions) in the 3SR (Soils, Solids, Structures and Risks) Laboratory, Grenoble,
173
France. The CT scan equipment is calibrated one during the day prior to initiating
uncorrected
proof
Ta b le 2 Details of column constitution and parameters for infiltration experiences Sand weight (g) Clay spheres weight (g) Darc y fl o w (cm s − 1) T ime range of w ater front displacement (min) Theoretical inter -aggre g ate porosity a Measured w ater content b(cm 3cm − 3) Column1 38.5 36.7 6 .59 × 10 − 4 ∼ 46 0.186 0.174 Column2 36.7 37.6 2 .83 × 10 − 4 ∼ 108 0.179 0.174 Column3 38.1 3 8 6 .41 × 10 − 5 ∼ 474 0.181 0.179 aPorosity between sand grains, and b etween sand grains and clay spheresAuthor Proof
uncorrected
proof
iments. The calibration object consisted of a set of vertically aligned lead spheres which
174
are image with the same CT parameters as our samples, which are later input in the CT
175
reconstruction software. Later the infiltration set-up was installed, and the core column was
176
aligned to the X-ray beams in order to maximize the signal gain onto the captor. The sensor
177
size is of 1300 by 1920 pixels. In order to scan the whole column, the distance from source
178
to objet was adjusted so that the sensor height captured the entire column height, i.e. 1600
179
pixels for a height of 10 cm, which leads to a spatial resolution of 6.3 × 10⁻³cm in all three
180
dimensions.
181
Computed tomography generates a three-dimensional image of the inside structure of
182
the studied porous media by acquiring two-dimensional X-ray images (N ) taken around a
183
single (vertical) axis of rotation (Herman 2009). To reduce the signal-to-noise ratio, each
184
final 2D radiographic image is usually computed as the average of n images acquired at the
185
same angular position. Given our experimental constraints, a compromise must be made to
186
minimize the radiographic images acquisition time while maintaining a balanced
signal-to-187
noise ratio and 3D reconstruction accuracy. The acquisition time T is given by the following
188
equation:
189
T = N × n × τ (1)
190
where N is the angular increment onto a defined angular section between 0 and 360◦; n is
191
the amount of repetition per angular position for the averaging process; τ is the pause time
192
between two image captures at the same angle.
193
By performing different tests, the optimal CT acquisition parameters to ensure suitable
194
image quality and acquisition time were found as followed: the value of N was fixed at 1200
195
for all the scans onto an angular section of 360◦. The value of n which determines the noise
196
level was fixed at 8. The value of τ for a significant signal acquisition was adjusted at 0.1 s
197
(10 images per second) for all the scans.
198
The photon energy of X-rays (the spot energy) depends on the generator excitation. The
199
relationship between transmission coefficient of each media (gas, liquid, and solid) and
200
photon energy is different: low photon energy leads to high transmission coefficient contrast
201
that allows better distinguishing different media, but low photon transmission due to low
202
photon energy requires long acquisition time. High photon energy leads to high photon
203
transmission and short acquisition time resulting in reduced transmission coefficient contrast
204
(Markowicz 1993). Accordingly, we did set for the whole experiment a tension of 100 kV and
205
a current of 300 µA to excite the generator as the best compromise to distinguish between
206
water and sand.
207
This CT parameter configuration led to a temporal resolution of around 25 min per scan
208
(refer to a full 360◦tomography acquisition). The pore velocity of water was slowed down
209
to achieve a travel time significantly higher than 25 min. In column 3, we used a low water
210
flow rate (3.4 × 10⁻⁵cm3s−1, which corresponds to a Darcy velocity of 6.4 × 10⁻⁵cm s−1
211
or about 2.2 % of saturated hydraulic conductivity of sand) and a theoretical travel time of
212
the water front of 8h (see Table2). The initial CT scan of the column was acquired at dry
213
state. Ten CT scans were performed during the infiltration experiment. Considering the Darcy
214
velocity and the three-dimensional voxel resolution of 6.3 × 10⁻³cm during CT imaging,
215
the vertical water front travelled across each voxel (of thickness 6.3 × 10⁻³cm) in 94 s. An
216
acquisition time of 25 min roughly corresponds to an uncertainty on the water front position of
217
16 voxels. This is equivalent to a resolution at the water front edge close toSammartino et al.
218
(2012) while achieving a resolution 13 times better anywhere else in the imaged column. The
219
data volume (1920 images slices of 700 by 700 pixels) was reconstructed using the snapCT
220
software which allowed for GPU processing acceleration. Iterative construction and adequate
221
uncorrected
proof
filtering reduced reconstruction ring artefacts and beam-hardening effects while preserving
222
the sol core features.
223
2.4 Image Processing and Analysis
224
The reconstructed soil core data volume was provided as a set of 1920 images encoded in
225
16 bits greyscale TIFF images with an effective 14-bit intensity dynamic range. This allows
226
for 65,256 shades of grey to encode material density from dark (corresponding to air or
227
vacuum) to white (for material stopping the penetrating X-rays). The images numbered 0–
228
100 and 1700–1919 were first removed as they mostly contained the top and bottom for
229
flow inlet and outlet located above and below the soil sample. The remaining 1600 images
230
were processed using the ImageJ software (Schneider2012). They were first cropped and
231
cut to remove all non-porous media elements leading to images of dimension 410 by 410
232
pixels (410 pixels for a width of 2.6 cm, which leads to a spatial resolution of 6.3 ×10⁻³cm).
233
Three-dimensional median filtering (Serra1983) was then applied to remove isolated artefacts 3
234
typically occupying a volume of less than 3 by 3 by 3 voxels while preserving edges of the
235
larger macropores network.
236
Given the difficulty to use traditional segmentation techniques to separate the macropore
237
system during the infiltration event, a specific technique using subtraction of soil voxels
238
between the dry state and any of the CT volume acquired during the infiltration event is
239
presented in the Sect.2.5.
240
2.5 Wet Pores Network Thresholding
241
2.5.1 Traditional Segmentation Method
242
One of the most difficult steps to extract water distribution from the CT image is to threshold
243
the grey level corresponding to water. This latter is not straightforward: on the one hand,
244
the presence of water contributes to a spectral shift showed by the close grey levels between
245
water and dry porous media, due to similar material densities (Fig.2a). On the other hand,
246
the spectral shift due to water contribution varies as a function of water content contained
247
in the investigated porous media volume (Sammartino et al. 2012). Furthermore, the water
248
distribution in the porous media column is never homogeneous along the vertical axe neither
249
in horizontal plans. Therefore, a fixed threshold value cannot be adapted to extract water
250
across all the slices.
251
2.5.2 Subtracted Image Method
252
As the traditional segmentation methods could not be applied to our images, we proposed
253
an alternate method based on the subtraction of CT image acquired at dry state from the one
254
acquired at wet state. This method is used currently in petroleum engineering since the late 4
255
80’s.Withjack(1988) andAkin et al.(2000) determined the porosity by a dual scan at the
256
same location obtained with different fluids saturating the porous medium.
257
Theoretically, the image obtained from subtraction only contains water signal if the
fol-258
lowing conditions are satisfied:
259
(1) The soil sample never moved (above the imaging resolution −6.3 × 10⁻³cm) during
260
the infiltration experiment and successive scanning sequences;
261
(2) The optical configuration of the CT scan never changed during the infiltration experiment;
262
uncorrected
proof
Fig. 2 a Grey-level histograms of the whole column (1600 slices) at different states; b subtraction of dry
histogram from histograms at different time range during infiltration experience
(3) The inner soil structure did not change (above the imaging resolution −6.3 × 10⁻³cm)
263
during the infiltration experiment and successive scanning sequences.
264
Both conditions (1) and (3) were verified following the same process: the physical imprints
265
of the column container (condition 1) and of the sand grains in the soil core (condition 3)
266
were compared before the infiltration experiment start (first CT scan) and at the saturated
267
state (last CT scan). The plastic container and the sand grains were isolated out of the
268
soil core in both first and last CT scan data using traditional segmentation methods (e.g.
269
histogram segmentation). The resulting binary images for the first and last CT scan data were
270
subtracted. The resulting difference for the plastic container only displayed isolated pixels
271
likely representing acquisition noise and/or actual displacement of the studied structure below
272
the imaging resolution (6.3 × 10⁻³cm). This confirmed condition 1. The difference image
273
of the sand grains exhibited a set of pixels located at the periphery of some of the sand grains.
274
Overall this did not account for more than a few per cent of the overall sand grains pixels
275
count and it was considered that condition 3 is loosely verified up to the imaging resolution.
276
The condition (2) was checked by following the evolution in time of the grey-level histogram
277
of the glass tube in which the porous media were packed. As the glass tube is completely
278
inert to its inner content, the grey level of the glass tube contour is invariant whatever the
279
uncorrected
proof
Fig. 3 Left glass layer of the column on the slice no. 1000; Right glass layer grey-level histograms of the
slice no. 1000 at different time range during infiltration experience
state of its inner content. As consequence, the only possibility leading to a variant grey level
280
of the glass tube is the optical configuration change. As the observed grey level of the glass
281
tube was found constant, the condition (2) is satisfied. An example of the slice no. 1000 (the
282
slice situated at the middle of the column) is shown in Fig.3: the grey-level histograms of
283
this slice displayed the same distribution during the infiltration experience. This validates
284
our hypothesis.
285
3 Results and Discussions
286
3.1 Hydrodynamic Parameters of the Double-Porosity Media
287
The gravimetrical measurement of water content during infiltration is shown in Fig. 4a.
288
In HN34 sand media, water filled into the inter-aggregate pores until the steady state was
289
achieved with a water content of 0.29 cm3cm−3 which is lower than the inter-aggregate
290
porosity of HN34 sand (0.44). This latter can be explained by the Darcy flow applied of
291
6.59 × 10⁻⁴cm s−1which is lower than the saturated conductivity of HN34 sand and by
292
the imposed lower boundary condition. In the double-porosity (DP) media, two phases were
293
observed with different water infiltration kinetics. During the first infiltration phase, the
294
increasing weight of infiltrated water was rapid and stable; the water content at the end of
295
the first phase seems to be independent of water flow rates. In the second phase, the water
296
infiltration was significantly slowed down. We cannot explain the small peak between the
297
two phases.
298
By knowing the sand/clay spheres quantities (see Table2), bulk density and porosity of
299
each media (Table1), we calculated the inter-aggregate voids volume of the double-porosity
300
column (i.e. not taking into account the intra-aggregates voids inside the clay spheres). We
301
found an inter-aggregate porosity of 0.18 cm3cm−3, whereas the water content at the end of
302
the first phase was around 0.17–0.18 cm3cm−3whatever the soil column. We can conclude
303
that for the first phase, the water filled only the inter-aggregate porosity and did not enter
304
the clay spheres. This water content value also corresponds to the average visible porosity as
305
determined by CT.
306
uncorrected
proof
Fig. 4 a Gravimetrical measurement of water content as function of infiltration time for different columns; b experimental (exp) and simulated (sim) breakthrough curves in the double-porosity (DP) and sand (HN34)
column, with Darcy velocity of 6.59 10−4cm s−1
For the second phase, the slow increase in water content in the DP media can be due
307
to filling of water into the clay spheres, at long infiltration time. By comparison, the water
308
content in the HN34 sand media which were obtained in the same set-up did not increase
309
when steady state was achieved. To verify this latter hypothesis, a simple test was performed
310
by immerging 13 clay spheres in water and weighting them at different time intervals. Water
311
content evolution with time of the 13 clay spheres is also shown in Fig.4a. Even immerged
312
in water, the water infiltration kinetic in clay spheres is slower than the infiltration kinetic in
313
HN34 sand or DP media. This result shows that the increase in water content observed in the
314
second phase in the DP media is certainly due to water infiltration inside clay spheres. One
315
should be noted that this infiltration of water in clay spheres occurred at very large timescale
316
which is out of our CT experience as described later.
317
To determine the hydrodispersive parameters of the DP media, the breakthrough curve
318
(BTC) of Br was registered after the gravimetrical water content measurement in DP column 1
319
in which the Darcy flow was 6.59×10⁻⁴cm s−1. For comparison, another BTC was registered
320
in HN34 sand column with the same Darcy flow. In permanent regime, the water contents
321
were 0.188 and 0.29 cm3cm−3for DP and HN34 sand column respectively. Br transport in
322
uncorrected
proof
the HN34 sand column was in equilibrium, with a retardation of 1.1, and a dispersivity of
323
0.07 cm. As observed on Fig.4b, Br BTC in the DP media goes out earlier than Br in the sand.
324
Supposing that Br retardation was the same in the sand and in the DP media, the equilibrium
325
convection–dispersion equation could not be fitted to the Br BTC in the DP media. By fitting
326
the non-equilibrium convection–dispersion equation, we found a dispersivity of 0.13 cm, a
327
mobile water content ratio of 0.86, and solute exchange rate between mobile and immobile
328
regions of 6.6 × 10⁻¹²s−1. For comparison,Tran Ngoc(2008) found a dispersivity value of
329
0.69 cm in their DP media under unsaturated conditions (0.313 cm3cm−3)to be compared
330
to a dispersivity of 0.044 cm in the sand at a water content of 0.355 × cm3cm−3(Sato et al.
331
2003). Although the water content and the Darcy velocity in our experiment were lower, 5
332
and knowing that Tran Ngoc worked with a finer sand (HN38, with a mean grain diameter
333
of 0.0162 cm), we found the same increase in dispersivity in the heterogeneous medium
334
compared to the homogeneous medium (Toride et al. 2003) .
335
In our experiment, we applied a pulse input and the shape of BTC in the DP media was
336
slightly dissymmetrical with an early breakthrough of Br compared to one pore volume, while
337
it shows a typical convective/dispersive feature in HN34 sand (Fig.4b). Bromide transport
338
in the DP media was in physical non-equilibrium, with 14 % of the water content not
par-339
ticipating in the transport. The exchange between immobile and mobile water is very slow
340
(rate of 6.6 × 10⁻¹²s−1)explaining the nearly symmetrical curve.Tran Ngoc(2008)
reg-341
istered the BTC by applying the water tracer as a step input in homogeneous media (sand)
342
or heterogeneous media (double porosity). They found that the BTC in homogeneous sand
343
was symmetrical, while the BTC in double-porosity media showed no-Fikian characteristics
344
with rapid early breakthrough of the tracer (NaCl) at short times and a drag effect of solute
345
concentration at long time. Furthermore, they also simulated a BTC by assuming that the
346
embedded clay spheres were impermeable; in this case, the breakthrough of tracer
concen-347
tration was later observed, and the drag effect of solute concentration was reduced even in
348
the presence of clay spheres. They concluded that the early breakthrough and drag effects
349
were due to the presence of porous embedded clay spheres.
350
Characteristic times were calculated for our DP displacement experiment: resident solute
351
time was 2857 s, whereas the convective time was 2446 s, to be compared to time of exchange
352
between mobile and immobile water zone: 3.9 × 10¹⁰s and diffusive time: 6.6 × 10¹⁰s. It
353
shows clearly that the main process is the convection during the time of the displacement
354
experiment (total duration of 16,800 s) and that diffusion of water in the clay spheres will
355
happen at longer times. As shown in Table1, the Ks value of clay spheres used in this work,
356
obtained by XDQ code (Xu et al. 1997), is six times smaller than that ofTran Ngoc(2008). As
357
consequence, the convective transport in the clay spheres is negligible. This led to the nearly
358
symmetrical BTC. According to these macroscopic results, it validates our above results from
359
gravimetric measurements that the water transfer occurred mainly in the pores between sand
360
grains and that the clay spheres were weakly wetted during water transport.
361
It has to be noted that the Darcy flow applied during infiltration in CT experience was only
362
6.41 × 10⁻⁵cm s−1which is 10 times smaller than this applied in BTC measurement, in
363
the aim to slow down water front displacement for CT measurements. As a consequence, the
364
water distribution as well as the water transport properties in the column can be different with
365
these two applied flows. In the work ofTran Ngoc(2008), numerous BTC measurements
366
were performed in homogeneous HN38 sand and heterogeneous double-porosity media, at
367
different Darcy flows under unsaturated and saturated conditions. Whatever the homogeneous
368
or heterogeneous media, they showed increasing early breakthrough and drag effects at
369
saturated state compared to unsaturated states. We might thus have a decrease in immobile
370
water content for lower Darcy flow, such as our infiltration experiment in the CT.
371
uncorrected
proof
3.2 Images Analysis and Water Distribution Extraction/Determination372
3.2.1 Traditional Segmentation Method
373
Figure2a shows the original grey-level histograms of the whole column as a function of
374
infiltration time range. Each histogram is the sum of histograms of 1600 slices forming
375
the column and corresponds to the value registered during the acquisition time range (25
376
min). In order to clarify the band assignments, the histogram at dry state was subtracted to
377
each histogram at different time range during the infiltration (Fig.2b). As the histograms
378
mathematically (not spatially) refers to grey-level counts of all the voxels summed at the
379
whole column, the difference of histograms between dry state and infiltration at given time
380
range gives insights into the grey-level band assignments, i.e. the counts of a positive peak is
381
equal to the amount of voxels (with unknown spatial coordination), in which the grey level
382
changed from initial state to a given state according to the experiences. In our case, during
383
infiltration (a wetting process), the two positive peaks (positioned at grey-level bands of
384
20,991–25,855 and 25,855–29,951) are due to the presence of water which leads to spectral
385
shift towards higher grey level in the range of 20,000–30,000. The adjacent negative peak
386
(grey-level band of 13,311–20,991) corresponds to the loss of initial void (air) that was
387
filled by water during infiltration. As well, the signs of these peaks would be inversed if we
388
performed a drying process (not done). Using the corresponding grey-level band of these
389
peaks, the different phases were not so clearly separated when the images were segmented
390
using traditional techniques (e.g. histogram segmentation using the above grey-level bands
391
limits as lower and upper thresholds). Figure5shows the slice no. 1000 at wet state (time
392
range 270–295 min), while the whole grey-level distribution is given in Fig.5a. The grey-level
393
band of 13,311–20,991 (Fig.5b) which corresponds to pixels representing air also shows a
394
major occupation in the sand, in a clay sphere near the centre of the core. The grey-level
395
band of 20,991–25,855 (Fig.5c) seems to represent the water in the sand matrix and inside
396
clay spheres. The band of 25,855–29,951 (Fig.5d) shows the remaining contribution of clay
397
spheres and glass layer.
398
3.2.2 Subtracted Image Method
399
The subtracted image method is illustrated in Fig.6with the slice no. 1000: Fig.6a
cor-400
responds to the dry image and its grey-level values distribution (presented as a histogram);
401
Fig.6b corresponds to wet image of the same CT slice and its respective grey-level values
402
distribution. The resulting subtracted image with positive grey levels (Fig.6c) showed a
dis-403
tinct separated phase with major water contribution in sand and slight contribution in clay
404
spheres. Given their respective density, the water-filled pixels have higher grey-level values
405
than the air/vacuum filled pixels. Pixels which were filled with air in the reference stack (dry
406
state) and are now filled with water at time t exhibits positive grey-level values on the
sub-407
tracted image. The materials which were optically and geographically invariant during the
408
infiltration lead to the grey level of 0. The subtracted image also showed a range of negative
409
grey levels (Fig.6d). InSammartino et al.(2012), it was considered that the range of negative
410
grey values may correspond to voxels where the water was initially present but had left at
411
time t. However, a negative range of grey level does not have a physical sense in our case, as
412
we used an “artificial” porous media initially at the dry state. The only possibility to explain a
413
negative value in our case is that at a given pixel position, the sand grain moved from several
414
micrometres during water infiltration and was replaced by air or water which results in a
415
negative value while image subtraction. The image of negative grey levels only showed an
416
uncorrected
proof
Fig. 5 Image segmentation of the slice no. 1000 at time range 270–295 min of infiltration, with visual images at
leftand corresponding grey-level band at right for three segmentation ranges: a whole range; b 13,311–20,991;
c 20,991–25,855; d 25,855–29,951
uncorrected
proof
Fig. 6 Example of the slice no. 1000 with visual images at left and corresponding grey level band at right for a slice of dry state; b slice of wet state at time range 270–295 min; Binary subtracted image with c positive
grey levels; d negative grey levels
uncorrected
proof
Fig. 7 Example of water content profile obtained with CT images at time range 150–175 min: a vertical CT
water profile (subtracted image), the void and filled by water volumes are represented by black and white colours, respectively; b water content profile obtained with 3D CT images: each point showed the average water content per layer of 1 cm (160 slice per layer); c the histogram sum of 160 slices comprised in each layer of 1 cm thickness
opaque mask with low statistic bins count (the range included in red interval, Fig.6d). We
417
believe that these negative pixels/voxels may relate to the “diffuse matrix” (inSammartino
418
et al. 2012) that is voxels/pixels which were filled by a combination of air and soil at the dry
419
state and are constituted by a combination of water and soil at time t. This combined with
420
microdisplacement of the sand grains below the imaging resolution may result in an apparent
421
voxel grey-level value lower at time t, thus creating subtracted image voxels with negative
422
pixel values. This is consistent with our hypothesis in condition (3). As a consequence, the
423
discussion concerning the water transport was rather focused on the image obtained with
424
positive grey levels. Compared to what was obtained by traditional segmentation method,
425
we found that the subtracted image method showed much higher image quality, especially
426
in terms of water distribution.
427
Finally, all the 1600 slices of subtracted image were segmented and converted in binary
428
format with pixel values 0 and 1 for, respectively, void and water. Considering that all pores are
429
filled with water above the infiltration front, the threshold for binary image segmentation was
430
chosen so that the average water content in wet layers of the last scan (at time range of 270–295
431
min) was close to the theoretical inter-aggregate porosity of the column 3 (0.181 cm3cm−3).
432
Water content of each slice was then calculated as the ratio of water bins count onto the total
433
bins count of column section. An example is shown in Fig.7: at the time range of 150–175
434
min during the infiltration, vertical water profile (Fig.7b) is calculated from water contents
435
averaged over 1 cm (160 slices) which is about the height of the periodic layer. The subtracted
436
CT image profile (Fig.7a) is also showed for comparison. The water content profile (Fig.7b)
437
showed consistent evolution with subtracted CT images (Fig.7a), i.e. water front lies between
438
4 and 6 cm in depth and water content drops to 0 below 6 cm. As well, statistical bins account
439
on the grey-level histograms (Fig.7c) decreased layer by layer from 0 to 6 cm (the layers of
440
0–1 and 1–2 cm were not shown because they exhibited the same histogram than the layer
441
of 2–3 cm) and reached a minimal account below the layer of 6–7 cm.
442
3.3 Evolution of 2D Water Profile and Water Front in 3D
443
With lastly mentioned method, evolution of vertical water profiles in column 3 with time is
444
shown in Fig.8and compared with corresponding CT images. According to the CT images
445
(Fig.8left), sphere voids appeared behind the water front and maintained their void shape
446
uncorrected
proof
Fig. 8 Left Vertical CT water profiles, the void and filled by water volumes are represented by black and white
colours; Right water content profiles, for the time ranges of a 90–115 min, b 150–175 min and c 210–235 min
uncorrected
proof
Fig. 9 3D water volume reconstruction at different time ranges of the infiltration
along water front advance. These sphere voids correspond logically to clay spheres and
447
showed that little water filled into clay spheres during infiltration. This is consistent with
448
what found in gravimetrical measurement. On the water content profiles (Fig.8right), two
449
different control volumes are compared. The low resolution corresponds to the average of
450
water content over around one periodic layer (every 1 cm) and the high resolution (HD) to a
451
step of 0.25-cm height. The HD profiles showed clearly fluctuating profiles compared to these
452
of low resolution. This latter can be explained by the sensibility of HD profile associated with
453
local constitution of sand and clay spheres at different layers. As water hardly filled into clay
454
spheres, water content is lower in the layers where more clay spheres are present. As well,
455
while water content is averaged over more slices (low definition), the corresponding water
456
content is found similar to average inter-aggregate porosity of double-porosity media and the
457
profiles exhibit less fluctuation. The periodic layer is thus a good representative elementary
458
volume for water content calculation.
459
By the 3D reconstruction of subtracted images, we noticed that the water front was
460
heterogeneous (Fig.9) and is linked to physical non-equilibrium as shown during solute
461
displacement experiment.
462
4 Conclusions and Perspectives
463
In this study, we developed an efficient method to couple images acquisition by computed
464
tomography technique and water infiltration experiment, in the aim to visualize water
distrib-465
ution in 4D at submicron scale. In order to overcome the common difficulty in CT technique,
466
uncorrected
proof
i.e. the low temporal resolution vs. to rapid physical phenomena of water transport, we chose
467
carefully the experimental combination among infiltration speed and relatively high temporal
468
and spatial resolution CT configuration.
469
By first performing macroscopic measurements in a column made of two medium of
con-470
trasted hydraulic conductivities (sand and porous clay spheres), we showed that the infiltration
471
of water into the clay spheres was negligible at the observed time scale. The calculation of
472
characteristics times show that water transfer into clay spheres is mainly diffusive at times
473
larger than our infiltration experiment duration.
474
In order to observe water flow at finer spatial scale, we succeeded to follow the water
475
front displacement by CT imaging, and by a novel image analysis method in soil science,
476
we could extract water distribution in two and three dimensions. The obtained 2D or 3D
477
water distribution showed us that little water filled into clay sphere during the observed
478
time range of infiltration. This is consistent with macroscopic gravimetrical measurements.
479
By averaging the water content over one periodic layer, we could obtain the water content
480
evolution along the column and determine the depth of the water infiltration front, as observed
481
in the subtracted binary images. By reconstructing 3D water distribution, we found that the
482
water front showed a heterogeneous shape which was related to the heterogeneity of the
483
double-porosity media leading to water transfer in physical non-equilibrium.
484
This work presents an adequate method to study water transport kinetics by CT
tech-485
nique. However, enhancement of experimental set-up is still needed. The spatial resolution of
486
6 × 10⁻³cm in this work is not high enough to study processes at the pore scale between
487
sand grains and inside clay spheres. The temporal resolution of 25 min compared to 8-h
488
infiltration allowed following the water front well, but still showed an uncertainty on the
489
water front position of 16 voxels or 0.096 cm. To further improve the temporal resolution, we
490
need higher intensity of the radiation (i.e. higher photon particle amount included in a wave
491
packet) while keeping low photon energy for high-transmission-coefficient contrast. This
492
may be realized by grand instrument such as synchrotron facility to image smaller samples
493
(a few millimetres thick). To improve the spatial resolution, a direct remedy is to use a better
494
CDD sensor with higher pixel resolution. Lowering carefully the wavelength of the radiation
495
can provide higher interaction between the radiation and material at small length scale and
496
thus better spatial resolution. However, a decrease in the wavelength leads to increase in the
497
photon energy. This has to be adjusted carefully in order to keep a minimal transmission
498
coefficient contrast.
499
Acknowledgments This project and post-doc scholarship for Z. Peng have been funded by a specific grant
500
awarded by Grenoble Institute of Technology. We thank J.F. Daian for the help in using XDQ software. This
501
project has also received partial funding from the European Union’s Horizon 2020 research and innovation
502
programme under Grant Agreement No. 645717.
503
References
504
Akhtar, M.S., Stüben, D., Norra, S., Memon, M.: Soil structure and flow rate-controlled molybdate, arsenate
505
and chromium(III) transport through field columns. Geoderma 161(3–4), 126–137 (2011)
506
Akin, S., Schembre, J.M., Bhat, S.K., Kovscek, A.R.: Spontaneous imbibition characteristics of diatomite. J.
507
Pet. Sci. Eng. 25(3–4), 149–165 (2000)
508
Angulo-Jaramillo, R., Vandervaere, J.P., Roulier, S., Thony, J.L., Gaudet, J.P., Vauclin, M.: Field measurement
509
of soil surface hydraulic properties by disc and ring infiltrometers—a review and recent developments.
510
Soil Till. Res. 55(1–2), 1–29 (2000)
511
Carminati, A., Kaestner, A., Ippisch, O., Koliji, A., Lehmann, P., Hassanein, R., Vontobel, P., Lehmann, E.,
512
Laloui, L., Vulliet, L., Flühler, H.: Water flow between soil aggregates. Transp. Porous Med. 68(2),
513
219–236 (2007)
514
uncorrected
proof
Carminati, A., Kaestner, A., Lehmann, P., Flühler, H.: Unsaturated water flow across soil aggregate contacts.515
Adv. Water Resour. 31(9), 1221–1232 (2008)
516
Dal Ferro, N., Delmas, P., Duwig, C., Simonetti, G., Morari, F.: Coupling X-ray microtomography and
mer-517
cury intrusion porosimetry to quantify aggregate structures of a cambisol under different fertilisation
518
treatments. Soil Till. Res. 119, 13–21 (2012)
519
Desaunay, A.: Etude et modélisation de la biosorption des métaux par les bactéries. Application au transfert du
520
cadmium et du zinc, seuls ou en mélange, par Escherichia coli et Cupriavidus metallidurans en colonnes
521
de sable d’Hostun. PhD of Joseph Fourier university (2011)
522
DiCarlo, D.A., Seale, L.D., Ham, K., Willson, C.S.: Tomographic measurements of pore filling at infiltration
523
fronts. Adv. Water Resour. 33(4), 485–492 (2010)
524
Elyeznasni, N., Sellami, F., Pot, V., Benoit, P., Vieublé-Gonod, L., Young, I., Peth, S.: Exploration of soil
525
micromorphology to identify coarse-sized OM assemblages in X-ray CT images of undisturbed cultivated
526
soil cores. Geoderma 179, 38–45 (2012)
527
Esser, H.G., Carminati, A., Vontobel, P., Lehmann, E.H., Oswald, S.E.: Neutron radiography and tomography
528
of water distribution in the root zone. J. Plant Nutr. Soil Sci. 173(5), 757–764 (2010)
529
Heindel, T.J., Gray, J.N., Jensen, T.C.: An X-ray system for visualizing fluid flows. Flow Meas. Instrum. 19(2),
530
67–78 (2008)
531
Herman, G.T.: Fundamentals of Computerized Tomography: Image Reconstruction from Projections, 2nd edn.
532
Springer Publishing Company Inc., New York (2009)
533
Holtham, D.A.L., Matthews, G.P., Scholefield, D.S.: Measurement and simulation of void structure and
534
hydraulic changes caused by root-induced soil structuring under white clover compared to ryegrass.
535
Geoderma 142(1–2), 142–151 (2007)
536
Hopmans, J.W., Vogel, T., Koblik, P.D.: X-ray tomography of soil–water distribution in one-step outflow
537
experiments. Soil Sci. Soc. Am. J. 56(2), 355–362 (1992)
538
Kneafsey, T.J., Seol, Y., Gupta, A., Tomutsa, L.: Permeability of laboratory-formed methane-hydrate-bearing
539
sand: measurements and observations using X-ray computed tomography. SPE J. 16(1), 78–94 (2011)
540
Lewandowska, J., Szymkiewicz, A., Burzynski, K., Vauclin, M.: Modeling of unsaturated water flow in
double-541
porosity soils by the homogenization approach. Adv. Water Resour. 27(3), 283–296 (2004)
542
Lewandowska, J., Szymkiewicz, A., Auriault, J.: Upscaling of Richards’ equation for soils containing highly
543
conductive inclusions. Adv. Water Resour. 28(11), 1159–1170 (2005)
544
Lewandowska, J., Szymkiewicz, A., Gorczewska, W., Vauclin, M.: Infiltration in a double-porosity medium:
545
experiments and comparison with a theoretical model. Water Resour. Res. 41(2), W02022 (2005bis)
546
Lewandowska, J., Tran Ngoc, T.D., Vauclin, M., Bertin, H.: Water drainage in double-porosity soils:
experi-547
ments and micro–macro modeling. J. Geotech. Geoenviron. 134(2), 231–243 (2008)
548
Lugato, E., Morari, F., Nardi, S., Berti, A., Giardini, L.: Relationship between aggregate pore size distribution
549
and organic–humic carbon in contrasting soils. Soil Till. Res. 103(1), 153–157 (2009)
550
Luo, L., Lin, H., Li, S.: Quantification of 3-D soil macropore networks in different soil types and land uses
551
using computed tomography. J. Hydrol. 393, 53–64 (2010)
552
Markowicz, A.A.: X-ray physics. In: Van Grieken, R.E., Markowicz, A.A. (eds.) Handbook of X-Ray
Spec-553
trometry, pp. 1–28. Marcel Dekker, New York (1993)
554
Maruyama, T., Tada, A., Iwama, K., Horino, H.: Direct observation of soil water movement through soil
555
macropores using soft X-rays and stereographing. Soil Sci. 168(2), 119–127 (2003)
556
Munkholm, L.J., Heck, R.J., Deen, B.: Soil pore characteristics assessed from X-ray micro-Cf derived images
557
and correlations to soil friability. Geoderma 181, 22–29 (2012)
558
Sammartino, S., Michel, E., Capowiez, Y.: A novel method to visualize and characterize preferential flow in
559
undisturbed soil cores by using multislice helical CT. Vadose Zone J. (2012). doi:10.2136/vzj2011.0100
560
Sato, T., Tanahashi, H., Loaiciga, H.A.: Solute dispersion in a variably saturated sand. Water Resour. Res.
561
39(6), 1155–1162 (2003)
562
Schjonning, P., Iversen, B.V., Munkholm, L.J., Labouriau, R., Jacobsen, O.H.: Pore characteristics and
563
hydraulic properties of a sandy loam supplied for a century with either animal manure or mineral
fertil-564
izers. Soil Use Manage. 21(3), 265–275 (2005)
565
Schaap, J.D., Lehmann, P., Kaestner, A., Vontobel, P., Hassanein, R., Frei, G., de Rooij, G.H., Lehmann,
566
E., Flühler, H.: Measuring the effect of structural connectivity on the water dynamics in heterogeneous
567
porous media using speedy neutron tomography. Adv. Water Resour. 31(9), 1233–1241 (2008)
568
Schneider, C.A., Rasband, W.S., Eliceiri, K.W.: NIH Image to ImageJ: 25 years of image analysis. Nat.
569
Methods 9(7), 671–675 (2012)
570
Serra, J.: Image Analysis and Mathematical Morphology. Academic Press, Inc., Orlando (1983)
571
Sleutel, S., Cnudde, V., Masschaele, B., Vlassenbroek, J., Dierick, M., Van Hoorebeke, L., Jacobs, P., De
572
Neve, S.: Comparison of different nano- and micro-focus X-ray computed tomography set-ups for the
573
visualization of the soil microstructure and soil organic matter. Comput. Geosci. 34(8), 931–938 (2008)
574
uncorrected
proof
Szymkiewicz, A., Lewandowska, J., Angulo-Jaramillo, R., Butlanska, J.: Two-scale modeling of unsaturated575
water flow in a double-porosity medium under axisymmetric conditions. Can. Geotech. J. 45(2), 238–251
576
(2008)
577
Szymkiewicz, A., Lewandowska, J.: Micromechanical approach to unsaturated water flow in structured
geo-578
materials by two-scale computations. Acta Geotech. 3(1), 37–47 (2008)
579
Toride, N., Leij, F.J., van Genuchten, M.Th.: The CXTFIT Code for Estimating Transport Parameters from
580
Laboratory or Field Tracer Experiments. Version 2.1. U.S. Salinity Laboratory, Riverside, California
581
(1999)
582
Toride, N., Inoue, M., Leij, F.J.: Hydrodynamic dispersion in an unsaturated dune sand. Soil Sci. Soc. Am. J.
583
67, 703–712 (2003)
584
Tran Ngoc, T.D.: Transport de solutés dans un milieu à double-porosité non saturé. Modélisation par
585
homogénéisation & applications. PhD of Joseph Fourier university (2008)
586
Vasin, M., Lehmann, P., Kaestner, A., Hassanein, R., Nowak, W., Helmig, R., Neuweiler, I.: Drainage in
587
heterogeneous sand columns with different geometric structures. Adv. Water Resour. 31(9), 1205–1220
588
(2008)
589
Vogel, H.J., Roth, K.: Moving through scales and flow and transport in soil. J. Hydrol. 272(1–4), 95–106
590
(2003)
591
Wildenschild, D., Hopmans, J.W., Rivers, M.L., Kent, A.J.R.: Quantitative analysis of flow processes in a sand
592
using synchrotron-based X-ray microtomography. Vadose Zone J. 4(1), 112–126 (2005)
593
Wildenschild, D., Sheppard, A.P.: X-ray imaging and analysis techniques for quantifying pore-scale structure
594
and processes in subsurface porous medium systems. Adv. Water Resour. 51, 217–246 (2013)
595
Withjack, E.M.: Computed tomography for rock-property determination and fluid-flow visualization. Soc. Pet.
596
Eng. Form. Eval. 3, 696–704 (1988)
597
Xu, K., Daian, J.F., Quenard, D.: Multiscale structures to describe porous media. Part II: transport properties
598
and application to test materials. Transp. Porous Med. 26(3), 319–338 (1997)
599
uncorrected
proof
Journal: 11242 Article: 572
Author Query Form
Please ensure you fill out your response to the queries raised below and return this form along with your corrections
Dear Author
During the process of typesetting your article, the following queries have arisen. Please check your typeset proof carefully against the queries listed below and mark the necessary changes either directly on the proof/online grid or in the ‘Author’s response’ area provided below
Query Details required Author’s response
1. Please check the term ‘X-Rays
Com-puted Tomography’ that has been
changed to ‘X-ray Computed Tomogra-phy’ in the article title.
2. Please provide significance for
super-script b in Table 2.
3. Reference Serra (1982) has been
changed to Serra (1983), so that this citation matches the list.
4. Please provide the year for the phrase
‘late 80’s’ in the sentence ‘This method is used currently in petroleum engineering since the late 80’s’.
5. Please check and confirm that unit “cm3
cm-3” repeated in text is correct.