by
JOHN CRAIG SEYMOUR B.S., Aeronautical Engineering United States Air Force Academy
(1977)
Submitted in Partial Fulfillment of the Requirements for the Degree of
Master of Science at the
Massachusetts Institute of Technology September 1988
© Massachusetts Institute of Technology 1988
Signature of Author
Certified
b y
-AcceDted bv
,/ vDepartment oyAeronautics and Astronautics August 12, 1988
Alan H. Epstein Associate Professor of Aeronautics and Astronautics Thesis SuDervisor
:-: . .... Professor Harold Y. Wachman
Chairman, Department Graduate Committee
MASGOBtTS INSiTUTE OF TECHNOLOGY SEP 07 1988
Aer
-_vby
JOHN CRAIG SEYMOUR
ABSTRACT
An engine cycle deck and a mission simulation program were mated to provide the capability to analyze the impact of localized design changes in a systems context. Specifically, the effects of compressor stall alleviation accomplished through the use of active stabilization were analyzed. Since no experimental data exists for compressor performance in the actively stabilized region of operation, actual compressor performance was bracketed by the examination of two types of compressors; one having steeply sloped speed lines in the actively stabilized region and the other having speed lines with shallow slope.
Engines with actively stabilized compressor sections were installed in an advanced tactical fighter and flown through a typical high-low-high attack profile. Mission performance results for the aircraft with controlled compressors were compared to baseline values of mission radius, takeoff gross weight, aircraft operating weight and aircraft total wetted area. Efficiency, engine radius at the fan and bare engine weight were found to be the primary determinants of mission performance.
Locating the design point of an actively stabilized high pressure compressor with steep speed lines in the actively stabilized operating region resulted in significant mission performance benefits (an 11.2 percent increase in mission radius or an 8.3 percent reduction in takeoff gross weight.) The same active stabilization implementation technique applied to a high pressure compressor with shallow speed lines acted to degrade mission performance.
Actively stabilized fan/low pressure compressors with shallow speed lines coupled with variable area exhaust nozzles increased aircraft specific excess power over more than fifty percent of the mission profile. At flight conditions of Mach = 0.9 and altitude = 36089 feet, specific excess power increased by 7.3 percent.
In the engine examined, mission performance was not significantly increased by exchanging the performance benefits of active compressor stabilization for reductions in high pressure compressor size and weight. Decreasing the physical engine size of an advanced supercruiser by using the expanded operating area of an actively stabilized fan/low pressure compressor to reduce design point weight flow was unsuccessful for the example attempted. Active compressor stabilization implementation alternatives which yield increases in aircraft capability as opposed to aircraft performance were studied qualitatively. Possible capability improvements resulting from active compressor stabilization include enlargement of the afterburner ignition envelope, increased engine life and reductions in inlet complexity or size. Procedures for the quantitative analysis of improvements in aircraft capability were offered as topics for further study.
This is the singularly enjoyable portion of thesis composition where I get to thank all of those people who helped to make this research possible, more enjoyable or more worthwhile. On this, the eve of the thesis due date, I would like to thank everyone who played a part, no matter how small, in providing me with the desire and, more importantly, the opportunity to complete my graduate degree. Due to a lack of space, time and memory, however, I am forced to limit my written thanks to those who come to mind first. If I forget to mention a name, believe me, its due to lack of sleep not lack of gratitude.
First, I sincerely thank my thesis advisor, Professor Alan Epstein, for his assistance in the selection of a research topic that was extremely well suited to my background as well as my future plans. I found the work both educational and interesting and I hope to carry on the research in my "spare" time at USAFA. I also offer my thanks to Professor Edward M. Greitzer for allowing me to hang my hat in MIT's Gas Turbine Lab for the last eighteen months and to the Office of Naval Research and the Charles Stark Draper Labs for their support of this research.
There are some other folks in the lab who merit recognition for their assistance. First, thank you Judy for your advice, opinions, occasional instruction and most of all for your companionship. Dr. Jerry Guenette should be rewarded for his attempts to struggle through the first draft of this document; I sincerely appreciated your suggestions for improvement, Jerry. Thanks go to Mr. Bob Haimes for teaching me the true value of frequent computer disc backups. Get a job Bob. Finally, to my comrades in arms at the GTL -- Best of Luck! Three very nice people, under no obligation, repeatedly offered their assistance during my efforts to decipher and modify two very large computer codes. Thank you Larry Fishbach of the Lewis Research Center, Jeff Stricker of the Air Force Aero Propulsion Laboratory and Craig Hosking of the Boeing Military Airplane Company.
I wish to thank all of the Draper folks who provided me with logistical support and a place to call home when I first arrived. Thank you Dr. Burke, Vilma and Shirley.
A host of new friends made the stay here more tolerable. To the McCaslands, the McDonalds, the Herriges, the Stephensons, the Gates, the Boerigters, the Griffins, and the Randolphs -- Thank you for your friendship and support. You'll never know how deeply it was appreciated.
A most heartfelt thanks to two of my instructors is appropriate here. I credit Mr. William Sprinkle, my high school physics teacher, for my early interest in the physics of engineering and I owe my present interest in axial engines to Col. (USAF Retired) John Fabian's instruction in aircraft propulsion. Thank you both!
My parents, John and Donna Seymour, deserve my fondest gratitude for their perpetual support and love. I am quickly finding out that parenting isn't always as easy as they have always made it look.
Finally, my wife Sherri is worthy of sainthood for putting up with me for the last year plus. She has managed to smile through most of this effort and has given me the greatest graduation gift a guy could ask for -- our new baby daughter, Stephanie Elaina Seymour.
training missions during peacetime operations. Eddie, Craig, Jesse, George, Lonnie, John and Joe -- You paid the price of realistic training for your fellow pilots and we have not forgotten.
Page # Abstract 2 Acknowledgements 3 Table of Contents 5 List of Tables 8 List of Figures 10
List of Abbreviations, Acronyms and Symbols 15
CHAPTER 1 INTRODUCTION 17
CHAPTER 2 SIMULATION METHOD AND MODELS 25
2.1 Simulation Method 25
2.2 Variable Cycle Engine Deck Description 27
2.3 The Uninstalled Engine Deck 30
2.4 Mission Simulation Program Description 31
2.5 Parameter Sensitivity Analyses 35
2.5.1 Cycle Deck Sensitivity Analysis 36
2.5.2 Mission Simulation Program Sensitivity Analysis 37
2.6 Chapter Summary 40
CHAPTER 3 BASELINE DEVELOPMENT 42
3.1 The Reference Engine 42
3.2 Reference Engine Data Match 43
3.3 The Baseline Aircraft and Missions 45
3.4 Chapter Summary 46
CHAPTER 4 SIMULATING ACTIVELY STABILIZED COMPRESSORS 48
4.1 Rotating Stall and Surge 48
4.2 Typical Compressor Performance Maps 50
4.3 Surge Margin 51
4.4 Performance Maps of Actively Stabilized Compressors 53
4.5 Chapter Summary 55
CHAPTER 5 POTENTIAL BENEFITS OF ACTIVE STABILIZATION
IN STEEP SPEED LINE COMPRESSORS 57
5.1 Active Control of Baseline Engine High Pressure Compressor 57 5.2 Active Stabilization Considerations in the Engine Matching Process 59 5.2.1 Motivation for Parametric Study of Design Point Variable Values 59
5.2.2 Parametric Study Technique and Results 60
5.3 Using Active Compressor Stabilization to Reduce Engine Weight/Size 64 5.3.1 Motivation for Size/Weight Reduction Study 64 5.3.2 Size/Weight Reduction Study Technique and Results 65
5.4 Chapter Summary 70
CHAPTER 6 POTENTIAL BENEFITS OF ACTIVE STABILIZATION
IN SHALLOW SPEED LINE COMPRESSORS 73
6.1 Using Active Stabilization to Optimize the Design Point Location 74 6.1.1 Motivation for Design Point Location Study 75 6.1.2 Technique and Results of Design Point Location Study 75 6.2 Add-On Active Stabilization for Performance Enhancement 78 6.2.1 Employment Method for Add-On Active Stabilization 78 6.2.2 Shifting HPC Operating Points with Variable Area Nozzles 79 6.2.3 Analyzing the Effects of Shifting Fan/LPC Operating Points 80 6.3 Using Active Compressor Stabilization to Reduce Engine Weight/Size 84 6.3.1 Reducing the Engine Size of a Supercruiser 85 6.3.2 Size Reduction Study Technique and Results 85
CHAPTER 7 AIRCRAFT CAPABILITY ENHANCEMENT WITH
ACTIVE COMPRESSOR STABILIZATION -- TOPICS FOR FURTHER STUDY
7.1 Exchanging Surge Margin for Aircraft Capability Enhancement 7.1.1 Using an Increase in Surge Margin to Relax Limitations on
on Afterburner Ignition
7.1.2 Benefits of Increases in Allowable Levels of Blade-to-Blade Variation
7.2 Exchanging Surge Margin for Increases in Allowable Inlet Distortion 7.2.1 Sources of Inlet Distortion
7.2.2 Quantifying the Inlet Modification Allowed by Active Compressor Stabilization
7.3 Chapter Summary
CHAPTER 8 SUMMARY OF SIGNIFICANT FINDINGS
References Tables Figures
APPENDIX A EXAMPLES OF CODE OUTPUT A. 1 Cycle Deck Output
A.2 Mission Simulation Program Output APPENDIX B
APPENDIX C
MILITARY SPECIFICATION INLET PRESSURE RECOVERY DEVELOPMENT OF A HIGH PRESSURE COMPRESSOR WITH SHALLOW SPEED LINES
SURGE LINE SHIFTS VIA PERFORMANCE MAP R LINES
90 91 91 92 92 93 94 96 97 101 105 120 174 174 175 197 199 APPENDIX D 210
Page # Chapter
Table 2.1 Data Contained in an Uninstalled Engine Deck 105
Table 2.2 First Page of an Uninstalled Engine Deck 106
Table 2.3 Variable Radius Mission Summary 107
Table 2.4 Baseline Engine - Design Point Data, Weight, and Dimensions 108 Table 2.5 Cycle Deck Parameter Sensitivity Analysis Results 109 Table 2.6 Mission Simulation Parameter Sensitivity Analysis Results 110
Chapter 3
Table 3.1 Design Point Parameter Values for the Reference Engine and
the Baseline Engine Candidates 111
Table 3.2 Tactical Fighter Airframe Design Data (from Boeing [3.2]) 112
Chapter 5
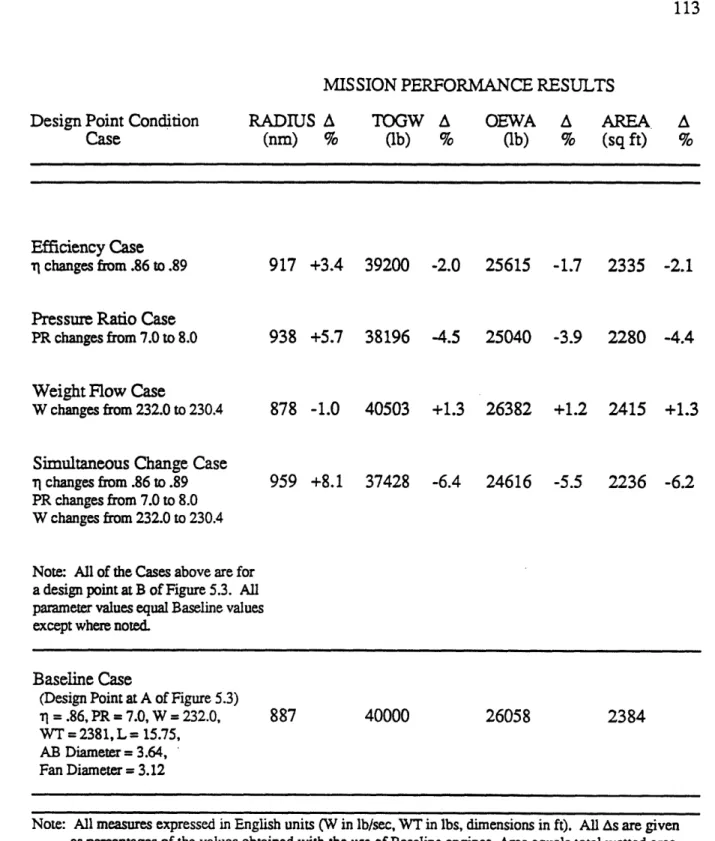
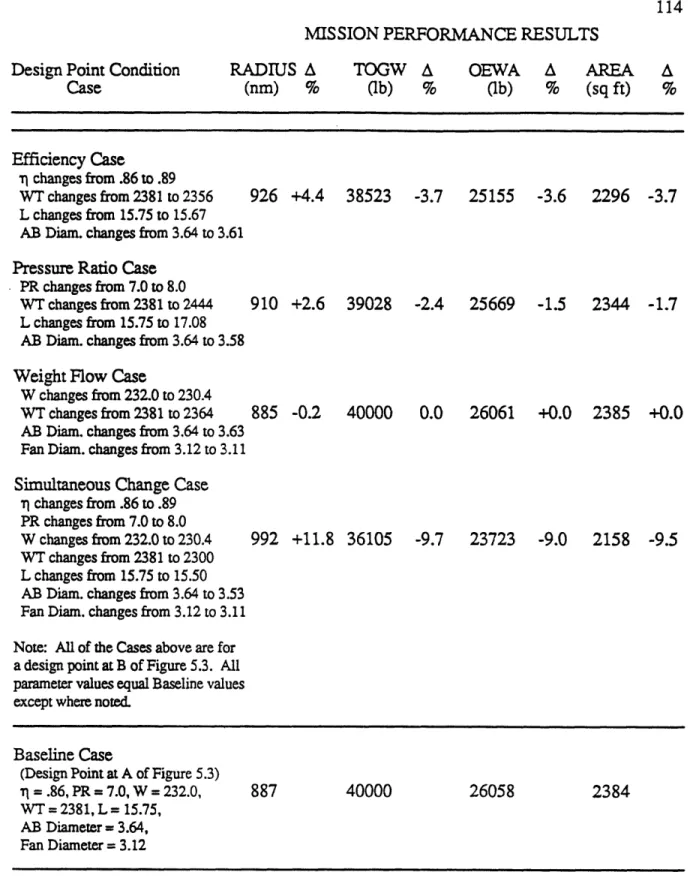
Table 5.1 Mission Performance Comparison for Two HPC Design Point Locations 113 Table 5.2 Mission Performance Comparison for Two HPC Design Point Locations 114
(Incorporates Corresponding Changes in Engine Weight)
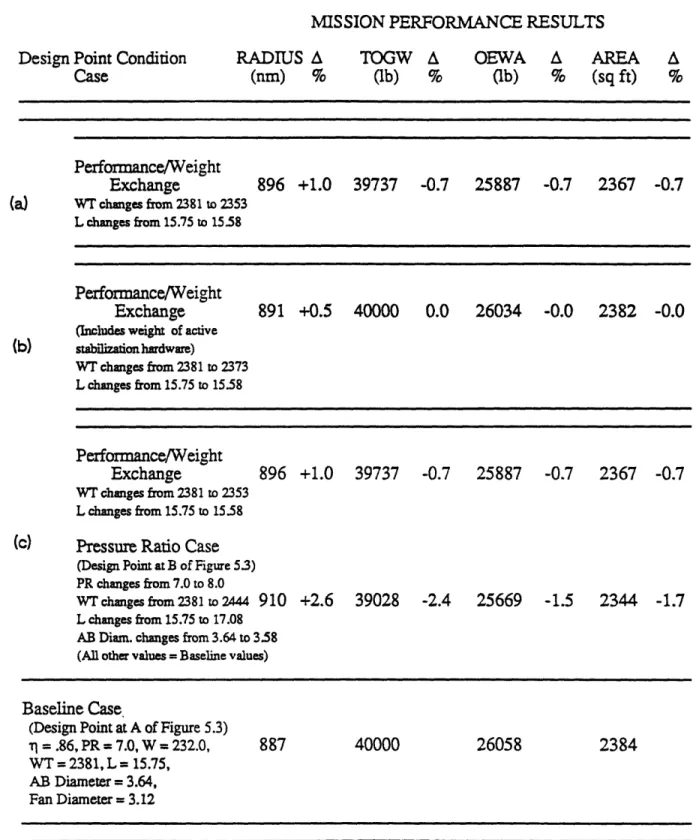
Table 5.3 Mission Performance Comparison for Two HPC Design Point Locations 115 (Incorporates Corresponding Changes in Engine Weight
Including Active Stabilization Hardware)
Table 5.4 Required Compressor Design Value Inputs to the Weight Analysis Code 116 (from Boeing [5.4])
Table 5.5 Component and Engine Size/Weight Summaries 117
Table 5.6 Results of Exchanging HPC Surge Margin Increases for
Reductions in Weight 118
Chapter 6
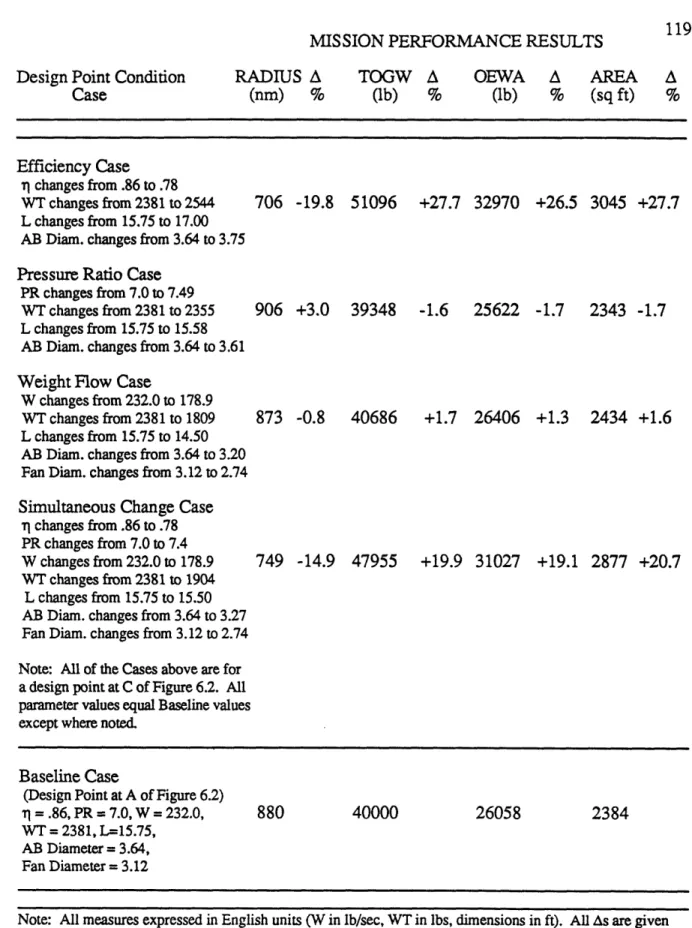
Table 6.1 Mission Performance Comparison for Two HPC Design Point Locations
Chapter 8
Table 8.1 Summary of Active Stabilization Implementation Studies
Appendix A
Table A.1 NNEP Output Table A.2 PWSIM Output
Appendix D
Table D.1 Sample HPC Performance Map in Digitized Format Table D.2 Extended HPC Performance Map in Digitized Format
119 97 176 192 212 213
Chapter 1
Figure 1.1 Possible Uses of Active Control in an Advanced Turbofan Engine (from Epstein [1.1])
Figure 1.2 Effects of Active Stabilization on Compressor Performance (from Epstein et al.[ 1.2])
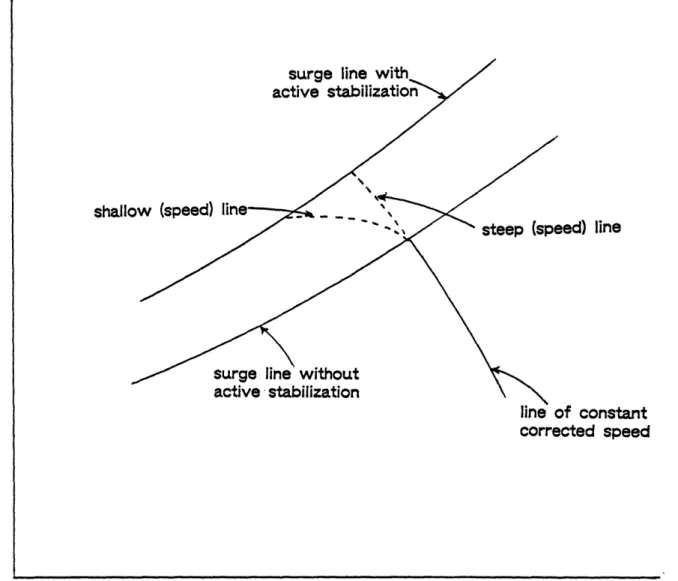
Figure 1.3 Steep and Shallow Speed Lines in an Actively Stabilized Compressor
Chapter 2 Figure 2.1 Figure 2.2 Figure 2.3 Figure 2.4 Figure 2.5 Figure 2.6 Figure 2.7 Figure 2.8 Figure 2.9 Figure 2.10 Chapter 3 Figure 3.1
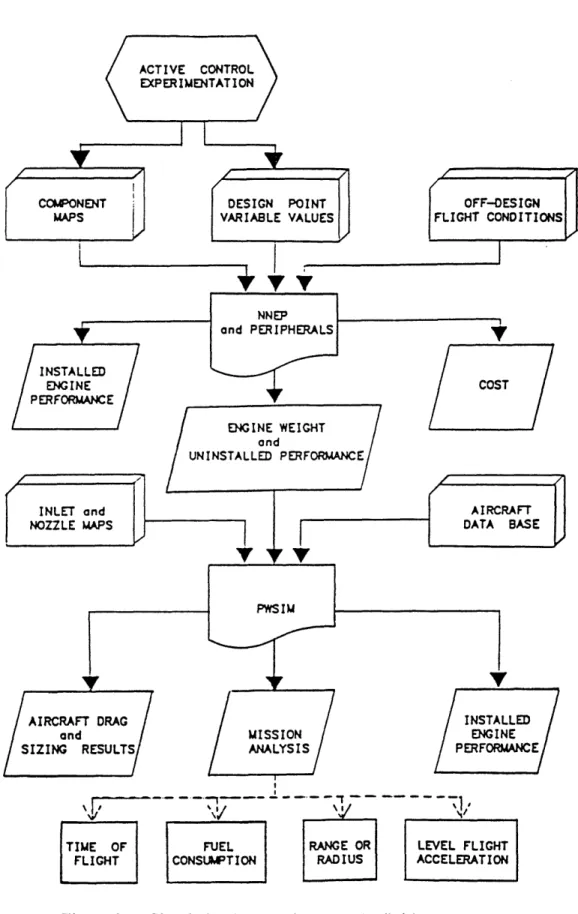
Simulation Flowpath - From Definition of Design Parameter Boundaries to Mission Data
Sample Low Pressure Compressor/Fan Map Sample High Pressure Compressor Map Sample High Pressure Turbine Map Sample Low Pressure Turbine Map
Flowpath for Construction of an Uninstalled Engine Deck Mission Simulation Program Flowpath (from Boeing [2.8]) Graphic Presentation of Tactical Fighter Airframe
Variable Radius Mission Profile for a Tactical Fighter (from Boeing [2.9])
Fixed Range Mission Profile for a Tactical Fighter
Altitude/Mach Number Array of Available Reference Engine Data (from Boeing [3.1]) 10 120 121 122 123 124 125 126 127 128 129 130 131 132 133
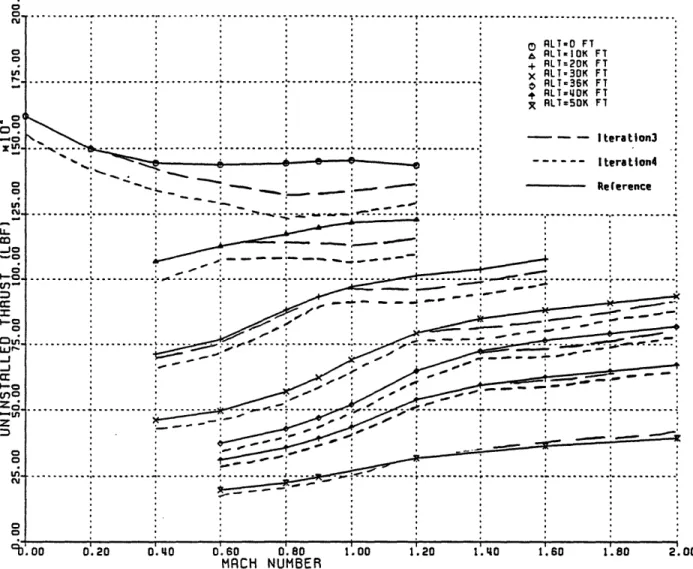
Figure 3.2 Reference Engine Performance at 36089 Feet Figure 3.3 Airflow Versus Mach Number
for Iteration3, Iteration4 and Reference Engines Figure 3.4 Military Power Thrust Versus Mach Number
for Iteration3, Iteration4 and Reference Engines Figure 3.5 Military Power TSFC Versus Mach Number
for Iteration3, Iteration4 and Reference Engines Figure 3.6 Maximum Power Thrust Versus Mach Number
for Iteration3, Iteration4 and Reference Engines Figure 3.7 Maximum Power TSFC Versus Mach Number
for Iteration3, Iteration4 and Reference Engines Figure 3.8 Airflow Versus Mach Number
for Baseline, Iteration4 and Reference Engines Figure 3.9 Military Power Thrust Versus Mach Number
for Baseline, Iteration4 and Reference Engines Figure 3.10 Military Power TSFC Versus Mach Number
for Baseline, Iteration4 and Reference Engines Figure 3.11 Maximum Power Thrust Versus Mach Number
for Baseline, Iteration4 and Reference Engines Figure 3.12 Maximum Power TSFC Versus Mach Number
for Baseline, Iteration4 and Reference Engines Figure 3.13 Baseline Performance at 36089 Feet
Figure 3.14 Variable Radius (Sample) Mission, As Flown by the Baseline Aircraft Figure 3.15 Fixed Range (Fixpro) Mission, As Flown by the Baseline Aircraft
Chapter 4 Figure 4.1
Figure 4.2 Figure 4.3 Figure 4.4
Performance Map of a Typical High Pressure Ratio,
Multistage Compressor (from Kerrebrock [4.3]) 148
Surge Margin Definitions 149
Typical Allocation of Required Surge Margin 150
Steep Line HPC Map - Lines of Constant Corrected Speed Bend Slightly 151 134 135 136 137 138 139 140 141 142 143 144 145 146 147
Figure 4.5 Shallow Line HPC Map - Lines of Constant
Corrected Speed Bend Sharply 152
Chapter 5
Figure 5.1 Baseline HPC Performance Map (HPC Without Active Stabilization) 153 Figure 5.2 Baseline HPC Map with Extended Surge Margin 154 Figure 5.3 HPC Performance Map for Study of Design Point Variable Values 155
Figure 5.4 Variable Radius (Sample) Mission Summary for an Aircraft Equipped
with Engines Containing Actively Stabilized HPCs 156 Figure 5.5 Fixed Range (Fixpro) Mission Summary for an Aircraft Equipped with
Engines Containing Actively Stabilized HPCs 157
Figure 5.6 Size Comparison of Baseline Aircraft to Aircraft Equipped with
Actively Stabilized HPCs 158
Figure 5.7 Determination of Pressure Ratio/Blade Tip Speed Relationship
(Figure 5.7(a) from Boeing [5.4]) 159
Chapter 6
Figure 6.1 Expanded Baseline HPC Performance Map 160
(20.0 percentage point extension of surge margin)
Figure 6.2 Extended Range High Pressure Compressor Performance Map 161 (61.9 percentage point extension of surge margin)
Figure 6.3 Baseline Fan/LPC Performance Map 162
Figure 6.4 Extended Baseline Fan/LPC Performance Map 163
(20.0 percentage point extension of surge margin) Figure 6.5 Extended Baseline Fan/LPC Performance Map with
Variable Area Nozzle Effects (M=1.4, ALT=36089) 164 Figure 6.6 Extended Baseline Fan/LPC Performance Map with Multiple
Operating Region Boundaries (M=0.9, ALT=36089) 165 Figure 6.7 Extended Baseline Fan/LPC Performance Map with Lines of Constant
TT4 and Lines of Constant Nozzle Area (M=0.9, ALT=36089) 166 Figure 6.8 Extended Baseline Fan/LPC Performance Map with Lines of Constant
Figure 6.9 Figure 6.10 Figure 6.11 Figure 6.12 Chapter 7 Figure 7.1 Figure 7.2
Baseline Engine Operating Envelope with Region Benefiting from Active Stabilization Implementation
Baseline Engine Military Rated Specific Excess Power (PSUBS) Increases with Active Stabilization Implementation
Extended Baseline Fan/LPC Performance Map with Lines of Constant TT4 (M=1.4, ALT=36089)
Extended Baseline Fan/LPC Performance Map with Lines of Constant 'TT4 and Lines of Constant Uninstalled (M=1.4, ALT=36089)
168
169
170
171
Surge Margin Erosion Resulting From Increased Inlet Distortion 172 Measured Surge Margin -- Transient versus Steady Operating Conditions 173
Appendix B
Figure B. 1 Military Specification Pressure Recovery (from Mattingly [B.3])
Appendix C
Figure C.1 Detroit Diesel Allison High-Flow Compressor (from Allison [C.1]) Figure C.2 Allison High-Flow Compressor with Extended Surge Margin Figure C.3 Baseline (Shallow Line HPC) with Extended Surge Margin Figure C.4 Airflow Versus Mach Number for Baseline Engines
Figure C.5 Military Power Thrust Versus Mach Number for Baseline Engines Figure C.6 Military Power TSFC Versus Mach Number for Baseline Engines Figure C.7 Maximum Power Thrust Versus Mach Number for Baseline Engines Figure C.8 Maximum Power TSFC Versus Mach Number for Baseline Engines Figure C.9 Baseline (Shallow Line HPC) Performance at 36089 Feet
198 201 202 203 204 205 206 207 208 209
Appendix D Figure D. 1 Figure D.2 Figure D.3
Sample HPC Performance Map with R Lines Sample Map with Extended Surge Margin
Extended HPC Performance Map with Associated R Lines
214 215 216
Abbreviations and Acronyms AB ABTEMP ACCU LEN ADECS ALT ALTF ALTI BPR C.A.F. CD CFG CL D FANEFF FANPR FN FNAV HIRPM HPC HPCEFF HPCPR HPT LID LOWRPM LPC LPT M MF MI MO N NNEP NSTAGE OEWA OPR PR PREF PRS PS Afterburner
Total temperature at afterburner entrance Accumulative length (in)
Adaptive Engine Control System Altitude (ft)
Final altitude Initial altitude Bypass ratio
Corrected airflow, W 40 / 8, (lb/sec) Drag coefficient
Nozzle gross thrust coefficient Lift coefficient
Distance (nm)
Fan or low pressure compressor adiabatic efficiency Fan or low pressure compressor total pressure ratio Net thrust (lb)
Net thrust available (lb)
Rotational speed of high pressure spool (rpm) High pressure compressor
High pressure compressor adiabatic efficiency High pressure compressor total pressure ratio High pressure turbine
Lift to drag ratio
Rotational speed of low pressure spool (rpm) Low pressure compressor
Low pressure turbine Mach number
Final Mach number Initial Mach number Freestream Mach number Speed
Navy/NASA Engine Program (understood to include WATE-2 after Chapter 2)
Number of stages
Aircraft operating weight (empty weight plus fixed useful load - does not include payload or usable fuel)
Overall pressure ratio Total pressure ratio Reference pressure
Pressure ratio at surge (stall)
Power setting (2.0 = maximum power, 1.0 = military power) 15
Specific excess power (ft/sec) Freestream total pressure
Total pressure at compressor entrance
Propulsion/Weapon System Interaction Model
Radius or compressor performance map reference line Inner radius
Outer radius
Thrust specific fuel consumption (l/sec) Sea level, static conditions
Surge margin Surge margin Time
Total temperature at high pressure turbine entrance Takeoff gross weight
Reference temperature
Thrust specific fuel consumption (1/sec) Freestream total temperature
Total temperature at compressor entrance
Total temperature at high pressure turbine entrance Total afterburner combustion temperature
Velocity (knots true airspeed) Weight flow (lb/sec)
Weight Analysis of Turbine Engines (version 2) Fuel flow (lb/hr)
Weight flow at surge (lb/sec) Weight (lb)
Final weight (lb) Initial weight (lb)
Bypass ratio
Small change or total pressure / reference pressure Change
Adiabatic efficiency
Military specification pressure recovery factor Total pressure at exit / total pressure at entrance Total pressure ratio of diffuser
Maximum total pressure ratio of diffuser Total temperature / reference temperature PSUBS PTO PT2 PWSIM R RI RO SFC SLS SM SURMAR T TIT TOGW TREF TSFC TT2
T2
TT4 TT7 VKTAS W WATE-2 WFDOT WS WT WTF WTI Symbolsa
A /i Cd 'dmaThe gas turbine engines of modem fighter aircraft make up one sub-system of a highly integrated weapons system designed to perform a particular mission or type of mission. Because mission objectives vary dramatically, optimizing the performance of a weapons system with respect to a single mission implies the development of highly mission-specific engines. Engine designers, down to the component level, must be constantly aware of the impact their design choices will have on mission performance. Designers will not incorporate advances in technology without some indication that mission performance will be improved. Research and development teams must provide designers with concepts that are more than simply academically stimulating. Designers must be convinced that employment of a new concept will have desirable effects not only at the local or sub-system level but at the global or system level as well. Procurement of custom made turbomachinery for testing purposes is an extremely expensive and time consuming process so advances in technology with applications to gas turbine engines are often first analyzed through the use of computer simulations. In this way, those ideas which possess the greatest potential benefits in mission performance advance to the more expensive stages of development.
The main objectives of this thesis are to generate a systems context in which active compressor stabilization can be assessed and to provide guidelines for future fluid mechanics research by identifying the advantages and/or disadvantages to aircraft overall mission performance resulting from different implementations of active control in gas turbine engines. More specifically, this thesis analyzes the overall performance of tactical fighter aircraft
equipped with afterburning turbofan engines having one or more "smart" compressor sections - - compressors which have the ability to suppress engine stall or surge through the active control of local flow conditions.
Recent developments in microelectronics have instigated a shift in engine design philosophy away from the simple open-loop engine sub-systems of years past toward more complex and highly integrated, closed-loop components. Epstein [1.1], describes various ways in which feedback control might be used in the aircraft turbine engine of the year 2000. Figure 1.1 shows a turbofan whose components employ sensors, processors and actuators to balance and dampen shafts, reduce noise and alleviate compressor stall. Compressor stall alleviation might be accomplished by feeding back local flow measurements to a high-speed controller which commands actuators that adjust stator blade turning angle. Other techniques for the alleviation of compressor stall might include pressure bleeding valves or actuators which recamber fan or rotor blades.
The active control schemes proposed by Epstein et al. in [1.2] are aimed at increasing the aerodynamic damping of compressor instabilities to allow compressor operation in what was previously an unstable and "forbidden" high-performance region. At point A of Figure 1.2 the compressor operates normally and without active flowfield control. With the implementation of active control the compressor may operate safely at point B. Point B is located in a region which, without active flowfield control, lies beyond the limit of stable operation (the surge line) but in a region of improved performance, as indicated by the increase in pressure rise from A to B. This thesis quantifies the mission performance benefits resulting from shifts in the operating points of actively stabilized compressors like the shift from A to B in Figure 1.2.
This thesis describes a premier effort in the quantification of technological advances. Never before (to the author's knowledge) has such an in-depth study been conducted to quantify the potential mission performance benefits of an advance in component technology which is still in the proof-of-concept stage of development. This, however, is the ideal time to conduct such a study. The notion of active compressor stabilization is new enough to allow the results of the type of analysis presented in this thesis to guide further research.
Quantification of mission performance benefits produced by actively stabilized compressors required the selection of three baseline elements; a mission, an airframe and an engine. Logically, a tactical, strategic or logistical need would define a mission which in turn would define the airframe/engine combination best suited to perform that mission. In the actuality of this study, however, the selection of a flexible mission simulation program allowed the user to define the mission. The mission simulation program user also selected the airframe type from one of a number of generic airframe data bases available as program input. Engine selection was transmitted to the mission simulation program through the output from a variable cycle engine deck. The cycle deck output reflected any changes made to the engine, like those resulting from actively stabilized compressor sections. Since, in this study, the baseline mission could be selected rather than defined by a specific need, selection of the baseline airframe preceded mission definition.
An advanced tactical fighter was selected as the baseline airframe for three reasons. First, the engines of today's advanced tactical fighters present a challenging engineering problem created by a requirement for the aircraft to cruise efficiently at both subsonic and supersonic speeds. Second, because of a large required surge margin (a buffer zone between the operating point and the stability limit), military fighters stand to gain more than other
types of aircraft from the expanded compressor operating regions created by the implementation of active compressor stabilization. Finally, the design and development of an advanced tactical fighter and its associated sub-systems present current and realistic problems of great engineering interest.
Selection of an advanced tactical fighter as the baseline airframe was followed by the selection of a standard high-low-high, combat profile as the baseline mission. The fighter takes off, climbs to cruising altitude, flies to the target, descends and drops munitions, climbs back to cruising altitude, returns to the starting point then descends and lands. The baseline engine, a mixed flow afterburning turbofan, is typical of modern fighters. The baseline compressors have characteristics typical of those commonly associated with the engines of fighter aircraft.
Baseline aircraft mission performance was evaluated by first generating a table reflecting the engine's uninstalled performance at selected flight conditions. A cycle deck, the Navy NASA Engine Program (NNEP)[1.3][1.4], was used to calculate on and off-design engine performance. A supplemental program to the cycle deck, Weight Analysis of Turbine Engines (WATE-2) [1.5], was used to estimate component/engine dimensions and weight. The output from these calculations became the input to an aircraft mission simulation program (the Propulsion Weapon System Interaction Model (PWSIM), [1.6] [1.7].) The mission simulation calculation couples engine input to the baseline aircraft and "flies" the baseline mission. The final output contains values for range, fuel used, time of flight, optimum cruising altitudes, level flight performance, etc.
A major problem in this work was the determination of compressor performance (slope of the speed lines and the shape of the efficiency contours) in the compressor's actively
stabilized region. Ideally measured data would be used but since this was not available two limiting cases were examined. Figure 1.3 shows a compressor speed line which assumes two different shapes in the actively stabilized region of operation. In one case, the line of constant corrected speed has a steep slope. In the other case the slope of the line of constant corrected speed may be described as shallow. These cases "bracket" the relatively unknown effects of actively controlling the stability boundary (surge line) of a modem multistage compressor. Both types of actively stabilized compressors were input to the cycle deck (at separate stages of the research) via their respective digitized and tabulated performance maps. Once the compressor was altered to reflect active stabilization implementation, the previously outlined mission simulation sequence was repeated yielding mission performance results for an aircraft with engines containing actively stabilized compressors. These results were then evaluated with respect to the mission performance results of the baseline aircraft to determine the relative value of the compressor change brought about by the use of active stabilization.
The work of this thesis examines four ways in which the expanded compressor operating area created by active stabilization might be used. These implementation alternatives are not necessarily mutually exclusive and the designers' task is to determine which alternative, or combination of alternatives, optimizes aircraft performance with respect to the specific mission or type of mission the aircraft is asked to perform. Of course, the designer bases his design choices on other than mission performance requirements, such as manufacturing restrictions and cost, but these considerations lie outside the scope of this research.
The first actively stabilized compressor implementation alternative involves the idea of active control employment at the earliest stages of the engine design or redesign process. With active stabilization, the designer has the freedom to move the design point of an engine's compressor sections into regions of the performance map that were formerly off limits due to constraints created by surge margin requirements. Component design point parameters may then be optimized with respect to mission performance without previous surge margin constraints. This alternative may be especially attractive to designers who are forced to locate a compressor's design point below the mission-optimized values of pressure ratio and efficiency simply to comply with aircraft surge margin requirements.
The second actively stabilized compressor implementation alternative, like the first, involves active stabilization ideas in the earliest stages of the design process. In this case, active stabilization is implemented in order to reduce the size and weight of the stabilized compressor. This type of implementation may prove especially beneficial for fan/low pressure compressor applications. A decrease in fan radius could translate into reduced overall engine radius with significant benefits in mission performance and side-benefits such as a reduced radar cross section.
The third active stabilization implementation alternative imitates the method utilized in the Adaptive Engine Control System (ADECS) study [1.8] [1.9]. This particular implementation alternative would apply add-on active stabilization hardware to the compressor section of an existing engine. The ADECS study made use of the fact that some portions of a flight profile demand less surge margin than others. During these low risk portions of the flight profile the fan section operating point of an F-15 engine was shifted up into regions of higher pressure ratio in an exchange of surge margin (stability) for
performance. This resulted in significant benefits in time to climb and time to accelerate. The ADECS method allows an operating point shift only during low risk portions of the flight profile. Active compressor stabilization would allow the required surge margin to be maintained during all segments of the flight profile while still allowing the upward operating point shifts. This implies that the mission performance benefits of active stabilization
implementation could be even more significant than those obtained in the ADECS study.
The fourth implementation alternative uses the surge margin increases created by active compressor stabilization to make vehicular design changes which result in increased levels of required surge margin. Using the surge margin in this way would allow benefits like simplification of inlet designs, greater tolerances in manufacturing specifications, relaxation of augmenter sequencing constraints or expansion of an aircraft's maneuvering envelope. The benefits of this implementation alternative generally act to increase aircraft capability rather than to increase aircraft performance. Because of this, the potential benefits of active compressor stabilization extend well beyond the confines of engine performance. This implementation alternative may require the engine designer to interact with weapons designers, flight controls designers or airframe designers to determine active control implementation objectives.
The first and second active stabilization implementation alternatives were examined with respect to steep (speed) line compressors in Chapter 5. Steep line compressors are those with speed lines that bend only slightly toward the pressure axis of the compressor performance map in the increased operating area created by compressor stabilization (see Figure 1.3) and thus yield relatively large increases in pressure ratio. Shallow (speed) line compressors have speed lines which bend sharply toward the pressure axis of the
performance map in the operating area created by active stabilization employment (again, see Figure 1.3) thus increasing the mass flow range. Chapter 6 examines the first, second and third implementation alternatives on shallow line compressors while Chapter 7 discusses the fourth active stabilization implementation alternative on compressors of both types in a more qualitative fashion and includes suggested topics for further study.
Chapter 2 describes the simulation method in detail and presents a parameter sensitivity analysis for both the cycle deck and mission simulation programs. This chapter will be of interest to those readers interested in the technique used to "mate" the cycle deck and mission simulation calculations.
Chapter 3 provides detailed information on the baseline engine, aircraft and missions and is a "must read" chapter for those attempting to duplicate the performance studies presented in this thesis.
Chapter 4 provides background information on compressor performance maps, rotating stall, surge and surge margin for those readers who may be unfamiliar with compressor performance analysis. In addition, Chapter 4 details and illustrates performance map
assumptions made in this study.
Finally, Chapter 8 presents the significant findings of the author's efforts to quantify the mission performance benefits of actively stabilizing the compressor sections of the engines in an advanced tactical fighter. The author assumes this chapter will be of interest to all readers.
2.1 Simulation Method
A model which evaluates the impact of actively controlled engine components on aircraft mission performance must have; (1) the capability to incorporate technological advances in component design in any conceivable type of engine, and (2) the ability to fly the experimental engine in any type of suitable aircraft through any practical mission profile. The simulation method used in this work was developed mainly from two separate codes. A variable cycle engine deck, the Navy/NASA Engine Program (NNEP) and a mission simulation program, the Propulsion/Weapon System Interaction Model (PWSIM), were both selected primarily due to their flexibility and availability. The cycle deck and a peripheral weight calculation program, Weight Analysis of Turbine Engines (WATE-2), handle the integration of the actively controlled components with the engine while the mission simulation program installs the engine with active control in a selected airframe and "flies" a desired mission profile.
It was necessary to modify both the cycle deck and the mission simulation codes to run on a Digital Microvax computer. Modifications to the cycle deck's Fortran code involved mainly the adaptation of the Namelist input techniques to comply with Digital's more restrictive usage of the Namelist feature. The mission simulation program modifications however, were more complicated and required the removal of the overlay structure designed for use with the CDC Cyber 175 computer. Great care was taken throughout the
modification processes of both codes to minimize the number of changes, thus preserving the accuracy and repeatability of the original codes. The designers of both codes provided sample input and results against which the Microvax produced results were compared with virtually one-hundred percent accuracy.
Interfacing the cycle deck and the mission simulation calculations was accomplished by adding Fortran code to the cycle deck which allowed the construction of an uninstalled engine deck in an industry standard "Markl2" format described in section 2.3. The uninstalled engine deck becomes one of the inputs to the mission simulation program which calculates the engine installation effects and mission performance. It should be noted that the uninstalled engine deck is constructed without eliminating or changing any of the cycle deck's original output.
The reader should be aware that the cycle deck used in this study, NNEP, calculates only steady state conditions at a given operating point. Transients in engine flow characteristics created by accelerations, decelerations, nozzle fluctuations or afterburner sequencing are not accounted for in the cycle deck calculations. Thus, the uninstalled engine deck is simply a compilation of steady state operating conditions at a user determined variety of flight conditions.
The cycle deck combined with a peripheral weight analysis program, Weight Analysis of Turbine Engines (WATE-2), can produce output which includes engine total weights and dimensions as well as engine uninstalled performance at any flight condition. When the output from the cycle deck takes the form of an uninstalled engine deck and becomes input to the mission simulation calculation, the combined codes provide aircraft total weight and
dimensions, installed thrust (required and available), and a detailed analysis of the aircraft mission broken down into segments. Figure 2.1 illustrates the simulation flowpath from cycle deck inputs through mission analysis. Sections 2.2 and 2.3 contain more detailed information about code output.
2.2 Variable Cycle Engine Deck Description
First operational in 1974, the cycle deck of this study, NNEP, was developed through the joint efforts of the NASA Lewis Research Center and the Naval Air Development Center. Driven by the need to study unique engine concepts for the Supersonic Cruise Airplane Research Program, Nasa Lewis designers hoped to develop a code capable of: simulating any conceivable turbine engine, simulating variable component performance, simulating various variable cycle engine concepts, and optimizing variable-geometry settings to minimize specific fuel consumption or maximize thrust. Fashioned after the Navy Engine Performance Program (NEPCOMP), NNEP met the code designers' objectives. The genesis of NNEP is described in greater detail in [2.1].
As can be seen from the design goals, NNEP was designed to be an extremely flexible and powerful code. Three peripheral codes, developed as adjuncts to NNEP, give the cycle deck even more capability. These codes are: WATE-2 (Weight Analysis of Turbine Engines) [2.2], COST (estimates the production cost and selling price of military aircraft gas turbine engines) [2.3], and INSTAL (estimates the installed performance of aircraft gas turbine engines) [2.4]. The length of WATE-2, COST, and INSTAL programs, in lines of Fortran code, is approximately 6K, 1.5K, and 34K respectively. The parent NNEP Fortran
code is approximately 5K lines in length. All three of the cycle deck's peripheral programs were adapted for use on the Digital Microvax. However, only the weight analysis code was used in the work of this thesis. Cost analysis was considered outside the thesis scope and the INSTAL code was not used since the mission simulation program calculates installation effects internally. For the sake of brevity, any future reference to the cycle deck shall be understood to refer to the NNEP/WATE-2 combination.
In 1979 a method was developed to determine the weight of each major component in the engine to within plus or minus ten percent accuracy. The resulting weight analysis code, WATE-2, is based on a mechanical preliminary design which is responsive to major engine design variables such as stress level, maximum temperature, material, geometry, stage loading, hub-tip ratio, and shaft mechanical overspeed. Using the thermodynamic calculations of NNEP and a separate set of inputs representing the design features of the components, WATE-2 calculates the weight of each individual component. More detailed information about the WATE-2 code is contained in [2.2].
As mentioned above, the weight estimations of WATE-2 are dependent on the thermodynamic properties which appear as output from the cycle deck's analysis of each operating point. Cycle deck calculations are based on the performance of each engine component. Component performance is input to the cycle deck via digitized component "maps." For a compressor, the component map generally plots pressure ratio versus corrected airflow along lines of constant corrected speed. In addition, a compressor map depicts islands of constant adiabatic efficiency and the surge line which defines the upper limit of pressure ratio for a given constant corrected speed. The cycle deck allows any or all of the digitized component map inputs to have a third dimension. That is, component maps
can be "stacked" to account for variable geometry such as variable inlet guide vane position. Figures 2.2 through 2.5 display, in order, component maps for a fan/low pressure compressor, a high pressure compressor, a high pressure turbine, and a low pressure turbine. The efficiency contours on the maps are not absolute values but are relative to a user specified reference value. Figures 2.2 through 2.5 were input for the sample cases which were run to verify the correctness of the Microvax version of the cycle deck. These sample maps exhibit characteristics consistent with maps which might be used to describe a generic afterburning turbofan for use in an advanced, fighter type airframe. For this reason, the sample maps were used, in original or modified form, for much of the work of this thesis. Use of other than the sample maps will be indicated where applicable.
The cycle deck's flexibility is a result of; (1) the use of digitized component maps to define component performance and, (2) the building block approach to the inputs required to define engine flowpaths. Interactive preprocessing programs KONFIG [2.5], REKONFIG [2.5], and PREPWATE [2.6] assist the user in "building" an engine, component by component, and assigning the design point value to each variable of component performance. The cycle deck user's manual [2.7], gives the proper input format for each component variable and explains the use of controls, techniques for variable "marching", and processes which optimize or limit variable values. Any or all of these options may be used to run various types of design point or off-design studies. Appendix A contains unmodified sample output from the cycle deck and weight analysis calculations.
2.3 The Uninstalled Engine Deck
The built-in flexibility of the cycle deck made development of the cycle deck/mission simulation program interface possible without requiring massive changes to either code. The uninstalled engine deck (in an industry standard Markl2 format), is a parametric description of the engine as calculated by the cycle deck (NNEP) and is created by running the cycle deck once for each throttle setting at each flight condition; approximately five hundred independent runs for each engine developed during this research. Each run of the cycle deck produces two lines of the uninstalled engine deck. The first line contains information required by the mission simulation program. The second line is a sequence of optional inputs selected by the user and are not used in the mission simulation calculations. Five external programs manipulate one set of cycle deck design point inputs and off-design flight conditions to create an uninstalled engine deck. These programs compile the uninstalled engine deck by running the cycle deck at the design point then moving to the first off-design condition defined by some altitude and flight Mach number combination. The cycle deck is run at this off-design condition then the engine is throttled down using variable marching techniques on the afterburner and turbine inlet temperatures. The cycle deck is run once for each temperature change then the flight condition is changed and the engine is throttled back again. At a given flight Mach number altitude is incremented from the minimum value to the maximum value then the Mach number is increased and the sequence is reinitiated. Figure 2.6 illustrates the uninstalled engine deck development process.
Repeated thermodynamic calculations within the cycle deck produce the body of the uninstalled engine deck but the information listed in the uninstalled engine deck header consists mainly of output from the weight analysis calculations. Table 2.1 contains a listing
of information contained in the uninstalled engine deck and Table 2.2 is the initial portion of an uninstalled engine deck in Mark12 format. Graphical examples of the information contained in a Markl2 uninstalled engine deck appear in Figures 3.2 - 3.13.
2.4 Mission Simulation Program Description
The mission simulation program, the Propulsion/Weapon System Interaction Model (PWSIM) [2.8], was developed by the Boeing Military Airplane Company in 1985 to provide an in-house propulsion assessment capability to the Air Force's Aero Propulsion Laboratory. PWSIM consists of approximately twenty thousand lines of Fortran 77 code and requires another sixty-five hundred lines of input for execution. Originally designed to operate on the CDC Cyber 175 computer under the NOS 2 operating system, it is an interactive program for assessing the effects of different engine cycles, engine installations, mission requirements, and airplane geometry on airplane size and weight.
Figure 2.7 shows the flowpath for an airplane mission performance calculation. Note that engine installation effects are taken into account in the mission simulation program. This is an option and the "perform engine installation" switch may be turned off when an installed engine deck (Markl 1 format) is used instead of an uninstalled engine deck (Mark12 format.) The code lets the user interactively select the inlet, aftbody, and nozzle gross thrust coefficient maps to be used in the installed performance calculations and as a result of this feature the types of inlets and nozzles available are restricted only by the user's access to reasonable data. The input format for these maps is described in Appendix A of [2.8].
Due to the mission simulation program's modular-type construction, mating engines with aircraft types is simply a matter of exchanging uninstalled engine decks and/or aircraft data bases. Tactical fighter, supersonic interceptor, supersonic cruise missile and long range transport data bases are presently available [2.9]. Each data base contains all of the configuration related modules required to define and scale the geometry of a baseline configuration and evaluate its drag polars and operating weight.
The engine installation module of the mission simulation program utilizes a set of inlet and nozzle performance maps and an uninstalled engine deck to calculate installed engine performance. Aircraft weight and drag calculations involve the scaling of installed engine thrust and airframe size according to user specified values of thrust/weight ratio, wing loading and takeoff gross weight. The mission simulation program then combines the calculated drag values and installed engine performance with simplified equations of motion for each segment of the mission profile. The task of evaluating overall mission performance is then a simple compilation of the aircraft performance over the entire sequence of mission
segments.
The mission simulation program calculates time, fuel, and distance required to complete each segment of a user defined mission. Missions are divided into two general categories; variable range or radius missions and fixed range or radius missions. In a variable range or radius mission the aircraft begins the mission at a specified weight and the program calculates the extent of the mission as either radius (if the aircraft departs point A and returns to point A) or range (if the aircraft departs point A and flies to point B.) In a fixed range or radius mission takeoff gross weight, aircraft operating weight and total wetted area are the unknown variables. A mission length is fixed and a baseline design is "sized" to arrive at the smallest
aircraft design possible which will complete the assigned mission. The message in the box in the lower right corner of Figure 2.7 indicates the two processes (corresponding to the two categories of missions) for matching the airplane to mission requirements.
As mentioned previously, data bases are available for four types of propulsion/weapon system combinations. The work of this thesis uses the tactical fighter data base (Model 985-420 [2.9]) coupled with twin turbofan engines. The unscaled tactical fighter has a takeoff gross weight (TOGW) of forty thousand pounds, is approximately sixty feet in length, and has a wingspan of nearly fifty feet. All-moving slab canards with augmentation from wing flaperons control pitch and roll throughout the flight envelope. Twin vertical fins, each with a conventional rudder, control yaw. The aircraft is designed to carry a one-man crew and twelve thousand pounds of JP-4 fuel. Figure 2.8 is a graphic representation of the aircraft produced as part of the mission simulation program's output. More detailed information about the airframe is available in Table 3.2.
Each of the four sample airframe data bases has a corresponding set of sample engine data. The baseline engine of this thesis has characteristics similar to those of the mission simulation program's sample afterburning turbofan engine, assumed to have been developed specifically for use in aircraft like that of the tactical fighter data base. Detailed information about the sample engine (hereafter referred to as the reference engine) is available in engine decks of Mark12 and Markl 1 format in [2.8]. Additionally, limited information about the reference engine is available in Table 3.1.
Just as each aircraft data base has a corresponding sample engine, there exists a sample mission for each aircraft/engine combination. Figure 2.9, depicts the tactical fighter sample
mission profile. Note that the mission is of the variable radius type. That is, a fighter with a takeoff gross weight of forty thousand pounds takes off from point A, flies to point B, delivers ordnance, and returns to point A. All usable fuel is consumed, so the distance between points A and B, the mission's radius, is determined by the efficiency of the airframe/engine combination. The sample radius mission was used in the mission simulation program sensitivity analysis and for some of the analysis discussed in Chapter 5.
Figure 2.10 illustrates the fixed range counterpart to the variable radius mission of Figure 2.9. In this mission an aircraft of undetermined size and weight is sized to arrive at the smallest aircraft possible which can successfully complete the assigned mission of fixed length. This fixed range mission was used in the mission simulation program sensitivity analysis and for some of the analysis discussed in Chapter 5. The length of the mission was set by the capabilities of the baseline aircraft. That is, a forty thousand pound tactical fighter with baseline engines is just large enough to complete this mission with the required fuel reserves.
The mission simulation program output is divided into two separate data files. One file contains installed engine performance data while the other file contains general aircraft output data. An airplane design summary and a mission profile summary similar to that of Table 2.3 (see list of symbols and abbreviations for column heading key) can be found among the general aircraft output data. Appendix A contains a sample of the general aircraft output data file in its entirety. An example of an installed engine performance data file can be found in [2.8].
2.5 Parameter Sensitivity Analyses
In order to verify that the cycle deck and the mission simulation program were responding correctly to changes in input in their Microvax modified forms, and to better understand the global response to small, localized, input deltas, a parameter sensitivity analysis was performed on the cycle deck and the cycle deck/mission simulation program combination. These analyses compare the percentage change in important output quantities to the percentage change of each selected independent input quantity by varying the input parameters only slightly and one at a time. For example, if interest lies in the sensitivity of mission radius (R) to a turbofan's high pressure compressor efficiency () alone, then the ratio
(R2- R1)/R 1
R/R
(T12 -ln)/I,- 6811 /1would be formed from two successive runs of the cycle deck/mission simulation program combination that differ only in the high pressure compressor efficiency input to the cycle deck.
Qualitatively, those ratios that have a value much less than one indicate that the input variable has little influence on the output variable. Conversely, a ratio near one indicates that the input variable can significantly effect the output variable and may point out a desirable direction of change.
2.5.1 Cycle Deck Sensitivity Analysis
The cycle deck sensitivity study evaluated changes in input to a mixed flow afterburning turbofan engine, the baseline engine, having the component performance design values depicted in Table 2.4. Table 2.5 relates the sensitivity of thrust per unit airflow, specific fuel consumption (SFC), and engine dimensions to changes in design point variable values. These data were obtained by increasing the input variables by five percent, except where noted. The table shows, as expected, that the most advantageous change in thrust per unit airflow is obtained by changing the turbine inlet temperature (TT4). However, increasing TT4 also significantly increases engine length, weight, and fuel consumption. The calculations also show that, increasing the high pressure compressor efficiency has an
advantageous effect on thrust per unit airflow, SFC, and engine dimensions and weight. Increasing the high pressure compressor pressure ratio has the desired effect on all output variables except military power thrust, where the effect is rather insignificant. Clearly, if the objective were to decrease SFC, increasing compressor pressure ratio or T4 (if thrust could be spared) would be the places to initiate change. If, however, the goal was to increase military power thrust per unit airflow, design changes that increased compressor efficiency would make the most sense.
The sensitivity of engine performance to design airflow, altitude, and Mach number was included for completeness. Increasing the design airflow increases thrust but keeps thrust per unit airflow and SFC constant. Obviously, the engine increases in both size and weight with an increase in design airflow. Increasing altitude and decreasing Mach number would appear to have positive effects on thrust and fuel consumption but the table shows negative effects on engine weight and dimensions for those changes. In addition, the
seemingly positive effects of increasing the design altitude and decreasing the design Mach number would be lost when the engine returned to operation at the original design point.
Summarizing observations from Table 2.5, one concludes that to maximize engine performance, TT4 and afterburner inlet temperature (TIT7) should be lowered to the minimum end of their optimum operating ranges while compressor pressure ratio and efficiency should be increased to the maximum end of their operating ranges. Small changes in bypass ratio do not matter and changing design point flight conditions will be detrimental unless a redefined aircraft mission dictates such a change. Reference [2.10] includes the results of a parameter sensitivity analysis for a similar engine performed using a less complex engine simulation code. Results and conclusions of that analysis compare favorably with the results of Table 2.5 and the conclusions above.
2.5.2 Mission Simulation Program Sensitivity Analysis
The parameter sensitivity analysis for the mission simulation program compares mission results from the tactical fighter airframe/baseline engine combination to mission results from the same tactical fighter airframe using baseline engines that have been altered by changing a single design point variable by five percent or less. The analysis procedure required the construction of separate engine descriptions (uninstalled engine decks) one for the baseline engine and one for each engine produced by a change in one of the independent design point variables. The independent variables of the cycle deck sensitivity analysis, together with engine weight and dimensions, form the set of independent variables for the mission simulation program sensitivity analysis.
Mission results, used as the criteria for comparison, are; (1) mission radius from the variable radius sample mission of Figure 2.9, (2) takeoff gross weight (TOGW), (3) aircraft operating weight (OEWA), and (4) total wetted area. The last three criteria are all calculated from the fixed range mission depicted in Figure 2.10. In order to produce the first entry in Table 2.6, the mission simulation program is run using the variable radius mission profile and an uninstalled engine deck reflecting a five percent change in the design value of high pressure compressor pressure ratio only. The variable mission radius increases over that calculated for the fighter equipped with baseline engines, yielding a sensitivity ratio value of +.614. That is,
(R2 -R)/R1 R/R 614
(
2
PR
-
P/PR
PR
/ PR
The mission simulation program was then run a second time using the fixed range mission and the same uninstalled engine deck. This time the aircraft was sized to produce the smallest airframe/engine combination capable of completing the fixed range profile. The first data line of Table 2.6 shows that a five percent increase in the compressor design point pressure ratio of the baseline engine allows a forty thousand pound aircraft to increase its radius by five percent when flying the variable radius mission profile. The same aircraft/engine combination (of undetermined weight and size) flying the fixed range mission can be approximately two percent lighter and two percent smaller than the tactical fighter airframe/baseline engine combination.
As in the cycle deck sensitivity analysis, high pressure compressor efficiency has a very positive impact on the dependent variables of the mission simulation program sensitivity analysis. In fact, a high pressure compressor efficiency increase has a greater relative effect
on mission performance variables than it does on any single measure of engine performance because of the cumulative effects on mission performance of positive changes in engine weight, dimensions, thrust, and specific fuel consumption. A two percent increase in high pressure compressor efficiency can increase mission radius by more than two and one-half percent. The same increase produces a one-to-one percentage reduction in TOGW, OEWA, and total wetted area.
Increasing the turbine inlet temperature has a negative impact on mission radius and aircraft weight and size which agrees with the fact that increasing TT4 significantly increases engine weight and length (results of the cycle deck sensitivity analysis.) Increasing the afterburner inlet temperature, however, has a surprisingly positive impact on the study's dependent variables. This may be partially explained by the fact that, from the cycle deck sensitivity analysis, a five percent increase in TT7 has no effect on engine weight or dimensions but increases maximum power thrust. SFC is increased to a greater extent than thrust however, and since only a small portion of either mission is performed with the afterburner on, the effects of a five percent increase in TT7, as depicted in Table 2.6, seem unusually large.
Changes in design point flight conditions, altitude and Mach number, have little or negative effect as do increases in the design airflow. Since the engine is scaled to fit within the airframe, creating a larger engine with proportionally greater thrust by increasing the design airflow has no bearing on mission results. An increase in bypass ratio creates negligible effects as well.
Table 2.6 shows that, with respect to the dependent variables of this study, the engine radius at the fan is the most critical physical property of the propulsion system with engine weight possessing nearly the same degree of criticality. Changes in engine length and engine radius at the afterburner have much less bearing on the dependent variables.
Summarizing observations from Table 2.6, one concludes that, with respect to the missions evaluated, HPC design efficiency and HPC design pressure ratio should both be increased to the maximum end of their operating regions while TT4 should be decreased to a minimum. Obviously, decreasing engine dimensions, especially engine radius at the fan, and decreasing engine weight without affecting engine performance will enhance mission performance. Changing engine bypass ratio, design point flight conditions, or design airflow has little effect on mission results. The effects of an increase in TT7 should be investigated further to determine the reality of the benefits reflected in Table 2.6.
2.6 Chapter Summary
A sophisticated variable cycle engine deck (NNEP) and its appended weight analysis program (WATE-2), along with the mission simulation program (PWSIM) have been modified to run on a Digital Microvax computer. Repeated runs of the cycle deck/weight analysis code, one run for each engine operating point, provide the user with a description of the uninstalled engine in an industry standard "Mark12" format. This uninstalled engine deck is the interface between the cycle deck and the mission simulation program and is the vehicle by which changes in engine component performance are transmitted to the airframe/engine combination of interest. Along with the uninstalled engine deck, a user defined mission
profile and a user selected aircraft data base become inputs to the mission simulation program. Output from the mission simulation program contains overall mission analysis in the form of duration of flight, fuel consumed, and distance traveled as well as individual mission segment analysis containing SFC, thrust available, fuel consumed, and time of segment. Thus, a process has been developed by which the impact of actively stabilized axial compressors on aircraft mission performance may be analyzed.
Parameter sensitivity analyses performed on both the cycle deck and the mission simulation program as a partial verification of proper program operation show the global effects of small changes in the design values of selected independent variables when varied independently and one at a time. Of the independent variables evaluated, only an increase in high pressure compressor efficiency provided "across the board" benefits in both evaluations. Adjustments in high pressure compressor pressure ratio and turbine inlet temperature reveal themselves to be potentially beneficial to both engine and mission performance as well.
As mentioned in Chapter 2, an assumption made early in this research was that the reference engine was developed specifically for use in the tactical fighter airframe and that the engine/airframe combination would perform missions commensurate with the role of an advanced tactical fighter with an unaugmented supersonic cruise capability. Ideally then, active control schemes could be applied to the reference engine and the effects on the tactical fighter's mission performance could be examined. However, due to the lack of necessary reference engine information, such as component performance maps and component geometry, applying active control schemes to the reference engine through the use of the cycle deck could not de done correctly. Instead a baseline engine was developed (using educated guesses and iteration) which nearly reproduces the net performance (uninstalled engine deck) of the reference engine.
3.1 The Reference Engine
The reference engine is a two-spool, mixed flow, afterburning turbofan engine. It has an augmented design thrust of 26,900 pounds, a combustor exit temperature of 3460 degrees Rankine, and an overall pressure ratio of 25. The reference engine was based on Boeing studies of the tactical fighter concept [3.1]. Reference engine cycle and basic geometry characteristics are contained in Table 3.1. The Mach numbers and altitudes at which reference engine data was provided are depicted in Figure 3.1 and the entire uninstalled
engine deck is included in [3.1]. Figure 3.2 summarizes the reference engine performance at 36089 feet. The "Thrust Required" line of Figure 3.2 was generated using the reference engine/tactical fighter airframe combination and the mission simulation program (PWSIM).
3.2 Reference Engine Data Match
Thus, effort was focused on generating an engine which resembled, as closely as possible, the characteristics of the reference engine and had the ability to incorporate actively stabilized compressors. All of the engines of Table 3.1, excepting the reference engine, were generated with the cycle deck (NNEP) and the sample component maps of Figures 2.2-2.5. The data match process consisted of inserting best estimates of reference engine variable values to the cycle deck input list and then "tuning" the remaining variables until the cycle deck output matched the reference engine uninstalled engine data.
The NNEP Sample Engine of Table 3.1 (a test case for code verification) was circumstantially similar to the reference engine, but was not a close enough match to consider for use. Iterationl, was developed by changing the NNEP Sample Engine inputs to reflect reference engine design airflow and pressure ratio. TT4 and TT7 were then increased to match the reference engine design thrust. The design point parameter values of Iteration2 and Iteration3 were identical to those of Iteration 1. Differences in Iteration versions one through three occurred only at off-design flight conditions and were due to changes in the uninstalled engine deck construction process. Taking a different approach, Iteration4 was developed by changing the NNEP Sample inputs to reflect reference engine design values of T4 and TT7 and then using component pressure ratio and efficiencies as the variable parameters.
![Figure 1.1 Possible Uses of Active Control in an Advanced Turbofan Engine (from Epstein [1.1])](https://thumb-eu.123doks.com/thumbv2/123doknet/13914134.449187/120.918.111.823.415.785/figure-possible-active-control-advanced-turbofan-engine-epstein.webp)
![Figure 3.1 Altitude/Mach Number Array of Available Reference Engine Data (from Boeing [3.1])](https://thumb-eu.123doks.com/thumbv2/123doknet/13914134.449187/133.918.207.758.225.804/figure-altitude-number-array-available-reference-engine-boeing.webp)