HAL Id: hal-01865223
https://hal.archives-ouvertes.fr/hal-01865223
Submitted on 15 Mar 2019HAL is a multi-disciplinary open access archive for the deposit and dissemination of sci-entific research documents, whether they are pub-lished or not. The documents may come from teaching and research institutions in France or abroad, or from public or private research centers.
L’archive ouverte pluridisciplinaire HAL, est destinée au dépôt et à la diffusion de documents scientifiques de niveau recherche, publiés ou non, émanant des établissements d’enseignement et de recherche français ou étrangers, des laboratoires publics ou privés.
Bioassay-guided isolation and
UHPLC-DAD-ESI-MS/MS quantification of potential
anti-inflammatory phenolic compounds from flowers of
Inula montana L.
Elnur Garayev, Carole Di Giorgio, Gaëtan Herbette, Fathi Mabrouki, Philippe
Chiffolleau, David Roux, Huguette Sallanon, Evelyne Ollivier, Riad Elias,
Béatrice Baghdikian
To cite this version:
Elnur Garayev, Carole Di Giorgio, Gaëtan Herbette, Fathi Mabrouki, Philippe Chiffolleau, et al.. Bioassay-guided isolation and UHPLC-DAD-ESI-MS/MS quantification of potential anti-inflammatory phenolic compounds from flowers of Inula montana L.. Journal of Ethnopharmacology, Elsevier, 2018, 226, pp.176-184. �10.1016/j.jep.2018.08.005�. �hal-01865223�
Bioassay-guided isolation and UHPLC-DAD-ESI-MS/MS quantification of potential anti-inflammatory phenolic compounds from flowers of Inula montana L.
Elnur Garayev a , Carole Di Giorgio b , Gaëtan Herbette c , Fathi Mabrouki a , Philippe Chiffolleau d , David Roux e , Huguette Sallanon e , Evelyne Ollivier a , Riad Elias a , Béatrice Baghdikian a * a
Aix Marseille Univ, Avignon Université, CNRS, IRD, IMBE, FAC PHARM, Marseille, France b
Aix Marseille Univ, Avignon Université, CNRS, IRD, IMBE, Laboratoire de Mutagenèse Environnementale, Marseille, France
c
Aix Marseille Univ, CNRS, Centrale Marseille, FSCM, Spectropole, Service 511, Campus Saint-Jérome, 13397 Marseille, France.
d
Parc Naturel Régional du Luberon, 60, place Jean Jaurès, 84400 Apt, France e
Avignon Université Qualisud, UMR 95, F-84000, Avignon, France *Corresponding author
Aix Marseille Univ, Avignon Université, CNRS, IRD, IMBE, Laboratoire de Pharmacognosie, Faculté de Pharmacie, Marseille, France, 27, bd. Jean Moulin, CS30064, Marseille Cedex 05, France
Tel.:+33-491-83-55-93, E-mail: beatrice.baghdikian@univ-amu.fr E-mail addresses: elnurgar@mail.ru (E. Garayev) carole.di-giorgio@univ-amu.fr (C. Di Giorgio) gaetan.herbette@univ-amu.fr (G. Herbette) fathi.mabrouki@univ-amu.fr (F. Mabrouki) philippe.chiffolleau@parcduluberon.fr (P. Chiffolleau) david.roux@univ-avignon.fr (D. Roux) huguette.sallanon@univ-avignon.fr (H. Sallanon) evelyne.ollivier@univ-amu.fr (E. Ollivier) riad.elias@univ-amu.fr (R. Elias)
ABSTRACT
Ethnopharmacological relevance: Flowers of Inula montana L. (Asteraceae), commonly known as
“Arnica de Provence”, are used in the traditional medicine of Provence in France with the same indication as Arnica montana, for the relief of bruises, as an anti-inflammatory agent.
Aims of the study: The aim of our study is to evaluate its anti-inflammatory properties and to justify
its traditional uses. Its potential valorization is evaluated in order to propose Inula montana as an alternative to Arnica montana.
Materials and methods: Bio-guided fractionation of ethanolic extract allowed the isolation of
compounds, responsible of the inhibition of NO production. The fractionation was realized using chromatographic techniques and structure elucidation was conducted by ESI-MS and NMR spectral data. Anti-inflammatory effect of ethanolic extract, different fractions and isolated pure compounds was studied in vitro on immortalized mouse macrophages RAW 264.7. An analytical UHPLC-DAD-ESI-MS/MS method was developed for the identification of these compounds in the herbal drug. This UHPLC-DAD method was validated and was used to compare the phenolic profile and content in plant material from the two collection sites: Bonnieux and Merindol.
Results: Eleven compounds were identified by UHPLC-MS. Chlorogenic acid (1), Luteolin (2),
Nepetin (3), 3,5-O-Dicaffeoylquinic acid (4), 1,5-O-Dicaffeoylquinic acid (5), Nepitrin (6), Hispiduloside (7) and Jaceosid (8) were isolated and identified by NMR. Compounds 9, 10 and 11 were confirmed to be 6-Hydroxykaempferol 3,7-dimethyl ether, Hispidulin and Chrysosplenol C, respectively by comparing retention times and MS/MS data with those of the authentic substances. Six compounds: 1 and 4-8 are reported for the first time in Inula montana L. Compounds 2-8 showed promising anti-inflammatory activity with the release of NO with IC50 value <7 µM. The
UHPLC-DAD method of quantification of three major bioactive compounds (1, 3 and 5) was validated.
Conclusion: Flowers extracts and isolated compounds present promising anti-inflammatory activity
the same indications as Arnica montana. The developed and validated simple, accurate and rapid UHPLC method can be used for the quality control of the herbal drug.
Keywords: 1,5-O-Dicaffeoylquinic acid, Chlorogenic acid, Anti-inflammatory activity,
UHPLC-DAD, Accuracy profile
1. Introduction
The genus Inula is mainly distributed in Africa, Asia and Europe, predominantly in the Mediterranean Area. Flavonoids and terpenes are the major compounds of this genus (Seca et al., 2014; Wu et al., 2015; Zhao et al., 2006).
Inula montana L. is a member of Asteraceae family. Flowers are used in traditional medicine in
France, Spain and Morocco. In France, I. montana is called “Arnica of Provence” and is used for the relief of bruises. The flowers are macerated with ethanol at 60-70% (v/v) called “eau de vie” or with olive oil. These preparations are used for cutaneous application with the same indication as
Arnica montana (Amir, 1998). In Spain, decoction, infusion and maceration in alcohol or olive oil
of flowers, leaves and fresh aerial parts are used locally for the relief of bruises, joint pains, rheumatism and orally for stomach ache (Obón et al., 2012). In Morocco, decoction or infusion of leaves are used to treat orally gastrointestinal, otolaryngological and respiratory diseases (Teixidor-Toneu et al., 2016).
Few studies report the phytochemical composition and pharmacological activity of I. montana. Previous phytochemical studies led to the isolation of flavonoid aglycones, sesquiterpene lactones and inositol derivatives (Garayev et al., 2017; Gonzalez Romero M.A. et al., 2001; Reynaud and Lussignol, 1999). Crude extracts and some purified constituents of I. montana demonstrated antioxidant, protozoocidal and anti-inflammatory activities (Garayev et al., 2017; Martín et al., 1998; Belyagoubi-Benhammou et al., 2014).
The aim of our study is to validate the traditional use of Inula montana by evaluating its potential anti-inflammatory properties and to evaluate the possible use of I. montana as an
alternative to Arnica montana, a plant species that is endangered and difficult to cultivate (Pasquier and Godin, 2014).
Both species are members of Asteraceae family. They contain similar chemical classes of compounds, essentially sesquiterpene lactones, phenolic acids, and flavonoids. Sesquiterpene lactones of I. montana are different from those of A. montana, however we can find two flavonoid aglycones described in both species, luteolin and hispidulin (Kriplani et al., 2017).
Inula montana is a perennial plant showing a rosette (10–40 cm circumference) of thin
lancet-shaped sessile leaves (highly variable number). All aerial organs are hairy, leaves and bracts also display numerous glandular trichomes. From May to June, this rhizomatous plant emits a few ≈20 cm floral stems (rarely branched), with a few smaller alternate leaves, holding at the top a solitary capitulum (5–8 cm diameter) of yellow florets (ray florets with long and thin ligules) displaying a discrete odor. Inula montana grows from 50 to 1300 m altitude and is frequent from eastern Italy to southern Portugal. This calcicolous and xerophilous plant is locally abundant in Southeast France in the calcareous low scrubland ecoregion named Garrigue (Girerd and Roux, 2011; Gonzalez Romero M.A. et al., 2001; Tela Botanica, 2018). The rare and protected Arnica
montana is also a rhizomatous herbaceous perennial herb but, in contrast to Inula montana, it grows
on acid (siliceous) and poor soils mainly in high altitude (600-2700 m) environment such as the alpine mountain. It displays larger oval leaves which are hairy on the upperside. From June to July, it emits a single ≈50 cm floral stem showing one (frequent) to tree opposite pairs of smaller leaves and a bright yellow to orange 7-8 cm capitulum with a pleasant perfume. Ligules of ray florets are far more developed in comparison to Inula montana (Rameau et al., 1989; Sugier et al., 2013).
This paper describes the isolation, structure elucidation, quantitative analysis and anti-inflammatory effects of the isolated compounds by measuring their capacity to inhibit nitric oxide production. The identification and the structure elucidation were carried out using NMR and UHPLC-DAD-ESI-MS/MS. This UHPLC-DAD method was validated for the quantification of the three major active compounds. To our knowledge, this is the first time that an analytical method for
the quality control of I. montana is reported. This validated UHPLC-DAD method was used to compare the phenolic profile and the content of the two collection sites: Bonnieux and Merindol, in order to observe potential modification of the phenolic composition and to select the plant with the highest content.
2. Materials and methods 2.1 Plant material
The plant material of Inula montana was collected in Merindol in 2015 and 2017 and Bonnieux in 2017 located in the Regional Natural Park of Luberon, in the south of France (Table 1). The voucher specimens were deposited in the Laboratory of Pharmacognosy of Aix Marseille University (Marseille, France). Flowers were air-dried and ground.
2.2 Instruments and reagents
1D and 2D NMR spectra were recorded on Bruker AVANCE III 600 spectrometer (1H 600.13MHz) (Bruker, USA) with tetramethylsilane (TMS) as an internal standard at 300K. The chemical shifts (δ) were expressed in ppm with TMS as an internal reference. UHPLC-DAD-ESI-MS/MS analysis were performed using an UHPLC Agilent Infinity 1290 Liquid chromatography system equipped with a binary pump solvent delivery system G4220A and UV photodiode array detector G4212A (Agilent Technologies, Inc., Germany), coupled with Bruker Esquire 2000 (Bruker, USA) which is equipped with an electrospray ionization source (ESI). Preparative HPLC was performed on Gilson PLC2020. Flash chromatography was performed using a CombiFlash Rf 200 (Teledyn Isco, USA). A grinder (Moulinex, France) was used for the homogenization of flowers. The optical density for the evaluation of anti-inflammatory activity was read by fluorescence-luminescence reader Infinite M200 Pro (Tecan, Switzerland).
Table 1 Flowers of Inula montana L. from different collection sites
Place of collect Collect date Altitude (m) Voucher specimen
Merindol 03/06/2015 170 IMFLF151
Bonnieux 31/05/2017 680 IMFLFB171
Extraction solvents, methanol and formic acid of LC-MS quality were purchased from Carlo Erba (Italy).
The standards of Chlorogenic acid, 1,5-O-Dicaffeoylquinic acid and Nepetin were purchased from PhytoLab GMBH (Germany).
Reagents for the anti-inflammatory evaluation were purchased from Sigma-Aldrich (USA).
2.3 Nitric oxide (NO) production assay
This assay is based on the ability of immortalized mouse macrophages RAW 264.7 to generate a strong inflammatory response leading to NO (Nitric Oxide) release, after the stimulation by antigens of E. coli. Mouse macrophages were seeded into 48-well tissue culture plates at the concentration of 1.105 cells/mL (200µL/well) for 24 hours at 37°C (5% CΟ2). At the end of the
incubation period, the culture medium was replaced by 200 µL of medium containing appropriate concentrations of evaluated compound and cells were incubated at 37°C (5% CO2) for one hour.
Experiments were performed in duplicate and dexamethasone was used as a positive control at the concentrations of 1, 5, 10, 50 and 100 µM. At the end of the incubation period, pro-inflammatory LPS from E.coli were added to the cell cultures (1 µg/mL). Then the cells were incubated at 37°C (5% CO2) for 18 hours. NO release was measured in the culture supernatant by the Griess reaction:
50 µL of the supernatants were transferred into the 96-well tissue culture plate, and 50 µL of the Griess modified reagent were added to each well. After a 15 min period at room temperature, Optical Density (OD) of each well was read at 540 nm. Results obtained for wells, treated with the evaluated compound, were compared to the untreated control wells (DMSO, 100% viability) and converted into the percentage values.
Inhibition of NO release was expressed as percentages comparing to the negative controls: Percentage of NO release =
The concentrations of the test material causing a 50% decrease of NO release (IC50) were calculated
through non-linear regression analysis using software Table curve Version 2.0. 100 x (OD of test well - OD of blank) OD of DMSO control - OD of blank
2.4 UHPLC-DAD-ESI-MS/MS analysis
Chromatographic separation was achieved on Agilent 1290 liquid chromatograph using Zorbax SB-Phenyl (100 × 2.1 mm, 1.8 µm, Agilent, Germany) column, operated at 43 °C. Water acidified with 0.1% of formic acid (v/v) as Solvent A and Methanol as Solvent B were used for the gradient elution at 0.5 mL/min. The gradient program was: 18% B (from 0 to 3.5 min), 18 to 30% B (from 3.5 min to 3.6 min), 30% B (from 3.6 min to 12.0 min), 30 to 40% B (from 12.0 min to 12.1 min), 40% B (from 12.1 min to 16.2 min), 40 to 42% B (from 16.2 min to 16.3 min), 42% B (from 16.3 min to 22.0 min), 42 to 80% B (from 22.0 min to 22.1 min), 80% B (from 22.1 min to 26.0 min) with post time of 5.0 min and injection volume of 0.3 µL. The UV detection wavelength was set at 335 nm. The following MS parameters were employed: on positive ionization mode spray voltage was set at 3.5 kV, sheath gas (N2) flow rate was set at 50 psi, auxiliary gas (N2) flow rate
was set at 12 l/min, capillary exit voltage was set at 102.4 V, tube lens voltage was set at -60 V and capillary temperature was set at 300°C. Fragmentation amplitude was set at 1.0 V.
2.5 Extraction and isolation
Powdered flowers (0.2 kg) were macerated with EtOH 95% (v/v) at ambient temperature for 18 h and then extracted by percolation with the same solvent three times (3 x 1.2L). The extracts were combined and evaporated to afford crude extract L2 (23.7 g). The extract was suspended in 500 mL of H2O and partitioned successively by 3 x 500 mL of petroleum ether, dichloromethane
and ethyl acetate, to afford, after evaporation in vacuo, petroleum ether L2P (4.4 g), dichloromethane L2D (0.7 g) and ethyl acetate L2E (3.1 g) dry extracts.
The NO assay led us to select the L2E (2.48 g) extract which was subjected to the reversed phase (C18, 130 g) flash chromatography and eluted with water acidified with 0.1% formic acid (v/v) as Solvent A and methanol acidified with 0.1% (v/v) formic acid as Solvent B (v/v). Elution was performed at a flow rate of 60 mL/min, with fraction collection volume of 18 mL and with the following gradient: 20 to 100% B (from 0 to 25 min), 100% B (from 25 min to 37 min) to afford two fractions (L2E1) and (L2E2) and three compounds 1 (68.4 mg), 2 (19.2 mg) and 3 (20.1 mg).
Fraction L2E1 (221 mg) was subjected to the reversed phase preparative HPLC (Luna C18 column 150 × 21.2 mm, 3 µm, Phenomenex), eluted at a flow rate 21.2 mL/min, using 70% water acidified with 0.1% formic acid (v/v) and 30% methanol. Fractions were collected at 325 nm to give two compounds: 4 (4.5 mg) and 5 (20.8 mg).
Fraction L2E2 (40.2 mg) was also subjected to the reversed phase preparative HPLC (Luna C18 column 150 × 21.2 mm, 3 µm, Phenomenex, USA), eluted at a flow rate 21.2 mL/min using water acidified with 0.1% formic acid (v/v) as Solvent A and methanol as Solvent B. The following gradient: 35% B (from 0 to 33.0 min), 35 to 25% B (from 33.0 min to 33.5 min), 25% B (from 33.5 to 36.0 min), 25 to 35% B (from 36.0 min to 37.0 min), 35% B (from 37.0 min to 50.0 min), with fraction collection at 325 nm, has afforded three compounds 6 (1.8 mg), 7 (2.6 mg) and 8 (1.2 mg).
Compound 1 (Chlorogenic acid) was obtained as an amorphous colorless solid. C16H18O9;
ESI-MS m/z: 355 [M + H]+. 1H NMR (600.13 MHz, CD3OD) δ: 7.56 (1H, d, J = 16.0 Hz, H-7’), 7.05 (1H, d, J = 2.0 Hz, H-2’), 6.96 (1H, dd, J = 8.1, 2.0 Hz, H-6’), 6.79 (1H, d, J = 8.1 Hz, H-5’), 6.26 (1H, d, J = 16.0 Hz, H-8’), 5.33 (1H, ddd, J = 9.7, 8.7, 4.4 Hz, H-5ax), 4.17 (1H, m, H-3eq), 3.72 (1H, dd, J = 8.7, 3.3 Hz, H-4ax), 2.23 (1H, brdd, J = 13.5, 4.4 Hz, H-6eq), 2.18 (1H, dd, J = 14.0, 3.1 Hz, H-2ax), 2.08 (1H, dd, J = 13.5, 9.7 Hz, H-6ax), 2.05 (1H, ddd, J = 14.0, 3.3, 2.1 Hz, H-2eq); 13C NMR (150.9 MHz, CD3OD) δ: 177.2 (C-7), 168.7 (C-9'), 149.6 (C-4’), 147.1 (C-7’), 146.8 (C-3’), 127.8 (C-1’), 123.0 (C-6’), 116.5 (C-5’), 115.2 (C-8’), 115.1 (C-2’), 76.2 (C-1), 73.5 (C-4), 72.0 (C-5), 71.3 (C-3), 38.2 (C-2), 36.8 (C-6).
Compound 2 (Luteolin) was obtained as an amorphous yellowish solid. C15H10O5; ESI-MS
m/z: 287 [M+H]+. 1H NMR (600.13 MHz, CD3OD) δ: 7.35 (1H, m, H-6’), 7.35 (1H, m, H-2’), 6.89
(1H, d, J = 8.8 Hz, H-5’), 6.52 (1H, s, H-3), 6.41 (1H, d, J = 2.1 Hz, H-8), 6.19 (1H, d, J = 2.1 Hz, H-6); 13C NMR (150.9 MHz, CD3OD) δ: 184.3 (C-4), 166.2 (C-2), 166.0 (C-7), 163.2 (C-5), 159.4
9), 151.0 4’), 147.1 3’), 123.8 1’), 120.4 6’), 116.9 5’), 114.3 2’), 105.4 (C-10), 103.5 (C-3), 100.2 (C-6), 95.3 (C-8).
Compound 3 (Nepetin) was obtained as a yellowish powder. C16H12O7; ESI-MS m/z: 317 [M + H]+. 1H NMR (600.13 MHz, CD3OD) δ: 7.35 (1H, dd, J = 8.9, 2.0 Hz, H-6’), 7.35 (1H, d, J = 2.0 Hz, H-2’), 6.88 (1H, d, J = 8.9 Hz, H-5’), 6.52 (1H, s, H-8), 6.51 (1H, s, H-3), 3.88 (3H, s, OCH3); 13C NMR (150.9 MHz, CD 3OD) δ: 184.2 (C-4), 166.4 (C-2), 154.6 (C-9), 158.7 (C-7), 153.9 (C-5), 151.0 (C-4’), 147.0 (C-3’), 132.8 (C-6), 123.7 (C-1’), 120.3 (C-6’), 116.8 (C-5’), 114.1 (C-2’), 105.7 (C-10), 103.4 (C-3), 95.2 (C-8), 60.9 (OCH3).
Compound 4 (3,5-O-Dicaffeoylquinic acid) was obtained as a white powder. C25H24O12;
ESI-MS m/z: 517 [M+H]+. 1H NMR (600.13 MHz, CD3OD) δ: 7.61 (1H, d, J = 16.0 Hz, H-7’’), 7.58 (1H, d, J = 16.0 Hz, H-7’), 7.07 (2H, d, J = 2.0 Hz, H-2’, H-2’’), 6.97 (2H, dd, J = 8.3, 2.0 Hz, H-6’, H-6’’), 6.78 (2H, d, J = 8.3 Hz, H-5’, H-5’’), 6.36 (1H, d, J = 16.0 Hz, H-8’’), 6.28 (1H, d, J = 16.0 Hz, H-8’), 5.42 (2H, m, H-3eq, H-5ax), 2.31 (1H, brd, J = 14.0 Hz, H-6eq), 2.20 (2H, brs, H-2), 2.14 (1H, dd, J = 14.0, 5.7 Hz, H-6ax); 13C NMR (150.9 MHz, CD3OD) δ: 176.4 (C-7),169.0 (C-9’’), 168.5 (C-9’), 149.6 (C-4’), 149.6 (C-4’’), 147.2 (C-7’), 147.0 (C-7’’), 144.5 (C-3’), 144.5 (C-3’’), 127.9 (C-1’’), 127.8 (C-1’), 122.9 (C-6’), 122.9 (C-6’), 116.4 (C-5’), 116.4 (C-5’’), 115.7 (C-8’’), 115.2 (C-8’), 115.1 (C-2’), 115.1 (C-2’’), 75.2 (C-1), 73.0 (C-5), 72.2 (C-3), 71.2 (C-4), 38.4 (C-2), 36.4 (C-6)
Compound 5 (1,5-O-Dicaffeoylquinic acid) was obtained as a an amorphous solid. C25H24O12; ESI-MS m/z: 517 [M+H]+. 1H NMR (600.13 MHz, CD3OD) δ: 7.60 (1H, d, J = 16.0 Hz, H-7’), 7.57 (1H, d, J = 16.0 Hz, H-7’’), 7.06 (2H, d, J = 2.2 Hz, H-2’, H-2’’), 6.96 (2H, dd, J = 8.2, 2.2 Hz, H-6’, H-6’’), 6.78 (2H, d, J = 8.2 Hz, H-5’, H-5’’), 6.30 (1H, d, J = 16.0 Hz, H-8’), 6.27 (1H, d, J = 16.0 Hz, H-8’’), 5.42 (1H, brtd, J = 8.9, 4.1 Hz, H-5ax), 4.31 (1H, brq, J = 4.0, H-3eq), 3.81 (1H, dd, J = 8.3, 3.2, H-4ax), 2.61 (1H, dd, J = 13.6, 2.7 Hz, H-6eq); 2.52 (1H, dd, J = 15.1, 5.0, H-2ax), 2.44 (1H, dd, J = 15.1, 2.6, H-2eq), 2.08 (1H, dd, J = 13.6, 9.1 Hz, H-6ax); 13C NMR (150.9 MHz, CD3OD) δ: 175.0 7), 170.5 9’’), 168.5 9’), 149.8 4’), 149.8 4’’), 147.1 7’), 147.1 7’’), 146.5 3’), 146.5 3’’), 127.5 1’’), 127.5 1’), 122.8
6’), 122.8 6’), 116.2 5’), 116.2 5’’), 115.1 2’’), 115.1 2’’), 115.1 8’), 114.9 (C-8’’), 80.8 (C-1), 72.6 (C-4), 71.2 (C-5), 69.3 (C-3), 36.7 (C-6), 35.5 (C-2).
Compound 6 (Nepitrin) was obtained as an amorphous yellowish solid. C22H22O12; ESI-MS
m/z: 479 [M+H]+. 1H NMR (600.13 MHz, CD3OD) δ: 7.43 (1H, dd, J = 8.3, 2.0 Hz, H-6’), 7.41 (1H, d, J = 2.0 Hz, H-2’), 6.96 (1H, s, H-8), 6.90 (1H, d, J = 8.3 Hz, H-5’), 6.61 (1H, s, H-3), 5.12 (1H, d, J = 7.6 Hz, H-1’’), 3.95 (1H, dd, J = 12.2, 2.0 Hz, H-6’’a), 3.73 (1H, dd, J = 12.2, 6.1 Hz, H-6’’b), 3.57 (1H, dd, J = 9.1, 7.6 Hz, H-2’’ax), 3.57 (1H, m, H-5’’ax), 3.52 (1H, brt, J = 9.1 Hz, H-3’’ax), 3.42 (1H, brt, J = 9.1 Hz, H-4’’ax), 3.89 (3H, s, CH3O); 13C NMR (150.9 MHz, CD3OD) δ: 184.0 (C-4), 166.7 (C-2), 157.6 (C-7), 154.5 (C-9), 153.8 (C-5), 150.8 (C-4’), 146.7 (C-3’), 133.7 6), 123.2 1’), 120.1 6’), 116.5 5’), 113.9 2’), 107.2 10), 103.4 3), 101.7 (C-1’’), 95.5 (C-8), 78.2 (C-5’’), 77.6 (C-3’’), 74.4 (C-2’’), 71.0 (C-4’’), 62.2 (C-6’’), 61.2 (CH3O).
Compound 7 (Hispiduloside) was obtained as an amorphous yellowish solid. C22H22O11;
ESI-MS: m/z 463 [M+H]+. 1H NMR (600.13 MHz, CD3OD) δ: 7.88 (2H, d, J = 8.7, H-2’, H-6’), 6.95 (1H, s, H-8), 6.92 (2H, d, J = 8.7 Hz, H-3’, H-5’), 6.64 (1H, s, H-3), 5.12 (1H, d, J = 7.6 Hz, H-1’’), 3.96 (1H, dd, J = 12.1, 2.1 Hz, H-6’’a), 3.73 (1H, dd, J = 12.1, 6.1 Hz, H-6’’b), 3.58 (1H, dd, J = 9.1, 7.6 Hz, H-2’’ax), 3.58 (1H, m, H-5’’ax), 3.53 (1H, brt, J = 9.1 Hz, H-3’’ax), 3.42 (1H, brt, J = 9.2 Hz, H-4’’ax), 3.89 (3H, s, CH3O); 13C NMR (150.9 MHz, CD3OD) δ: 184.0 (C-4), 166.6 (C-2), 162.6 (C-4’), 157.6 (C-7), 154.1 (C-9), 153.8 (C-5), 133.8 (C-6), 129.3 (C-2’, C-6’), 122.8 (C-1’), 116.7 (C-3’, C-5’), 107.2 (C-10), 103.3 (C-3), 101.7 (C-1’’), 95.5 (C-8), 78.3 (C-5’’), 77.6 (C-3’’), 74.5 (C-2’’), 71.0 (C-4’’), 62.2 (C-6’’), 61.2 (CH3O).
Compound 8 (Jaceosid) was obtained as amorphous yellowish solid. C23H24O12; ESI-MS m/z
: 493 [M+H]+. 1H NMR (600.13 MHz, CD3OD) δ: 7.56 (1H, dd, J = 8.3, 1.8 Hz, H-6’), 7.52 (1H, d,
J = 1.8 Hz, H-2’), 7.02 (1H, s, H-8), 6.94 (1H, d, J = 8.3 Hz, H-5’), 6.71 (1H, s, H-3), 5.13 (1H, d,
J = 7.7 Hz, H-1’’), 3.97 (3H, s, CH3O-3’), 3.95 (1H, dd, J = 12.1, 2.0 Hz, H-6’’a), 3.90 (3H, s,
CH3O-6), 3.71 (1H, dd, J = 12.1, 6.2 Hz, H-6’’b), 3.58 (1H, m, H-5’’ax), 3.57 (1H, ov, H-2’’ax),
CD3OD) δ: 184.2 4), 166.6 2), 157.7 7), 154.7 5), 154.2 9), 152.3 4’), 149.6
(C-3’), 134.2 (C-6), 123.3 (C-1’), 121.7 (C-6’), 116.6 (C-5’), 110.5 (C-2’), 107.4 (C-10), 103.8 (C-3), 101.8 (C-1’’), 95.6 (C-8), 78.3 (C-5’’), 77.8 (C-3’’), 74.5 (C-2’’), 71.1 (C-4’’), 62.3 (C-6’’), 61.2 (CH3O-6), 56.4 (CH3O-3’).
2.6 Validation of UHPLC-DAD method
The recommendations of the “Société Française des Sciences et Techniques Pharmaceutiques” (SFSTP) were respected for the validation of the analytical method in herbal medicinal products (D. Bellenot et al., 2015). Two kinds of samples, calibration and validations standards, were prepared separately. Calibration standards were prepared twice per day over three days. Validation standards were prepared three times per day over three days.
Preparation of calibration standards
Weigh 15.0 mg of Chlorogenic acid (CA) into a volumetric flask of 10.0 mL and dilute to 10.0 mL with MeOH. Weigh 16.3 mg of 1,5-O-Dicaffeoylquinic acid (DCQA) into a volumetric flask of 5.0 mL and dilute to 5.0 mL with MeOH. Weigh 12.0 mg of Nepetin (NPT) acid into a volumetric flask of 20.0 mL and dilute to 20.0 mL with MeOH. Place 2.0 mL of each solution into a volumetric flask of 50.0 mL and dilute to 50.0 mL with MeOH. Final concentrations for CA, DCQA and NPT are 60.0 µg/mL, 130.4 µg/mL and 24.0 µg/mL, respectively. Filter 2 mL of this solution through a PVDF filter (0.22 µm, Millipore) for UHPLC analysis.
Preparation of validation standard
Put 10 g of powdered flowers into the grinder and homogenize for 5 seconds three times. Weigh 1.000 g of homogenized flowers and mix with 90 mL of MeOH into a round-bottomed flask of 250 mL. Extract under reflux for 30 minutes. Cool for 15 minutes. Filter into a volumetric flask of 100.0 mL through a paper filter, rinse two times with 5 mL of MeOH and dilute to 100.0 mL with MeOH. Filter 2 mL of this solution through a PVDF filter (0.22 µm, Millipore) for UHPLC analysis.
2.7 Statistical analysis
All statistical analyses were based on two-sided p-values, where p < 0.01 indicates statistical significance. They were performed with SAS version 9.4 (SAS Institute, Cary, NC).
3. Results and discussion
3.1 UHPLC-DAD-ESI-MS/MS study of L2E
The ethanol crude extract (L2) showed promising anti-inflammatory effect activity with IC50 of
NO release of 0.77 µg/mL. In a bio-guided fractionation approach, each extract obtained after solvent partitioning was evaluated for the inhibition of NO release its anti-inflammatory activity. The ethyl acetate extract (L2E) has been found to be the most active with IC50 of NO release of 0.42
µg/mL and was selected for the next step study. Petroleum ether (L2P) and dichloromethane (L2D) extracts were less active with IC50 of NO release of 5.06 µg/mL and 0.58 µg/mL, respectively.
The UHPLC-DAD-ESI-MS/MS method was used for the separation and identification by analytical chromatography of eleven compounds from the extract L2E. The spectroscopic data are shown in the Table 2.
Table 2 Spectroscopic data of compounds of the extract L2E analyzed by UHPLC-DAD-ESI-MS/MS Cmpd no Rt (min) λmax (nm) [M+H]+ (m/z) MS/MS (m/z) Identification 1 2.8 240-326 355 185-215 Chlorogenic acid 4 8.2 242-328 517 - 3,5-O-Dicaffeoylquinic acida 5 9.6 242-328 517 499 1,5-O-Dicaffeoylquinic acid 6 10.6 272-348 479 317 Nepitrin 7 13.6 232-272-334 463 301 Hispiduloside 8 14.4 224-260-346 493 331 Jaceosid 2 15.0 254-348 287 - Luteolina,c 3 16.1 254-348 317 302 Nepetinc 10 19.2 280-338 331 298-316 6-Hydroxykaempferol 3,7-dimethyl etherb 9 19.9 222-272-336 301 286 Hispidulinb,c 11 20.5 268-344 361 346 Chrysosplenol Cb
aNo MS/MS fragments were detected; bGarayev et al., 2017; cReynaud and Lussignol, 1999
The compound (1) with Rt 2.8 min and parent ion m/z 355 was suggested to be Chlorogenic acid.
Two compounds (2 and 3) with the retention times (Rt) 15.0 and 16.1 min, UV spectra characteristic of flavonoids and the parent ions m/z 287 and 317 [M + H]+ were supposed to correspond to Luteolin and Nepetin, respectively.
Two compounds (4 and 5) with Rt 8.2 and 9.6 min and UV spectra characteristic of phenolic acids show the same parent ions m/z 517 [M + H]+ and suggest that they possess the same caffeoyl chromophore.
Two compounds (6 and 7) with Rt 10.6 and 13.6 min, UV spectra characteristic of flavonoids and the parent ions m/z479 and 463 [M + H]+, could be glucosides of Nepetin and Hispidulin because the fragment ions 317 and 301 can correspond to their aglycones, respectively. The difference between the parent and fragment ion of 162 Da, for both compounds, can suggest the loss of a glucose residue.
The compound (8) with Rt 14.43 min, UV spectra characteristic of flavonoids and parent ion m/z493 can be also glycosylated.
The chromatogram shows also three compounds (9, 10 and 11) with Rt 19.9, 19.2 and 20.5 min and parent ions m/z331, 301 and 361 [M+H]+ respectively. These compounds were confirmed to be 6-Hydroxykaempferol 3,7-dimethyl ether, Hispidulin and Chrysosplenol C, respectively by comparing their retention time and MS/MS data with those of the authentic substances (Garayev et al., 2017).
3.2 Confirmation by NMR of the structures of isolated compounds from L2E
To confirm the structural assumptions, the compounds have been isolated and identified by NMR 1H, 13C and 2D NMR data were compared to the spectroscopic data reported in the literature. The following compounds are present in the flowers of I. montana (Figure 1).
Compound 1 shows a molecular formula to be C16H18O9 by positive mode electrospray ionization
mass spectrometry (ESI-MS) data at m/z 355 [M+H]+. The 13C NMR and edited-HSQC NMR spectra of 1 displayed 16 carbon signals included six quaternary carbons (δC177.2, 168.7, 149.6,
146.8, 127.8, 76.2), eight methine (δC.147.1, 123.0, 116.5, 115.2, 115.1, 73.5, 72.0, 71.3) and two
methylene groups (δC.38.2, 36.8). Among the four quaternary carbons, one was an acid carbon at δC
177.2 (C-7), one was an ester carbon at δC 168.7(C-9’), two were an oxygenated aromatic carbon
according to its chemical shift at δC 149.6 (C-4’), 146.8 (C-3’). Among the eight methine groups,
five corresponded to aromatic carbons according to their chemical shifts at δC 147.1 (C-7’), 123.0
(C-6’), 116.5 (C-5’), 115.2 (C-8’), 115.1 (C-2’) and tree corresponded to oxymethine carbons according to their chemical shifts at δC 73.5 (C-4), 72.0 (C-5), 71.3(C-3). All methylene groups are
alkane to their chemical shifts at δC 38.2(C-2) and 36.8 (C-6). The 1H NMR spectrum of 1 displayed
an ABX system at δH 7.05 (1H, d, J = 2.0 Hz, H-2’), 6.96 (1H, dd, J = 8.1, 2.0 Hz, H-6’), 6.79 (1H,
d, J = 8.1 Hz, H-5’) and two trans olefinic protons as doublets (J = 16.0 Hz) at δH 7.56 (H-7’), 6.26
(H-6’) giving a crosspeak with an ester function at δC 168.7 (C-9’) in HMBC spectrum and a
crosspeak with the aromatic carbon at δC 127.8 (C-1’), 123.0 (C-6’), 115.1(C-2’) corresponded to a
trans-caffeoyl group. The second part of proton at δH 5.33 (H-5), 3.72 (H-4ax), 2.23 (H-6eq), 2.18
δH 5.33 and the 3J = HMBC correlation with ester carbon at δC 168.7 (C-9’) showed that
trans-caffeoyl moiety was attached on C-3 of the quinic acid. Based on further comparison of the NMR data with those in the literature (Pauli et al., 1999), the structure of 1 was determined to be chlorogenic acid.
The molecular formula of compound 4 was deduced to be C25H24O12 by positive mode electrospray
ionization mass spectrometry (ESI-MS) data at m/z 517 [M+H]+. Compared to compound 1, the 13C and 1H NMR spectra of 4, indicated the presence of two trans-caffeoyl groups and a quinic acid. The position of the two trans-caffeoyl groups on quinic acid was established by the downfield shift of the proton signals at δH 5.42 (H-3eq) and δH 5.42 (H-5ax) and carbon signals at δC 73.0 (C-5) and
δC 72.2 (C-3) and by the 3J HMBC correlation of H-3 eq at δH 5.42 with ester carbon at δC 168.5
(C-9’) and H-5 ax at δH 5.42 with ester carbon at δC 169.0 (C-9’’) showed that two trans-caffeoyl
moiety were attached on C-3 and on C-5 respectively of the quinic acid. Based on further comparison of the NMR data with those in the literature (Kodoma et al., 1998), the structure of 4 was determined to be 3,5-O-Dicaffeoylquinic acid.
Compound 5 presents a molecular formula to be C25H24O12 by positive mode electrospray
ionization mass spectrometry (ESI-MS) data at m/z 517 [M+H]+. The 13C and 1H NMR spectra of 5 indicated the presence of two trans-caffeoyl groups and a quinic acid and were also similar to those of compound 4. The major differences were the chemical shift of C-1, C-3 and H-3eq at the quinic
acid moiety in compound 5. The C-1 of 5 was deshielded at δC 80.8 and C-3, H-3eq were shielded at
δC 69.3 and at δH 4.31 respectively, showed that the second trans-caffeoyl group was attached on
C-1 of the quinic acid. Based on further comparison of the NMR data with those in the literature (Merfort, 1992), the structure of 5 was determined to be 1,5-O-Dicaffeoylquinic acid.
The molecular formula of compound 2 was deduced to be C15H10O5 by positive mode electrospray
ionization mass spectrometry (ESI-MS) data at m/z 287 [M+H]+. The 13C NMR and edited-HSQC NMR spectra of 2 displayed 15 carbon signals included nine quaternary (δC 184.3, 166.2, 166.0,
114.3, 100.2, 95.3). Among the nine quaternary carbons, one was an aromatic ketone carbon at δC
184.3 (C-4), six were oxygenated aromatic carbon according to their chemical shifts at δC 166.2
(C-2), 166.0 (C-7), 163.2 (C-5), 159.4 (C-9), 151.0 (C-4’), 147.1 (C-3’) and two are aromatic carbon according to their chemical shifts at δC 123.8 (C-1’), 105.4 (C-10). All oxymethine carbons were
aromatic carbons according to their chemical shifts at δC 120.4 (C-6’), 116.9 (C-5’), 114.3 (C-2’),
100.2 (C-6), 95.3 (C-8). The 1H NMR spectrum of 2 displayed an ABX system at δH 7.35 (1H, m,
H-2’), 7.35 (1H, m, H-6’), 6.89 (1H, d, J = 8.8 Hz, H-5’) due to a 3’,4’-disubstitution pattern of ring B. Moreover, two meta-coupled doublets at δH 6.41 (1H, J = 2:1 Hz, H-8) and 6.19 (1H, J = 2:1
Hz, H-6) were consistent with 5,7-dioxygenated ring A. These resonances together with the singlet at δH 6.52 (H-3) and the corresponding carbon signals revealed the presence of a luteolin. Based on
further comparison of the NMR data with those in the literature (Azimova and Vinogradova, 2013), the structure of 2 was determined to be luteolin.
Compound 3 shows the molecular formula C16H12O7 deduced by positive mode electrospray
ionization mass spectrometry (ESI-MS) data at m/z 317 [M+H]+. Compared to compound 2, the 13C and 1H NMR spectra of 3 are similar. The major differences were the presence of the chemical shift at δC 60.9 and at δH 3.88 (3H, s) corresponding of methoxy group, and a disappeared of H-6 signal.
The position of the methoxy group was established by the downfield shift of the carbon signals at
δC 132.8 (C-3) and the 3J crosspeak in HMBC spectrum between methoxy group at δH 3.88 and
carbon signals at δC 132.8 (C-3), showed that the methoxy group was attached on C-3 of the
flavone. Based on further comparison of the NMR data with those in the literature (Azimova and Vinogradova, 2013), the structure of 3 was determined to be Nepetin.
Compound 6 presents a molecular formula C22H22O12 deduced by positive mode electrospray
ionization mass spectrometry (ESI-MS) data at m/z 479 [M+H]+. Compared to compound 3, the 13C and 1H NMR spectra of 3 are similar. Additionally, the resonances of on anomeric proton, indicative of the presence of one β- linked sugar unit δH 5.12 (1H, d, J = 7:6 Hz, H-1’’).
experiments, which indicated the presence of β-glucosyl as sugar units. The position of the β -glucosyl as sugar units was established by the 3J crosspeak in HMBC spectrum between the anomeric proton H-1’’ at δH 5.12 and carbon signal at δC 157.6 (C-3), showed that the β-glucosyl
moiety was attached on C-7 of the flavone. Based on further comparison of the NMR data with those in the literature (Monsef–Esfahani et al., 2014), the structure of 6 was determined to be Nepitrin.
The molecular formula of compound 7 was deduced to be C22H22O11 by positive mode electrospray
ionization mass spectrometry (ESI-MS) data at m/z 463 [M+H]+. Compared to compound 6, the 13C and 1H NMR spectra of 7 are similar, excepted by a presence of an AB system at δH 6.95 (2H, d, J
= 8:7 Hz, H-2’, H-6’), δH 6.95 (2H, d, J = 8:7 Hz, H-3’, H-5’) due to a 4’-substitution pattern of
ring B. Based on further comparison of the NMR data with those in the literature (Weng and Wang, 2000), the structure of 7 was determined to be Hispiduloside.
Compound 8 shows a molecular formula C23H24O12 by positive mode electrospray ionization mass
spectrometry (ESI-MS) data at m/z 493 [M+H]+. Compared to compound 6, the 13C and 1H NMR spectra of 8 are similar. The major differences were the presence of the chemical shift at δC 56.4
and at δH 3.97 (3H, s) corresponding of a second methoxy group. The position of the second
methoxy group was established by the 3J crosspeak in HMBC spectrum between methoxy group at
δH 3.97 and carbon signals at δC 149.6 (C-3’), showed that the second methoxy group was attached
on C-3’ of the flavone ring B. Based on further comparison of the NMR data with those in the literature (Hong, 2008), the structure of 8 was determined to be Jaceosid.
Compounds 1 and 4-8 are reported in I.montana for the first time.
Based on literature data, the study of the phenolic composition of A. montana shows that five compounds (1, 2, 4, 5 and 7) isolated from I. montana are also present in A. montana flowers (Jaiswal et al., 2011; Merfort, 1992; Merfort and Wendisch, 1987).
Figure 1. Isolated phenolic acids and flavonoids from I.montana
R1 R2 R3 R1 R2 R3
1 H H Caf 2 H H OH
4 H Caf Caf 3 OCH3 H OH
5 Caf H Caf 6 OCH3 Glucose OH
Caf = Caffeoyl
7 OCH3 Glucose H
8 OCH3 Glucose OCH3
3.3 Evaluation of the anti-inflammatory potential of isolated compounds
Nitric oxide (NO), which is produced by the NO synthase when induced by pro-inflammatory cytokines, has been shown as an important element of the inflammatory mechanisms. During bacterial infection more particularly, a 1000-fold increase of NO production may be observed in neutrophils and macrophages. NO plays two essential roles in cellular-response to bacterial infection: when excreted in the extracellular environment, it acts as a mediator of the inflammatory response, whereas in the lysosomal environment it contributes to microbe destruction with other oxygen radicals. However, although NO is essential in the cellular defense against infectious diseases, its overproduction may lead to adverse effects such as autoimmune reactions and neurodegenerative syndromes. As a consequence, inhibition of NO synthesis or NO scavenging may be considered as possible strategies in the treatment of chronic inflammatory diseases (Sharma et al., 2007).
In the present study, NO-inhibition was assessed in murine macrophages (RAW 267.4 cell line), in which a strong inflammatory response, leading to NO synthesis and secretion in the culture medium, was initiated by LPS of E. coli (Gao et al., 2018; Pansanit et al., 2013).
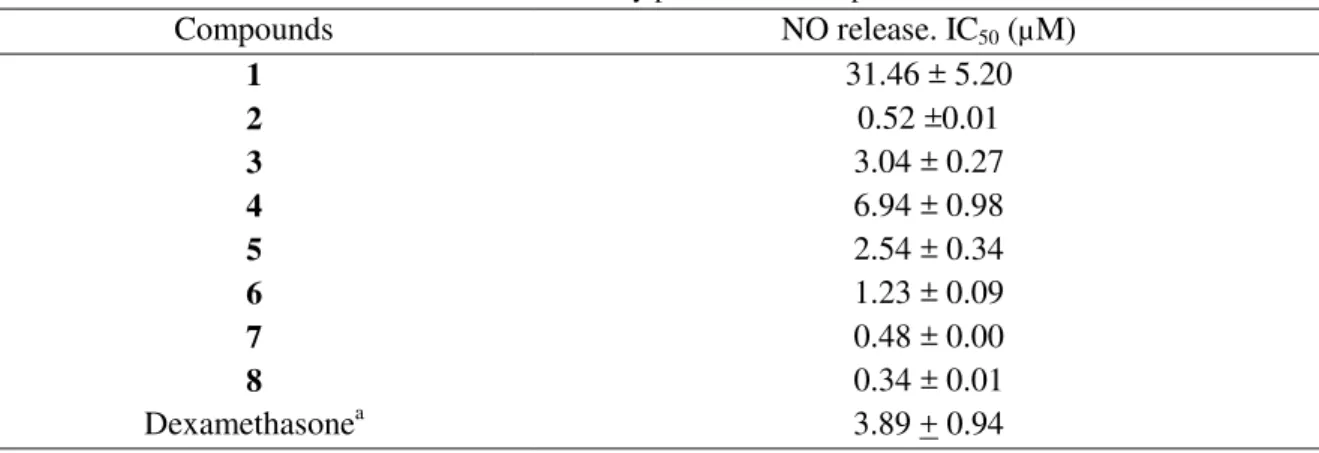
Results are presented in Table 3. All compounds showed inhibitory effects of NO production with IC50 < 32 µM, however compounds 2, 3, 5-8 have been found to be more active
Most of the isolated phenolic compounds in from the flowers of I. montana present promising anti-inflammatory.
These results allow to validate scientifically the traditional use of flowers for the relief of bruises. The study provides evidence that Inula montana presents potential anti-inflammatory effect. Further experiments are necessary to confirm these first results in order to propose Inula montana as an alternative to Arnica montana. Moreover, active compounds 2, 5 and 7 are present in the both species.
3.4 Analytical validation of UHPLC-DAD method
Three major active compounds Chlorogenic acid (1), Nepetin (3) and 1,5-O-Dicaffeoylquinic acid (5) were retained for their quantification in the plant material, in order to evaluate the quality of Inula montana. This UHPLC-DAD method was validated in term of analysis of specificity, response functions, trueness, precision, accuracy, linearity and limits of detection and quantification. The validation summary can be found in Table 4.
The specificity of the method has been investigated. Calibration and validation standards were prepared and analyzed in terms of specificity. No interference and great resolution were observed for each compound which was assessed by comparing the retention time and the UV spectra with the standard. Furthermore, the purity of the investigated peak was confirmed by DAD purity studies.
The calibration curves were based on the through-origin linear regression model which was
Table 3. Anti-inflammatory potential of compounds 1-8
Compounds NO release. IC50 (µM) 1 31.46 ± 5.20 2 0.52 ±0.01 3 3.04 ± 0.27 4 6.94 ± 0.98 5 2.54 ± 0.34 6 1.23 ± 0.09 7 0.48 ± 0.00 8 0.34 ± 0.01 Dexamethasonea 3.89 + 0.94 aPositive control
fitted with concentration levels ranging from 29.1-94.0 µg/mL, 70.5-221.0 µg/mL and 10.4-32.1 µg/mL for Chlorogenic acid (CA), 1,5-O-Dicaffeoylquinic acid (DCQA) and Nepetin (NPT), respectively. Each of three calibration points was prepared in duplicate and each of five validation points was prepared in triplicate over three consecutive days. The coefficients of determination of each-day equation of the regression line were all greater than R2 >0.999 for the calibration and validation standards.
The precision of the method was determined by computing the Relative Standard Deviation (RSDs) for repeatability and intermediate precision at each concentration level of the validation standards. The precision of the validation standards did not exceed 5% for each compound, as shown in Table 4. The comparable RSDs between repeatability and intermediate fidelity were mainly due to non-significant intergroup variances, validating the precision of the developed method.
Table 4 Results of validation of UHPLC-DAD method for the quantitative analysis of Chlorogenic acid (CA), 1,5-O-Dicaffeoylquinic acid (DCQA) and Nepetin (NPT).
Validation criteria CA DCQA NPT
Response function (m=3; d=3; n=2;)a Y=ax
Day 1 R2=0.9999 R2=0.9999 R2=0.9998 Day 2 R2=0.9999 R2=0.9998 R2=0.9997 Day 3 R2=0.9999 R2=0.9998 R2=0.9997 Linear Range 29.1-94.0 µg/mL 70.5-221.0 µg/mL 10.4-32.1 µg/mL Trueness (m=5; d=3; n=3)a Concentration
(µg/mL) Relative biais (%) Concentration (µg/mL) Relative biais (%) Concentration (µg/mL) Relative biais (%)
Level 1 30.4 0.75 71.9 -0.05 10.5 -0.16 Level 2 45.7 2.72 108.0 0.39 15.8 0.25 Level 3 60.8 0.68 143.9 0.49 21.0 -0.02 Level 4 75.9 -1.70 179.6 -0.26 26.3 0.39 Level 5 91.2 -2.46 215.6 -0.57 31.5 -0.46 Precision (d=3; n=3)a Repeatability RSD (%) Intermediate precision RSD (%) Repeatability RSD (%) Intermediate Precision RSD (%) Repeatability RSD (%) Intermediate Precision RSD (%) Level 1 0.90 0.90 1.96 1.96 1.41 1.58 Level 2 0.90 0.90 1.29 1.38 1.66 1.66 Level 3 1.64 1.64 1.81 1.81 1.95 1.95 Level 4 1.08 1.08 1.74 1.74 1.49 1.71 Level 5 0.94 0.94 1.32 1.32 1.03 1.03 Accuracy (d=3; n=3)a
β-expectation lower and upper tolerance limits of the relative
errors (%)
β-expectation lower and upper tolerance limits of the relative
errors (%)
β-expectation lower and upper tolerance limits of the relative
errors (%) Level 1 -1.49; 2.98 -4.92; 4.82 -4.31; 3.99 Level 2 0.48; 4.97 -3.21; 3.99 -3.90; 4.40 Level 3 -3.40; 4.77 -4.01; 4.99 -4.88; 4.85 Level 4 -4.40; 1.01 -4.60; 4.07 -4.14; 4.92 Level 5 -4.90; -0.02 -3.86; 2.72 -3.04; 2.12 Linearity slope 0.9889 0.9979 0.9993 R2 0.9987 0.9994 0.9997 LODb 0.12 µg/mL 0.17 µg/mL 0.09 µg/mL LOQb 0.39 µg/mL 0.56 µg/mL 0.31 µg/mL
Trueness and intermediate fidelity were used for the accuracy profile. The acceptance thresholds were set at ±5% and the results are acceptable with -4.90 and 4.97% for CA, -4.92 and 4.99% for DCQA and -4.88 – 4.92% for NPT, as it is shown in Table 4.
The linearity of this method was confirmed by a linear regression function of estimated concentrations to introduced concentrations calculated all the series of validation standards (N = 45). The following equations of the regression line were determined y=0.9889x (R2=0.9987), y=0.9979x (R2=0.9994) and y=0.9993x (R2=0.9997) for CA, DCQA and NPT, respectively, as it is shown in Table 4.
Limit of Detection (LOD) and Limit of Quantification (LOQ) were determined by calculating LOD and LOQ as 3 and 10 times of intensity of background noise, respectively. LOD and LOQ of CA, DCQA and NPT were calculated to be 0.12 and 0.39 µg/mL, 0.17 and 0.56 µg/mL, 0.09 and 0.31 µg/mL, respectively.
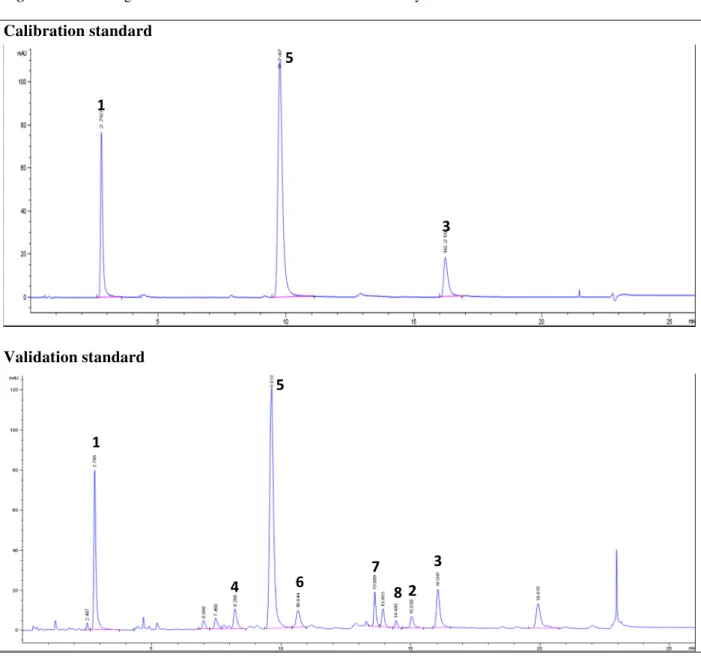
The retention times of CA, DCQA and NPT were 2.79, 9.61 and 16.05 min, respectively. The chromatograms of the calibration and validation standards are presented in Figure 2. These results show that UHPLC-DAD method is validated for the quantification of Chlorogenic acid, 1,5-O-Dicaffeoylquinic acid and Nepetin in flowers of Inula montana L.
Figure 2. Chromatograms of Calibration and Validation Standards by UHPLC-DAD at 335 nm
Calibration standard
Validation standard
Chlorogenic acid (1), Luteolin (2), Nepetin (3), 3,5-O-Dicaffeoylquinic acid (4), 1,5-O-Dicaffeoylquinic acid (5), Nepitrin (6), Hispiduloside (7) and Jaceosid (8)
3.5 Comparison of the content of CA, DCQA and NPT in Inula montana from different collect sites
The validated method was applied for the quantitative analysis of the three major compounds in flowers: Chlorogenic acid (CA), 1,5-O-Dicaffeoylquinic acid (DCQA) and Nepetin (NPT), from the two collection sites of Regional Natural Park of Luberon. One-way ANOVA confirms significant results between the mean content of phenolic compounds at p<0.01 (Table 5).
1 3 5 1 2 3 4 5 6 8 7
Table 5 Quantification of Chlorogenic acid (CA), 1,5-O-Dicaffeoylquinic acid (DCQA) and Nepetin (NPT) in flowers of Inula montana L. from different collection sites
The content of Chlorogenic acid and 1,5-O-Dicaffeoylquinic acid in flowers from Merindol was higher in 2015 with 0.61 and 1.44 %, respectively. In order to compare the influence of altitude on the content of phenolic compounds, two collection sites were compared: Merindol (170 m) and Bonnieux (680 m). Despite the fact that the altitude in Merindol (170 m) is four times lower than in Bonnieux (680 m), no significant differences in the content of each phenolic compound were observed between the two collection sites.
4. Conclusion
Bio-guided fractionation of 95% ethanolic crude extract allowed the identification of eleven compounds from Inula montana. Chlorogenic acid (1), 3,5-O-Dicaffeoylquinic acid (4), 1,5-O-Dicaffeoylquinic acid (5), Nepitrin (6), Hispiduloside (7) and Jaceosid (8) are reported in this species for the first time. Among them, 1, 4, 5 and 7 are also present in Arnica montana.
A simple, accurate and rapid UHPLC-DAD method was developed as the first report of a simultaneous determination of three main phenolic compounds, chosen as analytical markers of this species, Chlorogenic acid, 1,5-O-Dicaffeoylquinic acid and Nepetin in Inula montana. This validated method allows the quality control of the herbal drug and was applied for the comparison of the phenolic content of the two collection sites: Bonnieux and Merindol. We can conclude that the content of phenolic compounds was close for these collection sites.
Place of collect Collect date Altitude (m) CA contenta (%) DCQA contenta (%) NPT contenta (%) Merindol 03/06/2015 170 0.61±0.02 1.44±0.03 0.21±0.01 Bonnieux 31/05/2017 680 0.39±0.01 1.02±0.11 0.25±0.01 Merindol 31/05/2017 170 0.39±0.02 0.92±0.05 0.22±0.02
% = g per 100 g of dry plant material. aThe mean of three independent analysis ± Standard Deviation. The results of
The potential anti-inflammatory effect, based on NO-inhibition, of different extracts and compounds from Inula montana provides the scientific basis for the traditional use of this plant for the relief of bruises and underlines the ethnopharmacological relevance. Nevertheless this interesting biological activity should be investigated by complementary experiments concerning other mediators of the inflammatory response (TNFα, IL-1) in order to confirm the anti-inflammatory activity and to propose Inula montana as an alternative to Arnica montana.
Acknowledgement
We are grateful to Mr. Vincent Lorenzini from the Embassy of France in Azerbaijan for his contribution to the funding of this research project work and to Dr. Didier Morisot and Mr. Laurent Michel for their botanical identification.
The work was supported by the region PACA (France) (grant number 2013-08504), the Embassy of France in Azerbaijan (grant numbers 836060K and 862819K) and the Luberon Natural Regional Park in France (grant number 887312G).
Conflict of interest statement
References
Amir, M.,1998. Les cueillettes de confiance, édition Forcalquier.
Azimova, S.S., Vinogradova, V.I. (Eds.), 2013. Natural Compounds. Springer New York, New York, NY.
Bellenot, D., Barrau, E., Chanel, I., Dufat, H., Brum, M., Abbe, P., Alet, P., Baghdikian, B., Lugez, M., Maciuk, A., Portier, G., Romerales, C., Saperas, O., Seigneuret, J.M., Soussain, R., 2015. Problématiques liées au développement d’une procédure analytique de dosage de constituants dans les médicaments à base de plante(s) IV. Recommandations pour le développement et la validation. STP Pharma Prat. 25, 235–270.
Belyagoubi-Benhammou, N., Belyagoubi, L., Atik Bekkara, F., 2014. Phenolic contents and antioxidant activities in vitro of some selected Algerian plants. J. Med. Plant Res. 8, 1198–1207. Gao, C., Du, Y., Wang, X., Cao, H., Lin, B., Liu, Y., Di, X., 2018. Hexahydrobenzophenanthridine alkaloids from Corydalis bungeana Turcz. and their anti-inflammatory activity. Bioorg. Med. Chem. Lett. 28, 2265–2269. https://doi.org/10.1016/j.bmcl.2018.05.039
Garayev, E., Herbette, G., Di Giorgio, C., Chiffolleau, P., Roux, D., Sallanon, H., Ollivier, E., Elias, R., Baghdikian, B., 2017. New sesquiterpene acid and inositol derivatives from Inula montana L. Fitoterapia 120, 79–84. https://doi.org/10.1016/j.fitote.2017.05.011
Girerd, B., Roux, J.-P., 2011. Flore du Vaucluse: troisière inventaire, descriptif, écologique et chronologique. Biotope, Mèze.
Gonzalez Romero M.A., Villaescusa Castillo L., Diaz Lanza A.M., Bartolome Esteban C., Fernandez Matellano L., 2001. Phytochemistry and pharmacological studies of Inula montana. Recent Res. Dev. Phytochem. 5, 255–268.
Hong, J.-L., 2008. Phenolic Constituents of Veronica linariifolia. Chin. J. Nat. Med. 6, 126–129. https://doi.org/10.3724/SP.J.1009.2008.00126
Jaiswal, R., Kiprotich, J., Kuhnert, N., 2011. Determination of the hydroxycinnamate profile of 12
members of the Asteraceae family. Phytochemistry 72, 781–790.
https://doi.org/10.1016/j.phytochem.2011.02.027
Kodoma, M., Wada, H., Otani, H., Kohmoto, K., Kimura, Y., 1998. 3,5-Di-O-caffeoylquinic acid, an infection-inhibiting factor from Pyrus pyrifolia induced by infection with Alternaria alternata. Phytochemistry 47, 371–373. https://doi.org/10.1016/S0031-9422(97)00621-3
Kriplani, P., Guarve, K., Baghael, U.S., 2017. Arnica montana L . - a plant of healing: review. J. Pharm. Pharmacol. 69, 925–945. https://doi.org/10.1111/jphp.12724
Martín, T., Villaescusa, L., Gasquet, M., Delmas, F., Bartolomé, C., Díaz-Lanza, A.M., Ollivier, E., Balansard, G., 1998. Screening for Protozoocidal Activity of Spanish Plants. Pharm. Biol. 36, 56– 62. https://doi.org/10.1076/phbi.36.1.56.4627
Merfort, I., 1992. Caffeoylquinic acids from flowers of Arnica montana and Arnica chamissonis. Phytochemistry 31, 2111–2113. https://doi.org/10.1016/0031-9422(92)80373-M
Merfort, I., Wendisch, D., 1987. Flavonoidglycoside aus Arnica montana und Arnica chamissonis. Planta Med. 53, 434–437.
Monsef–Esfahani, H.R., Shahverdi, A.R., Khorramizadeh, M.R., Amini, M., Hajiaghaee, R., 2014. Two Matrix Metalloproteinase Inhibitors from Scrophularia Striata Boiss. Iran. J. Pharm. Res. IJPR 13, 149.
Obón, C., Rivera, D., Verde, A., Fajardo, J., Valdés, A., Alcaraz, F., Carvalho, A.M., 2012. Árnica: A multivariate analysis of the botany and ethnopharmacology of a medicinal plant complex in the
Iberian Peninsula and the Balearic Islands. J. Ethnopharmacol. 144, 44–56.
https://doi.org/10.1016/j.jep.2012.08.024
Pansanit, A., Park, E.-J., Kondratyuk, T.P., Pezzuto, J.M., Lirdprapamongkol, K., Kittakoop, P., 2013. Vermelhotin, an Anti-inflammatory Agent, Suppresses Nitric Oxide Production in RAW 264.7 Cells via p38 Inhibition. J. Nat. Prod. 76, 1824–1827. https://doi.org/10.1021/np400565e Pasquier, B., Godin, M., 2014. L’arnica des montagnes, entre culture et cueillette. Jard. Fr. 19–21. Pauli, G.F., Kuczkowiak, U., Nahrstedt, A., 1999. Solvent effects in the structure dereplication of caffeoyl quinic acids. Magn. Reson. Chem. 37, 827–836.
Rameau, J.-C., Mansion, D., Dumé, G., 1989. Flore forestière française: guide écologique illustré. Institut pour le développement forestier : Ministère de l’agriculture et de la forêt, Direction de l’espace rural et de la forêt : Ecole nationale du génie rural, des eaux et des forêts, Paris.
Reynaud, J., Lussignol, M., 1999. Free Flavonoid Aglycones from Inula montana. Pharm. Biol. 37, 163–164. https://doi.org/10.1076/phbi.37.2.163.6079
Seca, A.M.L., Grigore, A., Pinto, D.C.G.A., Silva, A.M.S., 2014. The genus Inula and their metabolites: From ethnopharmacological to medicinal uses. J. Ethnopharmacol. 154, 286–310. https://doi.org/10.1016/j.jep.2014.04.010
Sharma, J.N., Al-Omran, A., Parvathy, S.S., 2007. Role of nitric oxide in inflammatory diseases. Inflammopharmacology 15, 252–259. https://doi.org/10.1007/s10787-007-0013-x
Sugier, D., Sugier, P., Gawlik-Dziki, U., 2013. Propagation and Introduction of Arnica montana L. into Cultivation: A Step to Reduce the Pressure on Endangered and High-Valued Medicinal Plant Species. Sci. World J. 2013, 1–11. https://doi.org/10.1155/2013/414363
Teixidor-Toneu, I., Martin, G.J., Ouhammou, A., Puri, R.K., Hawkins, J.A., 2016. An ethnomedicinal survey of a Tashelhit-speaking community in the High Atlas, Morocco. J. Ethnopharmacol. 188, 96–110. https://doi.org/10.1016/j.jep.2016.05.009
Tela Botanica, 2018. Tela Botanica, 2016.
Food Chem. 71, 489–493.
Wu, J., Tang, C., Yao, S., Zhang, L., Ke, C., Feng, L., Lin, G., Ye, Y., 2015. Anti-inflammatory Inositol Derivatives from the Whole Plant of Inula cappa. J. Nat. Prod. 78, 2332–2338. https://doi.org/10.1021/acs.jnatprod.5b00135
Zhao, Y.-M., Zhang, M.-L., Shi, Q.-W., Kiyota, H., 2006. Chemical constituents of plants from the genus Inula. Chem. Biodivers. 3, 371–384.
SUPPORTING INFORMATION
Validation of UHPLC-DAD analysis method of Chlorogenic acid (CA)
Tab.1 Raw data of Calibration standard Tab.2 Raw data of Validation standard
Fig.1 Response function of Calibration standard (CS). Two points per day for each concentration over three days
Fig.2 Linearity of Validation standard (VS). Three points per day for each concentration over three days.
Fig.3 Accuracy profile of VS at 95% (Risk = 5%) over 5 validation points (50, 75, 100, 125 and 150%)
Validation of UHPLC-DAD analysis method of 1,5-O-Dicaffeoylquinic acid (DCQA)
Tab.3 Raw data of Calibration standard Tab.4 Raw data of Validation standard
Fig.4 Response function of Calibration standard (CS). Two points per day for each concentration over three days.
Fig.5 Linearity of Validation standard (VS). Three points per day for each concentration over three days
Fig.6 Accuracy profile of VS at 95% (Risk = 5%) over 5 validation points (50, 75, 100, 125 and 150%)
Validation of UHPLC-DAD analysis method of Nepetin (NPT)
Tab.5 Raw data of Calibration standard Tab.6 Raw data of Validation standard
Fig.7 Response function of Calibration standard (CS). Two points per day for each concentration over three days.
Fig.8 Linearity of Validation standard (VS). Three points per day for each concentration over three days
Fig.9 Accuracy profile of VS at 95% (Risk = 5%) over 5 validation points (50, 75, 100, 125 and 150%)
Validation of UHPLC-DAD analysis method of Chlorogenic acid (CA) Tab. 1 Raw data of Calibration standard
Level / sample / Day Level Theoretical concentration (mg/mL) Introduced concentration (mg/mL) CA area Results 1.1.1 50% 0.0030 0.0296 232 1.2.1 0.0030 0.0296 238 1.1.2 0.0030 0.0296 234 1.2.2 0.0030 0.0296 241 1.1.3 0.0030 0.0296 243 1.2.3 0.0030 0.0296 244 2.1.1 100% 0.0060 0.0592 482 2.2.1 0.0060 0.0592 488 2.1.2 0.0060 0.0592 484 2.2.2 0.0060 0.0592 497 2.1.3 0.0060 0.0592 494 2.2.3 0.0060 0.0592 497 3.1.1 150% 0.0090 0.0888 724 3.2.1 0.0090 0.0888 732 3.1.2 0.0090 0.0888 733 3.2.2 0.0090 0.0888 739 3.1.3 0.0090 0.0888 755 3.2.3 0.0090 0.0888 745
Tab.2 Raw data of Validation standard Level / sample / Day Level Introduced concentration equivalent content [1] (mg/mL) Results
CA area Inverse prediction Calculated concentration X = Y/a 1.1.1 50% 0.0312 254 0.0304 1.2.1 0.0312 256 0.0307 1.3.1 0.0314 256 0.0305 1.1.2 0.0307 258 0.0312 1.2.2 0.0308 255 0.0308 1.3.2 0.0309 252 0.0303 1.1.3 0.0293 245 0.0305 1.2.3 0.0292 246 0.0308 1.3.3 0.0291 245 0.0306 2.1.1 75% 0.0473 397 0.0471 2.2.1 0.0470 396 0.0473 2.3.1 0.0469 393 0.0470 2.1.2 0.0461 389 0.0472 2.2.2 0.0463 388 0.0468 2.3.2 0.0461 384 0.0467 2.1.3 0.0437 380 0.0475 2.2.3 0.0438 370 0.0463 2.3.3 0.0438 370 0.0463 3.1.1 100% 0.0626 517 0.0617 3.2.1 0.0625 515 0.0616 3.3.1 0.0625 513 0.0614 3.1.2 0.0616 513 0.0621 3.2.2 0.0614 493 0.0597 3.3.2 0.0616 497 0.0601 3.1.3 0.0584 505 0.0630 3.2.3 0.0583 489 0.0611 3.3.3 0.0586 486 0.0606
Level / sample / Day Level Introduced concentration equivalent content [1] (mg/mL) Results CA area Inverse prediction Calculated concentration X = Y/a 4.1.1 125% 0.0781 635 0.0757 4.2.1 0.0781 615 0.0733 4.3.1 0.0782 626 0.0746 4.1.2 0.0768 626 0.0758 4.2.2 0.0768 615 0.0744 4.3.2 0.0767 616 0.0746 4.1.3 0.0728 594 0.0744 4.2.3 0.0729 602 0.0752 4.3.3 0.0731 592 0.0739 5.1.1 150% 0.0940 749 0.0891 5.2.1 0.0936 747 0.0893 5.3.1 0.0939 733 0.0873 5.1.2 0.0921 740 0.0896 5.2.2 0.0922 735 0.0890 5.3.2 0.0923 732 0.0885 5.1.3 0.0874 721 0.0902 5.2.3 0.0875 704 0.0880 5.3.3 0.0875 713 0.0892
1: Constituent Equivalent (mg/ml) : calculated using the mean of Chlorogenic acid content calculated on the
corresponding day :
Day 1: IMFLF151 contains: 0.624 % Chlorogenic acid, Day 2: IMFLF151 contains: 0.614 % Chlorogenic acid, Day 3: IMFLF151 contains: 0.582 % Chlorogenic acid.
Fig.1 Response function of Calibration standard (CS). Two points per day for each concentration over three days
Fig.2 Linearity of Validation standard (VS). Three points per day for each concentration over three days. 0 100 200 300 400 500 600 700 800 0,02 0,03 0,04 0,05 0,06 0,07 0,08 0,09 0,10 A re a Concentration (mg.ml-1) Day 1 Day 2 Day 3 0,02 0,03 0,04 0,05 0,06 0,07 0,08 0,09 0,10 0,02 0,04 0,06 0,08 0,10 C al cu la te d co nc en tr at io n (m g. m l -1) Introduced concentration (mg.ml-1) L I N E A R I T Y O F V S . D AY 1 . 0,02 0,03 0,04 0,05 0,06 0,07 0,08 0,09 0,10 0,02 0,04 0,06 0,08 0,10 C al cu la te d co nc en tr at io n (m g. m l -1) Introduced concentration (mg.ml-1) L I N E A R I T Y O F V S . D AY 2 .
Fig.3 Accuracy profile of VS at 95% (Risk = 5%) over 5 validation points (50, 75, 100, 125 and 150%) 0,02 0,03 0,04 0,05 0,06 0,07 0,08 0,09 0,10 0,02 0,04 0,06 0,08 0,10 C al cu la te d co nc en tr at io n (m g. m l -1) Introduced concentration (mg.ml-1) L I N E A R I T Y O F V S . D AY 3 . -5 -4 -3 -2 -1 0 1 2 3 4 5 50 70 90 110 130 150 AC C UR AC Y PR OFI L E AT 95% (RI SK = 5% )
Validation of UHPLC-DAD analysis method of 1,5-O-Dicaffeoylquinic acid (DCQA) Tab.3 Raw data of Calibration standard
Level / sample / Day Level Theoretical concentration (mg/mL) Introduced concentration (mg/mL) DCQA area Results 1.1.1 50% 0.0652 0.0652 600 1.2.1 0.0652 0.0652 593 1.1.2 0.0652 0.0652 569 1.2.2 0.0652 0.0652 568 1.1.3 0.0652 0.0652 597 1.2.3 0.0652 0.0652 567 2.1.1 100% 0.1304 0.1304 1212 2.2.1 0.1304 0.1304 1231 2.1.2 0.1304 0.1304 1196 2.2.2 0.1304 0.1304 1164 2.1.3 0.1304 0.1304 1195 2.2.3 0.1304 0.1304 1170 3.1.1 150% 0.1956 0.1956 1838 3.2.1 0.1956 0.1956 1815 3.1.2 0.1956 0.1956 1784 3.2.2 0.1956 0.1956 1792 3.1.3 0.1956 0.1956 1799 3.2.3 0.1956 0.1956 1756
Tab.4 Raw data of Validation standard Level / sample / Day Level Introduced concentration equivalent content [2] (mg/mL) Results DCQA area Inverse prediction Calculated concentration X = Y/a 1.1.1 50% 0.0734 691 0.0729 1.2.1 0.0732 694 0.0734 1.3.1 0.0737 669 0.0702 1.1.2 0.0715 671 0.0737 1.2.2 0.0717 646 0.0706 1.3.2 0.0718 648 0.0707 1.1.3 0.0709 652 0.0722 1.2.3 0.0707 658 0.0731 1.3.3 0.0705 632 0.0704 2.1.1 75% 0.1112 1051 0.1099 2.2.1 0.1105 1059 0.1114 2.3.1 0.1102 1015 0.1070 2.1.2 0.1072 989 0.1085 2.2.2 0.1077 981 0.1073 2.3.2 0.1071 971 0.1068 2.1.3 0.1059 973 0.1083 2.2.3 0.1060 975 0.1083 2.3.3 0.1061 974 0.1082 3.1.1 100% 0.1472 1376 0.1447 3.2.1 0.1470 1366 0.1439 3.3.1 0.1469 1351 0.1424 3.1.2 0.1432 1362 0.1491 3.2.2 0.1429 1305 0.1433 3.3.2 0.1431 1307 0.1432 3.1.3 0.1416 1325 0.1470 3.2.3 0.1413 1322 0.1469 3.3.3 0.1419 1271 0.1408
Level / sample / Day Level Introduced concentration equivalent content [2] (mg/mL) Results DCQA area Inverse prediction Calculated concentration X = Y/a 4.1.1 125% 0.1837 1717 0.1807 4.2.1 0.1837 1712 0.1802 4.3.1 0.1838 1666 0.1751 4.1.2 0.1785 1670 0.1831 4.2.2 0.1787 1641 0.1798 4.3.2 0.1784 1638 0.1798 4.1.3 0.1763 1570 0.1747 4.2.3 0.1766 1648 0.1829 4.3.3 0.1771 1592 0.1763 5.1.1 150% 0.2210 2056 0.2158 5.2.1 0.2201 2035 0.2145 5.3.1 0.2207 2004 0.2106 5.1.2 0.2142 1995 0.2188 5.2.2 0.2143 1924 0.2110 5.3.2 0.2146 1934 0.2119 5.1.3 0.2118 1945 0.2162 5.2.3 0.2119 1925 0.2139 5.3.3 0.2119 1954 0.2169
2: Constituent Equivalent (mg/ml) : calculated using the mean of 1,5-O-Dicaffeoylquinic acid content calculated on
the corresponding day :
Day 1: IMFLF151 contains: 1.468 % 1,5-O-Dicaffeoylquinic acid, Day 2: IMFLF151 contains: 1.427 % 1,5-O-Dicaffeoylquinic acid, Day 3: IMFLF151 contains: 1.411 % 1,5-O-Dicaffeoylquinic acid.
Fig.4 Response function of Calibration standard (CS). Two points per day for each concentration over three days.
Fig.5 Linearity of Validation standard (VS). Three points per day for each concentration over three days 0 200 400 600 800 1000 1200 1400 1600 1800 2000 0,05 0,10 0,15 0,20 0,25 A re a Concentration (mg.ml-1) Day 1 Day 2 Day 3 0,05 0,07 0,09 0,11 0,13 0,15 0,17 0,19 0,21 0,23 0,25 0,05 0,10 0,15 0,20 0,25 C al cu la te d co nc en tr at io n (m g. m l -1) Introduced concentration (mg.ml-1) L I N E A R I T Y O F V S . D AY 1 . 0,05 0,07 0,09 0,11 0,13 0,15 0,17 0,19 0,21 0,23 0,05 0,10 0,15 0,20 0,25 C al cu la te d co nc en tr at io n (m g. m l-1) Introduced concentration (mg.ml-1) L I N E A R I T Y O F V S . D AY 2 .
Fig.6 Accuracy profile of VS at 95% (Risk = 5%) over 5 validation points (50, 75, 100, 125 and 150%) 0,05 0,07 0,09 0,11 0,13 0,15 0,17 0,19 0,21 0,23 0,05 0,10 0,15 0,20 0,25 C al cu la te d co nc en tr at io n (m g. m l -1) Introduced concentration (mg.ml-1) L I N E A R I T Y O F V S . D AY 3 . -5 -4 -3 -2 -1 0 1 2 3 4 5 50 70 90 110 130 150
A CCUR ACY PROFI L E AT 95% (RI SK = 5% )
Validation of UHPLC-DAD analysis method of Nepetin (NPT) Tab.5 Raw data of Calibration standard
Level / sample / Day Level Theoretical concentration (mg/mL) Introduced concentration (mg/mL) NPT area Results 1.1.1 50% 0.0120 0.0136 126 1.2.1 0.0120 0.0136 128 1.1.2 0.0120 0.0136 125 1.2.2 0.0120 0.0136 130 1.1.3 0.0120 0.0136 127 1.2.3 0.0120 0.0136 126 2.1.1 100% 0.0240 0.0273 257 2.2.1 0.0240 0.0273 265 2.1.2 0.0240 0.0273 261 2.2.2 0.0240 0.0273 264 2.1.3 0.0240 0.0273 260 2.2.3 0.0240 0.0273 265 3.1.1 150% 0.0360 0.0409 395 3.2.1 0.0360 0.0409 399 3.1.2 0.0360 0.0409 400 3.2.2 0.0360 0.0409 404 3.1.3 0.0360 0.0409 405 3.2.3 0.0360 0.0409 398
Tab.6 Raw data of Validation standard Level / sample / Day Level Introduced concentration equivalent content [3] (mg/mL) Results NPT area Inverse prediction Calculated concentration X = Y/a 1.1.1 50% 0.0106 100 0.0105 1.2.1 0.0106 101 0.0106 1.3.1 0.0107 99 0.0103 1.1.2 0.0104 102 0.0108 1.2.2 0.0104 99 0.0105 1.3.2 0.0104 101 0.0106 1.1.3 0.0106 98 0.0103 1.2.3 0.0105 100 0.0105 1.3.3 0.0105 100 0.0105 2.1.1 75% 0.0161 155 0.0161 2.2.1 0.0160 152 0.0158 2.3.1 0.0160 149 0.0156 2.1.2 0.0155 151 0.0160 2.2.2 0.0156 148 0.0156 2.3.2 0.0155 149 0.0158 2.1.3 0.0158 148 0.0155 2.2.3 0.0158 150 0.0157 2.3.3 0.0158 156 0.0163 3.1.1 100% 0.0214 207 0.0216 3.2.1 0.0213 196 0.0205 3.3.1 0.0213 200 0.0209 3.1.2 0.0207 198 0.0210 3.2.2 0.0207 197 0.0210 3.3.2 0.0207 200 0.0212 3.1.3 0.0211 195 0.0204 3.2.3 0.0210 205 0.0215 3.3.3 0.0211 204 0.0212
Level / sample / Day Level Introduced concentration equivalent content [3] (mg/mL) Results NPT area Inverse prediction Calculated concentration X = Y/a 4.1.1 125% 0.0266 253 0.0264 4.2.1 0.0266 255 0.0267 4.3.1 0.0267 250 0.0261 4.1.2 0.0259 247 0.0262 4.2.2 0.0259 245 0.0260 4.3.2 0.0258 244 0.0259 4.1.3 0.0262 248 0.0260 4.2.3 0.0263 258 0.0270 4.3.3 0.0263 259 0.0270 5.1.1 150% 0.0321 304 0.0317 5.2.1 0.0319 303 0.0317 5.3.1 0.0320 299 0.0311 5.1.2 0.0310 300 0.0319 5.2.2 0.0310 294 0.0312 5.3.2 0.0311 292 0.0310 5.1.3 0.0315 300 0.0314 5.2.3 0.0315 296 0.0310 5.3.3 0.0315 300 0.0314
3: Constituent Equivalent (mg/ml) : calculated using the mean of Nepetin content calculated on the corresponding
day :
Day 1: IMFLF151 contains: 0.213 % Nepetin, Day 2: IMFLF151 contains: 0.207 % Nepetin, Day 3: IMFLF151 contains: 0.210 % Nepetin.
Fig.7 Response function of Calibration standard (CS). Two points per day for each concentration over three days.
Fig.8 Linearity of Validation standard (VS). Three points per day for each concentration over three days 0 50 100 150 200 250 300 350 400 450 0,01 0,02 0,02 0,03 0,03 0,04 0,04 0,05 A re a Concentration (mg.ml-1) Day 1 Day 2 Day 3 0,01 0,02 0,02 0,03 0,03 0,04 0,01 0,02 0,02 0,03 0,03 0,04 C al cu la te d co nc en tr at io n (m g. m l -1) Introduced concentration (mg.ml-1) L I N E A R I T Y O F V S . D AY 1 . 0,01 0,02 0,02 0,03 0,03 0,04 0,01 0,02 0,02 0,03 0,03 0,04 C al cu la te d co nc en tr at io n (m g. m l -1) Introduced concentration (mg.ml-1) L I N E A R I T Y O F V S . D AY 2 .

![Table 2 Spectroscopic data of compounds of the extract L2E analyzed by UHPLC-DAD-ESI-MS/MS Cmpd n o R t (min) λ max (nm) [M+H] + (m/z) MS/MS (m/z) Identification 1 2.8 240-326 355 185-215 Chlorogenic acid 4 8.2 242-328 517 - 3,5-O-Dic](https://thumb-eu.123doks.com/thumbv2/123doknet/13696905.432948/14.892.93.796.116.540/table-spectroscopic-compounds-extract-analyzed-uhplc-identification-chlorogenic.webp)