HAL Id: cea-02016831
https://hal-cea.archives-ouvertes.fr/cea-02016831
Submitted on 12 Feb 2019
HAL is a multi-disciplinary open access
archive for the deposit and dissemination of
sci-entific research documents, whether they are
pub-lished or not. The documents may come from
teaching and research institutions in France or
abroad, or from public or private research centers.
L’archive ouverte pluridisciplinaire HAL, est
destinée au dépôt et à la diffusion de documents
scientifiques de niveau recherche, publiés ou non,
émanant des établissements d’enseignement et de
recherche français ou étrangers, des laboratoires
publics ou privés.
Heritability of surface area and cortical thickness: a
comparison between the Human Connectome Project
and the UK Biobank dataset
Yann Le Guen, Slim Karkar, Antoine Grigis, Cathy Philippe, Jean-François
Mangin, Vincent Frouin
To cite this version:
Yann Le Guen, Slim Karkar, Antoine Grigis, Cathy Philippe, Jean-François Mangin, et al..
Heri-tability of surface area and cortical thickness: a comparison between the Human Connectome Project
and the UK Biobank dataset. ISBI 2019 - Proceedings of the IEEE International Symposium on
Biomedical Imaging, 2019, Venice, Italy. �cea-02016831�
Heritability of surface area and cortical thickness: a comparison between
the Human Connectome Project and the UK Biobank dataset
Yann Le Guen
a, Slim Karkar
a, Antoine Grigis
a, Cathy Philippe
a, Jean-François Mangin
a, Vincent Frouin
a,baNeurospin, Institut Joliot, CEA, Université Paris-Saclay, Gif-sur-Yvette, France. bvincent.frouin@cea.fr
ABSTRACT
Heritability of the regional thickness/surface in human cortex is established. Yet the estimates vary substantially depending on cohorts or the information they are derived from: pedigree or genotyping. Here we present three heritability studies of the cortex phenotype in two cohorts showing: i) both pedigree and genotyping or ii) genotyping only. We obtained clearly correlated heritability values between studies with a shift appearing between cohorts. Spatial pattern of heritability remains highly consistent across cohorts
Index Terms— imaging-genetic, heritability, cortical
thickness, surface area
1. INTRODUCTION
The heritability of the cortical features from structural MRI have been extensively reported in the literature [1]–[5]. In this work, we proposed to benchmark the heritability of two common cortical features, namely the surface area and cortical thickness, in the two largest cohorts currently available: the Human Connectome Project (HCP) and the UK Biobank. These two features have been shown to have low genetic correlation [4] and thus provide complementary information on the underlying genetic which shapes the human brain cortex. We noticed that estimates reported by pedigree studies were constantly higher than the ones reported by population of unrelated individuals [1], [6]. In this study, we replicated this observation and attempted to rule out the hypotheses that these discrepancies are due to: (i) the lack of information in genotyped common variants, (ii) the un-modelled common environment. Additionally, we also discussed the genotype and age interaction which has been shown to affect heritability estimates [7].
2. MATERIAL AND METHODS 2.1. Subjects, MRI Acquisition, Genetic Information
2.1.1. Human Connectome Project data
In this work, we used data from the HCP, details are available in the HCP reference manual S1200. In our analysis, we included 820 subjects (383/437 M/F), labelled as Caucasian with 69 individuals from the Hispanic ethnicity. The pedigree is composed of 191 twin pairs (127 monozygotic with 123 siblings, and 64 dizygotic with 64 siblings and 1 half sibling), 190 siblings, 1 half sibling and 59 unpaired individuals, aged
between 22 and 36 years old (µ ± σ = 29.0 ± 3.6 years). Unpaired individuals did not contribute to the genetic parameter estimation but allowed for a more accurate estimation of mean and variance effects. MR images were acquired by using a Siemens 3T scanner housed at Washington University in St Louis, using MPRAGE and SPACE sequences for respectively T1 and T2 weighted images which both have a 0.7 mm isotropic resolution. Genotyping data of HCP subjects were obtained under dbGaP appl. #17771 (dbGaP Study Accession: phs001364.v1.p1).
2.1.2. UK Biobank project data
The present analyses were conducted under UK Biobank data appl. #25251. The UK Biobank is a health research resource that aims to improve the prevention, diagnosis and treatment of a wide range of illnesses. Between the years 2006 and 2010, about 500,000 people aged between 45 and 73 years old, were recruited in the general population across Great Britain. In this work, we used the data released on January 2018, consisting of 20,060 subjects with a T1-weighted MRI. The UK Biobank genetic data underwent a stringent quality control protocol, which was performed at the Wellcome Trust Centre for Human Genetics [8]. We restrained our analysis to people identified by UK Biobank as belonging to the main white British ancestry subset. Additionally, we excluded from our analysis subjects with high missingness, high heterozygosity, first degree related individuals or sex mismatches. 14,538 subjects passed the genotyped and imaging quality control protocols, and were identified as belonging to the British ancestry.
2.2. Image processing
We used the T1w and T2w volumes, preprocessed by the HCP, from each individual subject’s MR data as inputs of the HCP Freesurfer pipeline, which is based on Freesurfer (v.5.3.0) with a number of enhancements specifically designed to capitalize on HCP data.
We used the T1w volumes, preprocessed by the UK Biobank, from each individual subject’s MR data as inputs of the Freesurfer pipeline (v. 6.0.0).
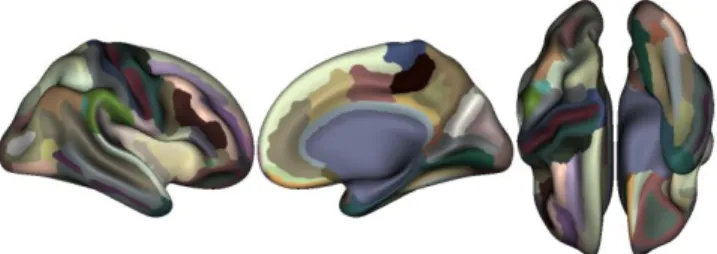
For both cohorts, we extracted the cortical thickness and surface measures for each region of interest (ROI) of the Destrieux atlas (files ?h.aparc.a2009s.annot) [9]. This atlas contains 74 areas per hemisphere and displayed on Fig.1. To correct for multiple comparisons, our significance threshold for the p-value associated to our heritability
estimate is p < 0.05 / (74×2×2) ≈ 1.7·10-4 (Bonferroni
correction, nb areals×nb hemispheres×nb features).
Figure 1. Destrieux brain atlas parcellation.
2.4. Heritability computation
We used two different ways to estimate the heritability based on the two types of genetic information. The first one uses the pedigree information in the HCP cohort and the second one uses the genotyped information from common genetic variants in the HCP and UK Biobank.
The variance components method, as implemented in the
Sequential Oligogenic Linkage Analysis Routines (SOLAR)
[10], was used for the heritability estimations of the features namely the average cortical thickness. The covariance matrix Ω for a pedigree of individuals is given by: Ω = 2·Φ·σg² + I·
σe², where σg² is the genetic variance due to the additive
genetic factors, Φ is the kinship matrix representing the pair-wise kinship coefficients among all individuals, σe² is the
variance due to individual-specific environmental effects, and I is the identity matrix, assuming all environmental effects are uncorrelated among family members. Narrow sense heritability is defined as the fraction of the phenotype variance σp² attributable to additive genetic factors: h² = σg²/
σp². Significance of the heritability is tested by comparing the
likelihood of the model in which σg² is constrained to zero
with the one of a model in which σg² is estimated. Before
testing for the significance of heritability, phenotypes values for each individual within the HCP cohort were adjusted for the following covariates: sex, age, age², age×sex interaction, age²×sex interaction. Inverse Gaussian transformation was also applied to ensure normality of the measurements. An additional variance parameter can be added to model the effect of common environment, which is associated with any non-genetic factors shared between the individuals like living in the same household. In this case, the covariance matrix can be written as: Ω = 2·Φ·σg² + H· σc² + I· σe², where H is the
structuring matrix for σc², the variance due to common
environment effects. H contains zeros and ones depending upon whether a pair of individual shares the same household. The household information is not directly available in HCP data. Thus, we assumed that two individuals share the same household if they have the same family id. We force the common environment to remain in the estimated model using -keephouse SOLAR option.
To estimate the heritability from the single nucleotide polymorphisms (SNPs) genotyped information, we used the
Genome Complex Trait Analysis (GCTA) method [11].
In the UK Biobank, we considered the genotyped SNPs variants common to the UKBiobank and UKBileve arrays (details at http://www.ukbiobank.ac.uk). In order to compute the kinship matrix of the population, specific SNPs were selected with PLINK v1.9 [12] with: missing genotype = 5% (70,783 variants excluded), Hardy-Weinberg equilibrium test (hwe) = 10-6 (11,318), and minor allele frequency (maf) = 1%
(102,559). We kept the SNPs in moderate linkage disequilibrium with variation inflation factor 10 within a window of 50 SNPs (92,081 variants excluded). Then, we computed the genetic relationship matrix with GCTA using the 507,515 SNPs left. The amount of phenotypic variance captured by this matrix is estimated using a mixed-effects linear model. As covariates, we included the gender, the genotyping array type, the age at the MRI session and the 10 genetic principal components provided by UK Biobank to account for population stratification.
Similarly for the HCP cohort, we considered the genotyped SNPs variants from the Infinium Multi-Ethnic Genotyping array (2,052,643 variants). Using the same filtering procedure with PLINK 705,738 SNPs remained to build the relationship matrix. As covariates, we included the gender, age, a dummy covariate for ethnicity and 5 genetic principal components, that we computed using multidimensional scaling with PLINK. Higher order components accounted for family structures and were thus not included. Note that GCTA usually recommends excluding related individuals in the analysis, however in our case there were not enough individuals remaining. The GCTA estimates in HCP should therefore be taken with caution.
In short, heritability was estimated three times in HCP from pedigree with SOLAR accounting or not for common environment and from the genotyping data with GCTA. As regards the UK Biobank, the heritability is computed only from the genotyping data with GCTA.
3. RESULTS AND DISCUSSION
We estimated the heritability of cortical features obtained from the standard outputs of Freesurfer. First, we used popular methods in the imaging genetics community to compute these estimates [1]. However, we noted a discrepancy between the heritability estimates obtained using the HCP/pedigree and UK Biobank/genotyping for both surface area and cortical thickness (Fig. 2). We observe constantly higher estimates in HCP compare to the UK Biobank lead us to believe that there is either a bias in one of the analysis or environmental conditions differ drastically. Note that heritability is not an absolute measure and is specific to a particular population and environment.
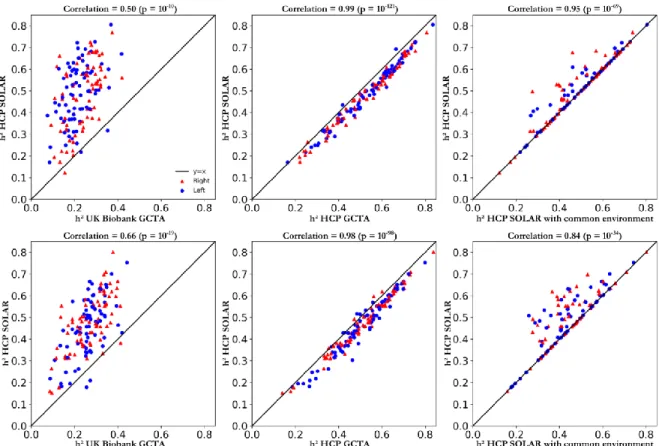
Second, we investigated if using the GCTA method on HCP/genotyping, which estimates the relationship matrix based on common variants information, would result in smaller estimates due to the missing information about rare variants difference among individual. Yet, the heritability estimates obtained with HCP/genotyping almost equal to the
ones computed with HCP/pedigree. The estimates obtained with GCTA were slightly higher than the ones with SOLAR (Fig 3., 2nd column). We hypothesized that it might be
because the genetic relationship coefficient is more accurate when estimated with genotyping information. For example, siblings shares on average 50% and thus have ½ value in the relationship matrix used by SOLAR. The GCTA kinship estimation allows to estimate if this coefficient is higher (eg: 52%) or lower (eg: 48%) than this a priori coefficient.
Third, when we modelled the shared environment in HCP the heritability estimates remained highly similar to the ones without taking into account the common household (Fig 3.,
3rd column).
For the surface area: in the HCP the heritability values range from 0.15 to 0.80, and an average of 0.46; in UK Biobank from 0.08 to 0.44, and an average of 0.26 (Fig. 2 a, b). For the average cortical thickness: in the HCP the heritability values range from 0.12 to 0.80, and an average of 0.48; and in UK Biobank from 0.05 to 0.42, and an average of 0.22 (Fig. 2 c, d). Thus, the heritability estimates in HCP tends to be more than 20% higher than the ones in the UK Biobank on average. However, there is strong a correlation between the estimates obtained in the two cohorts (Fig 3, 1st
column), which lead us to be confident in the overall regional
pattern of heritability.
We know that these brain features are highly dependent on age with a widening of the cortical sulci and thinning of grey matter thickness over time [13]. Thus, there might be an effect that reduces the heritability. We accounted for the age as covariate but its effect on the brain is likely to result from complex interaction with genome [7]. Additionally, we observed that the phenotypic variance for the cortical thickness increases with age. Thus, because the effect of the genes×age are likely non additive and that the phenotypic variance increases, the heritability values computed in a senior cohort (µ = 62.6 years old) are lower than in a young adult cohort (µ = 29.0 years old).
4. CONCLUSION
This work emphasizes that heritability estimates computed based on a priori genetic relationship or genotyping material are consistent. The discrepancy between heritability computed from HCP and UK Biobank cohorts might be due to genes×age interactions not taken into account by the heritability, which only measures the additive genetic effects. Age-related gray matter shrinkage in the UK Biobank, not present in the mid-20 HCP cohort, may further reduce the heritability estimates. Finally, it is important to note that the pattern of heritability remains consistent across cohorts.
Figure 2(a) Heritability of the surface area estimated with SOLAR in the HCP cohort. (b) Heritability of the surface area estimated with GCTA in the UK Biobank cohort. (c) and (d) equivalent of (a) and (b) respectively for the heritability estimates of the average cortical thickness. All displayed estimates are Bonferroni corrected (p < 1.7·10-4).
Figure 3. 1st line: Surface area Comparison of heritability estimates obtained with SOLAR on HCP and the ones obtained: (i) wtih GCTA on UK Biobank (p < 0.05 corrected), (ii) with GCTA on HCP (p < 0.05 corrected), (iii) with SOLAR on HCP trying to model the shared environment between subjects (p < 0.05 uncorrected). 2nd line: Cortical thickness average same comparisons as for the 1st line.
5. ACKNOWLEDGMENTS
Data were provided by the HCP, funded by the 16 NIH Institutes and Centers that support the NIH Blueprint for Neuroscience Research; and by the McDonnell Center for Systems Neuroscience at Washington University. This project has received funding from the European Union’s Horizon 2020 Research and Innovation Program under Grant Agreements No. 720270 (HBPSGA1) and No. 785907 (HBPSGA2). It was supported by the CEA DRF Impulsion program (SRAVS project 2017, P.I. Vincent Frouin).
6. REFERENCES
[1] E. Hofer et al., “Genetic Determinants of Cortical Structure (Thickness, Surface Area and Volumes) among Disease Free Adults in the CHARGE Consortium,” bioRxiv, 2018. [2] Y. Le Guen et al., “Genetic Influence on the Sulcal Pits: On
the Origin of the First Cortical Folds,” Cereb. Cortex, vol. 28, no. 6, pp. 1922–1933, Jun. 2018.
[3] A. M. Winkler et al., “Cortical thickness or grey matter volume? The importance of selecting the phenotype for imaging genetics studies,” Neuroimage, vol. 53, no. 3, pp. 1135–1146, 2010.
[4] M. S. Panizzon et al., “Distinct genetic influences on cortical surface area and cortical thickness,” Cereb. Cortex, vol. 19, no. 11, pp. 2728–2735, 2009.
[5] L. T. Elliott et al., “Genome-wide association studies of brain imaging phenotypes in UK Biobank,” Nature, vol. 562, no. 7726, pp. 210–216, Oct. 2018.
[6] S. J. van der Lee et al., “Gray matter heritability in family-based and population-family-based studies using voxel-family-based morphometry,” Hum. Brain Mapp., vol. 38, no. 5, pp. 2408– 2423, 2017.
[7] F. Chouinard-Decorte et al., “Heritable changes in regional cortical thickness with age,” Brain Imaging Behav., vol. 8, no. 2, pp. 208–216, 2014.
[8] C. Bycroft et al., “Genome-wide genetic data on ~500,000 UK Biobank participants,” bioRxiv, 2017.
[9] C. Destrieux et al., “Automatic parcellation of human cortical gyri and sulci using standard anatomical
nomenclature,” Neuroimage, vol. 53, no. 1, pp. 1–15, 2010. [10] L. Almasy et al., “Multipoint Quantitative-Trait Linkage
Analysis in General Pedigrees,” Am. J. Hum. Genet., vol. 62, no. 5, pp. 1198–211, 1998.
[11] J. Yang et al., “GCTA: A Tool for Genome-wide Complex Trait Analysis,” Am. J. Hum. Genet., vol. 88, no. 1, pp. 76– 82, 2011.
[12] S. Purcell et al., “PLINK: A Tool Set for Whole-Genome Association and Population-Based Linkage Analyses,” Am.
J. Hum. Genet., vol. 81, no. 3, pp. 559–575, 2007.
[13] Y. Le Guen et al., “eQTL of KCNK2 regionally influences the brain sulcal widening: evidence from 15,597 UK Biobank participants with neuroimaging data,” Brain Struct.