HAL Id: hal-01193529
https://hal.archives-ouvertes.fr/hal-01193529
Submitted on 30 May 2020
HAL is a multi-disciplinary open access
archive for the deposit and dissemination of
sci-entific research documents, whether they are
pub-lished or not. The documents may come from
teaching and research institutions in France or
abroad, or from public or private research centers.
L’archive ouverte pluridisciplinaire HAL, est
destinée au dépôt et à la diffusion de documents
scientifiques de niveau recherche, publiés ou non,
émanant des établissements d’enseignement et de
recherche français ou étrangers, des laboratoires
publics ou privés.
Vietnamese chickens: a gate towards Asian genetic
diversity
Cecile Berthouly, Xavier Rognon, T. Nhu Van, M. Gély, C. Vu Chi, Michèle
Tixier-Boichard, Bertrand Bed’Hom, Nicolas Bruneau, Etienne Verrier, J.C.
Maillard, et al.
To cite this version:
Cecile Berthouly, Xavier Rognon, T. Nhu Van, M. Gély, C. Vu Chi, et al.. Vietnamese chickens: a
gate towards Asian genetic diversity. BMC Genetics, BioMed Central, 2010, 11, online (june), Non
paginé. �10.1186/1471-2156-11-53�. �hal-01193529�
Berthouly-Salazar et al. BMC Genetics 2010, 11:53 http://www.biomedcentral.com/1471-2156/11/53
Open Access
R E S E A R C H A R T I C L E
© 2010 Berthouly-Salazar et al; licensee BioMed Central Ltd. This is an Open Access article distributed under the terms of the Creative Commons Attribution License (http://creativecommons.org/licenses/by/2.0), which permits unrestricted use, distribution, and repro-duction in any medium, provided the original work is properly cited.
Research article
Vietnamese chickens: a gate towards Asian genetic
diversity
C Berthouly-Salazar*
1,6, X Rognon
2,3, T Nhu Van
4, M Gély
1, C Vu Chi
4, M Tixier-Boichard
3, B Bed'Hom
3, N Bruneau
3,
E Verrier
2,3, JC Maillard
1and JR Michaux
5,6Abstract
Background: Chickens represent an important animal genetic resource and the conservation of local breeds is an
issue for the preservation of this resource. The genetic diversity of a breed is mainly evaluated through its nuclear diversity. However, nuclear genetic diversity does not provide the same information as mitochondrial genetic diversity. For the species Gallus gallus, at least 8 maternal lineages have been identified. While breeds distributed westward from the Indian subcontinent usually share haplotypes from 1 to 2 haplogroups, Southeast Asian breeds exhibit all the haplogroups. The Vietnamese Ha Giang (HG) chicken has been shown to exhibit a very high nuclear diversity but also important rates of admixture with wild relatives. Its geographical position, within one of the chicken domestication centres ranging from Thailand to the Chinese Yunnan province, increases the probability of observing a very high genetic diversity for maternal lineages, and in a way, improving our understanding of the chicken domestication process.
Results: A total of 106 sequences from Vietnamese HG chickens were first compared to the sequences of published
Chinese breeds. The 25 haplotypes observed in the Vietnamese HG population belonged to six previously published haplogroups which are: A, B, C, D, F and G. On average, breeds from the Chinese Yunnan province carried haplotypes from 4.3 haplogroups. For the HG population, haplogroup diversity is found at both the province and the village level (0.69).
The AMOVA results show that genetic diversity occurred within the breeds rather than between breeds or provinces. Regarding the global structure of the mtDNA diversity per population, a characteristic of the HG population was the occurrence of similar pattern distribution as compared to G. gallus spadiceus. However, there was no geographical evidence of gene flow between wild and domestic populations as observed when microsatellites were used.
Conclusions: In contrast to other chicken populations, the HG chicken population showed very high genetic diversity
at both the nuclear and mitochondrial levels. Due to its past and recent history, this population accumulates a specific and rich gene pool highlighting its interest and the need for conservation.
Background
Chickens represent an important protein source for humans, as shown by a strong increase of poultry produc-tion around the world (USDA Foreign Agricultural Ser-vice - November 2005). Local populations contribute more specifically, to family poultry production, which is quite important for low income farmers from Africa, Asia, Latin America and the South Pacific. These local
populations that are easy to raise, are resilient to harsh environmental conditions and may harbour original fea-tures of disease resistance [1]. Within this framework, chicken genetic resources have been well investigated during the last decade [2-5] using microsatellite data. Surprisingly, the number and location of chicken domes-tication centres are not completely clarified. The first genetic study on mtDNA suggested that the Indochinese Red Junglefowl subspecies Gallus gallus gallus is the pri-mary maternal ancestor of the domestic chicken (Gallus gallus domesticus; [6]). Liu et al. [7] showed that at least three subspecies of G. gallus were enrolled in the origin of
* Correspondence: c.berthouly@gmail.com
1 CIRAD, UPR AGIRS, Campus International de Baillarguet, F-34398 Montpellier, France
Berthouly-Salazar et al. BMC Genetics 2010, 11:53 http://www.biomedcentral.com/1471-2156/11/53
Page 2 of 11
domestic chicken breeds, but also that there may be at least two domestication centres: one in Southeast Asia (South China, Vietnam, Myanmar and Thailand) and one in the Indian subcontinent. Furthermore, in a recent study, Errikson et al. [8] highlighted the hybrid origin of the domestic chicken, due to ancestral hybridisation involving the Grey Junglefowl (G. sonneratii).
Liu et al. [7] performed the widest study, involving 900 wild and domestic chickens, and found a total of 9 haplo-groups to which we will always refer in this study. According to this classification, 6 to 9 haplogroups have been observed in Southeast and East Asia [7,9,10]. Some of these are localised in specific regions. For example, haplogroup C was mainly found in Japanese breeds while haplogroups G and F were found in chickens from the Chinese Yunnan province. In European, Middle-Eastern and Indian chicken breeds, 3 main haplogroups (A, B and E) have been observed [7,11]. In Latin-America, and more precisely Chile, chickens also carry the A, B and E haplogroups. The route for introduction of haplogroups A and B is still open to discussion [12,13]. In African chickens, only two haplogroups, D and E, were found [14]. The heterogeneous distribution of mitochondrial lineages implies that breeds will not carry the same genetic diversity from a maternal gene pool point of view. On the basis of microsatellite information, African and Asian local chicken populations showed high genetic diversity [3,5,4,11]. It is interesting to note that by con-serving such local breeds an important part of the gene pool is assumed to be conserved according to microsatel-lite data. However depending on the commercial exchange, human migration history and geographic area, just a few or on the contrary almost all the maternal lin-eages will be conserved. Therefore, it is important to have a global view (i.e. mtDNA and microsatellites) of the genetic make-up of chicken breeds as much as possible.
In a previous analysis, we demonstrated that the local population of Vietnamese chickens, namely the H'mong chicken, showed a high genetic diversity and could not be subdivided into subpopulations [15]. This population showed almost all possible phenotypes such as silky feathers as well as frizzled plumage. The only phenotype not observed was the naked neck (Na gene) (personal observation). In addition, we highlighted that admixture may occur between wild and domestic chickens in a few localised communes. In this paper, we present a first assessment of mtDNA polymorphism in this local popu-lation. We generated mtDNA control region sequences from 106 H'mong chickens and our wild Red junglefowl samples and compared the results with those already published for the wild Red junglefowl and Asian chicken breeds. Three major questions may be addressed: (1) is the mtDNA genetic diversity as high as the diversity
observed at the nuclear level; (2) how has geographical isolation affected the distribution of mtDNA haplotypes and (3) are there occurrences of admixture between wild and domestic chickens?
Methods Sample collection
Vietnamese chickens originate from the northern Ha Giang province (22°08' - 23°19' N; 104°33' - 105°33' E) bordering the Yunnan Chinese province. The local chicken population from this province was previously considered to belong to the H'mong Black skin chicken. However previous genetic data demonstrated that no breed differentiation and no congruence between the black phenotype and the genetic structure occurred in the province [15]. Therefore, instead of naming this pop-ulation as the H'mong chicken, which for Vietnamese people indicates only animals with the black skin pheno-type, we will refer to it as the Ha Giang (HG) chicken population. According to Berthouly et al. [15], chickens originating from four communes seemed to be admixed with wild junglefowls. We sequenced 68 chickens from these four admixed communes and 38 chickens from six non-admixed communes. Thus, a total of 106 mtDNA D-loop sequences from 40 villages among 10 communes were analysed (Table 1). We also sequenced the 3 wild populations previously studied in Berthouly et al. [15]: two populations of G. g. gallus (Gg2 from Thailand, and Gg3 from Vietnam) and one population of G. g. spadiceus from Thailand (Gg1). Thus, a total of 30 new sequences of Red junglefowl were added.
mtDNA amplification and sequencing
Details on chicken blood collection and DNA extraction were described previously in Berthouly et al. [15]. Laws and regulations regarding the use of animals in scientific research have been followed. The HVS-I sequence was amplified using the same primers and PCR conditions as in Liu et al. [7]. PCR products were sent to MACROGEN (Macrogen Inc., Seoul, Korea) and Eurofins MGW (Ger-many) for sequencing using both forward and reverse strands.
Sequence alignment
Vietnamese samples were compared with 93 wild Gallus gallus, involving 4 subspecies (G. g. gallus, G. g. spadiceus, G. g. jabouillei and G. g.bankiva) and 437 Gallus gallus domesticus (40 Chinese breeds) already analysed by Liu et al. [7]; and downloaded from GenBank database (Addi-tional file 1). The sequences were aligned using BioEdit [16]. The sequences produced during this study were deposited into GenBank (Accession numbers: HM462082-HM462217).
Berthouly-Salazar et al. BMC Genetics 2010, 11:53 http://www.biomedcentral.com/1471-2156/11/53
Page 3 of 11
Analyses
Genetic diversity
The position and number of variable sites as well as the definition of haplotypes were computed with DnaSP 4.9 [17]. Haplotypes found in our samples were compared to haplotypes from Liu et al. [7] and renamed similarly when previously described. New haplotypes specific to the Vietnamese HG population were coded with the hap-logroup name they belong to followed by a "V" (i.e. AV, BV, etc). Haplotype (h) diversity, nucleotide (π) diversity, pairwise differences, and a Minimum Spanning Tree (MST) from Kimura-2 parameter distances (K2P, [18]) between haplotypes were computed using ARLEQUIN 3.1 software [19].
Breed differentiation
In order to investigate the genetic differentiation among the Vietnamese and Chinese breeds (this study and [7]), analysis of molecular variance (AMOVA) and pairwise Kimura-2 parameter distances [18] between breeds were computed using the ARLEQUIN 3.1 software [19]. To visualise the paired genetic distances as plots in a low-dimensional space, multilow-dimensional scaling analysis of
these distance matrices was performed using the statisti-cal program R [20].
Comparison with other published data from Asian and Indian breeds
In order to have a more general view of the distribution of chicken haplogroups, we combined our data with haplo-types published by Oka et al. [9] on Japanese chickens; by Kanginakudru et al. [11] on Indian chickens and G. gallus murghi, with sequences from Sri Lanka chickens pub-lished by Silva et al. [10] and with haplotypes described by Liu et al. [7]. We used version 3.7 of the MODELTEST program ([21]) to estimate which nucleotide substitution model best fitted the observed data according to the Akaike information criterion (AIC) [22]. Applying the model suggested, we performed a Maximum-likelihood (ML) analysis with PhyML [23] and the starting tree was determined by a BioNJ analysis of the data sets (default settings). One thousand bootstrap replicates were per-formed using optimisation options,.
Results & Discussion
For the HG chicken population, we obtained a segment of 506 bp of mtDNA HVS-I sequence. Among the 106 sequences, 33 variables sites were found, involving 36 Table 1: List of Vietnamese communes sampled, diversity measures and geographical distribution of haplogroups within the Ha-Giang province: the number of samples Ni, the haplotype diversity h, the nucleotide diversity π
Ni Nb haplotypes Nb haplo- groups Haplogroups h π
Non admixed communes
103 8 6 3 ABG 0.86 0.010 1 6 5 4 ACFG 0.93 0.019 20 7 5 2 AF 0.90 0.014 2 4 4 2 AB 1.00 0.007 48 8 4 3 ABF 0.75 0.010 61 5 4 3 ABD 0.90 0.014 Admixed communes 40 24 11 5 ABCDF 0.84 0.012 65 9 4 2 AB 0.75 0.008 7 6 6 4 ABFG 1.00 0.018 88 29 11 5 ABCFG 0.86 0.011 Haplogroup (%) A B C D F G
Non admixed communes 38 25 31.6 44.7 2.6 2.6 13.2 7.9
Berthouly-Salazar et al. BMC Genetics 2010, 11:53 http://www.biomedcentral.com/1471-2156/11/53
Page 4 of 11
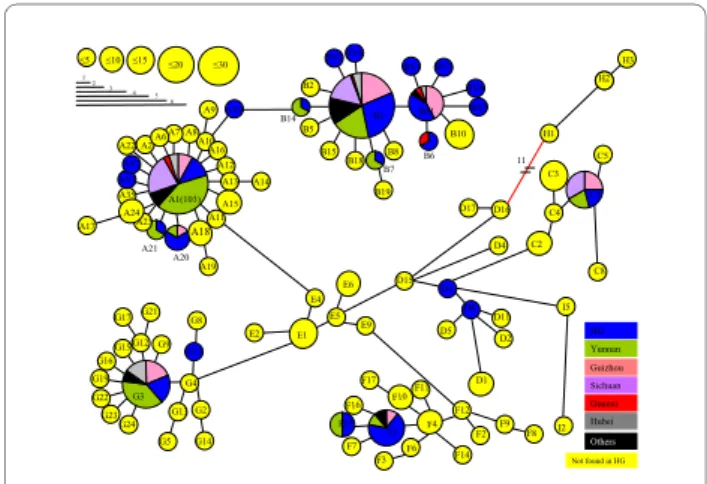
mutational events, which defined 25 haplotypes. All but 6 mutations were transitions. The 25 haplotypes observed belonged to six haplogroups previously found by Liu et al. [7] which are: A, B, C, D, F and G (Figure 1). Three haplo-groups were not encountered in the HG chicken popula-tion, namely I, which has only been observed in three Gallus gallus from Hanoï, H (Indonesia, wild junglefowls with unknown origin, and sequences from the Indian subcontinent) and E (Indian subcontinent, Europe, Latin America and Africa) [7,11-13]. The absence of clade E suggests that this Vietnamese population has not yet been admixed with Indian breeds but most of all it was not admixed with highly productive European breeds.
From our G. g. gallus Gg3 population from Vietnam, 2 haplotypes, G6 and G25 were observed. This corrobo-rates the result from Liu et al. [7], who only observed G6 haplotype in his Vietnamese wild sample. We, found for the first time, haplotypes belonging to clade A (i.e. A1) in a G. gallus gallus population (i.e. Gg2). Haplotypes from clade A were not observed in such a population in previ-ous published studies. In both populations from Thai-land, Gg1 and Gg2, we found three new haplotypes from clade I. Until now, this clade was only represented by 2 haplotypes in samples originating from Vietnam [7]. Thus, clade I has been also evolving in Thailand and not only in Vietnam.
Genetic diversity within and between breeds from Vietnam and China
In the HG population, haplotype diversity (h) and nucle-otide diversity (π) per commune ranged from 0.75 to 1 (mean h = 0.86 ± 0.088) and from 0.007 to 0.019 (mean π = 0.013 ± 0.004) respectively (Table 1), indicating that this
genetic diversity is distributed across the province. Hap-lotype diversity and nucleotide diversity of Chinese breeds ranged from 0 to 1 and from 0 to 0.019 respec-tively (Table 2). The highest nucleotide diversity was found in the Chinese Yunnan province (mean π = 0.013 ± 0.005).
As aforementioned, six haplogroups where found in the HG province. Only the Chinese Lv'erwu breed exhibited a similar rate. On average, breeds from the Yunnan prov-ince carried haplotypes from 4.3 haplogroups. With the HG population, this haplogroup diversity was not only found at the province level, but also at the village level. For villages where at least three animals were sampled, haplotype diversity averaged 0.86 and haplogroup diver-sity 0.69. This means that within a village, nearly two chickens out of three carried sequences from two differ-ent matriarchal haplogroups. This is extremely high and implies that conserving chickens from only one village from the HG province would make it possible to maintain more matriarchal lineages than would the conservation of African, Chilean or Indian local chickens [11,13,14]. The HG population showed a high nuclear genetic diversity with (He > 0.60) as compared to the 11 other domestic breeds studied in Berthouly et al. [15]. This population exhibited the highest allelic richness (mean A = 2.9) and harboured 33 of the 36 private alleles found across all studied populations [15]. Pooling all these results together, the HG population appears as an extraordinarily diversified population. Such a chicken population may represent a living gene bank [15]. These results highlight once again the importance of undertaking surveys for domestic species in remote areas when they are large enough to limit genetic drift.
The degree of population structure was assessed for the Chinese and Vietnamese dataset by calculating the distri-bution of sequence variations following imposition of two hierarchical groupings (AMOVA analysis). When the breeds were grouped according to geographic location (provinces), the major part of diversity was present within breeds (80.2%), while only a fraction was diagnostic of the provinces (4.8%). The remaining variation was present between breeds within each of the provinces (14%). Mul-tidimensional scaling was constructed using K2P dis-tance. This analysis excluded the four breeds that carried only one haplotype. The K2P plot (Figure 2) provided information about diversity at the province levels. Breeds from the same province are represented by the same colour, except for black colour which means that the breed is the only representative of its province. Axis 1 seemed to divide breeds from the Sichuan province on the left from breeds from the Yunnan province on the right. Axis 2 was difficult to interpret. However it can be observed that the lower left square included almost all the breeds showing a silky plumage phenotype. The HG pop-Figure 1 Minimum spanning tree of the Vietnamese mtDNA
hap-lotypes combined with the Chinese mtDNA from Liu et al. [7]. Cir-cle size corresponds to haplotype frequencies. Haplotypes that are not found in the HG populations are in yellow, those that have been ob-served in wild populations are written in red. When haplotype is found both in the HG population, and in Chinese provinces, proportions are indicated A10 A16 A12 A13 A15 A11 A18 A19 A2 A35 A8 A20 A21 A23 A7 A6 A24 A14 AV1 AV2 A22 AV3 A9 A17 E4 E1 G4 G9 G12 G15 G16 G19 G22 G23 G24 G17G21 GV1 G8 G13 G5 G2 G14 E2 E5 D15 E6 E9 F12 F2 F4 F1 F16 F7 F15 F6 F3 F10 F17 F11 F14 F9 F8 D3 D6 D1 D2 D5 D11 I5 I2 C2 D16 D17 11 H1 H2 H3 C4 C8 C5 C3 D4 B14 B11 B10 B15 B18 B7 B8 B5 B19 BV2 BV6 B2 BV1 BV3 BV4 BV5 B1 (128) B6 G3 C1 A1(103) 5 10 15 20 30 1 2 3 4 5 6 HG Others Yunnan Guizhou Sichuan Guanxi Hubei Not found in HG B1
Be rt h o ul y-S a la za r et a l. BMC Gene tics 20 10 , 11 :5 3 htt p :/ /ww w .biom e dcentr al. com/147 1-21 56/1 1 /53 Pa g e 5 o f 11
Table 2: List of breeds, diversity measures and geographical distribution of haplogroups: the number of samples Ni, the haplotype diversity h, the nucleotide diversity π.
Breed names Code Province Country Ni Number of haplotypes h π Haplogroups (%) Nb of haplogroups
A B C D E F G
Beijing Youkei BY Beijing China 4 3 0.83 0.006 75 25 0 0 0 0 0 2
Huxu HX Guangdong China 5 1 0.00 0.000 0 0 100 0 0 0 0 1
Qinyuan blotted QY Guangdong China 10 3 0.60 0.011 0 33 67 0 0 0 0 2
Luke LK Guanxi China 9 4 0.81 0.013 44 22 33 0 0 0 0 3
Wanfeng Wugu Wangf Guanxi China 9 5 0.81 0.016 44 11 11 0 0 11 22 5
Dwarf Wugu Dwarf Guizhou China 10 5 0.86 0.012 27 27 0 0 45 0 0 3
Guizhou Moutain Wugu Wguiz Guizhou China 10 5 0.76 0.012 64 0 18 0 27 0 0 3
Heikang Layer HK Guizhou China 5 2 0.60 0.013 60 0 40 0 0 0 0 2
Wumeng Wugu WM Guizhou China 4 2 0.67 0.003 0 100 0 0 0 0 0 1
Gushi Wugu Wgus Henan China 11 6 0.89 0.012 42 8 0 0 42 0 8 4
Henan Cockfight DJ Henan China 4 1 0.00 0.000 25 58 0 0 17 0 0 3
Taihe Silky SY Henan China 14 3 0.65 0.010 36 50 14 0 0 0 0 3
Black Silky hubei HBHF Hubei China 10 3 0.60 0.005 40 60 0 0 0 0 0 2
Silky hybrid KD Hubei China 3 2 0.67 0.009 33 67 0 0 0 0 0 2
Be rt h o ul y-S a la za r et a l. BMC Gene tics 20 10 , 11 :5 3 htt p :/ /ww w .biom e dcentr al. com/147 1-21 56/1 1 /53 Pa g e 6 o f 11
Yunxian Wugu Y Hubei China 10 5 0.87 0.014 20 30 50 0 0 0 0 3
Xuefeng XF Hunan China 8 4 0.64 0.008 0 75 13 0 13 0 0 3
Langshan RS Jiangsu China 4 1 0.00 0.000 0 100 0 0 0 0 0 1
Silky Jiangsu JSW Jiangsu China 13 6 0.85 0.013 38 23 31 0 0 8 0 4
Yugan wugu YG Jiangxi China 4 4 1.00 0.015 25 25 0 0 50 0 0 3
Bigbone DG Liaoning China 4 2 0.50 0.005 25 75 0 0 0 0 0 2
Souguang SG Shangdong China 4 3 0.83 0.007 25 75 0 0 0 0 0 2
Caoke Caoke Sichuan China 16 6 0.62 0.004 94 0 0 0 6 0 0 2
Chengdu Black Silky ChenBlaSil Sichuan China 9 5 0.81 0.010 44 44 0 0 0 0 11 3
Chengdu Silky ChenSil Sichuan China 6 4 0.71 0.004 100 0 0 0 0 0 0 1
SichuanMountain Wugu sdw Sichuan China 11 6 0.87 0.012 25 8 25 0 42 0 0 4
Ya'an Non Wugu YH Sichuan China 7 3 0.67 0.002 100 0 0 0 0 0 0 1
Ya'an Wugu YW Sichuan China 10 8 0.87 0.010 44 22 11 0 22 0 0 4
Tibetan ZJ Tibetan China 4 1 0.00 0.000 100 0 0 0 0 0 0 1
Chahua Chahua Yunnan China 16 8 0.87 0.008 42 56 0 0 2 0 0 3
Chigulu Chig Yunnan China 19 7 0.78 0.015 27 33 0 9 0 9 21 5
Douji Douji Yunnan China 9 5 0.72 0.010 11 72 0 0 6 6 6 5
Table 2: List of breeds, diversity measures and geographical distribution of haplogroups: the number of samples Ni, the haplotype diversity h, the nucleotide diversity π. (Continued)
Be rt h o ul y-S a la za r et a l. BMC Gene tics 20 10 , 11 :5 3 htt p :/ /ww w .biom e dcentr al. com/147 1-21 56/1 1 /53 Pa g e 7 o f 11
Jiangbian Jiang Yunnan China 28 11 0.85 0.013 14 0 0 0 4 43 39 4
Lv'erwu Lerv Yunnan China 29 13 0.92 0.017 24 14 3 0 10 17 31 6
Nixi NX Yunnan China 9 8 0.97 0.015 9 7 0 0 2 32 50 5
Shenggou Sheng Yunnan China 3 2 0.67 0.019 50 0 0 0 0 50 0 2
Tenchongxue Teng Yunnan China 45 15 0.88 0.016 32 7 0 0 5 50 7 5
Whenshanshandi When Yunnan China 35 12 0.89 0.015 31 28 3 0 0 14 25 5
Wuding WD Yunnan China 7 4 0.81 0.010 29 57 0 0 0 0 14 3
Yanjing Wugu YJ Yunnan China 8 7 0.96 0.015 13 13 13 0 0 0 63 4
HG population HG Ha Giang Vietnam 106 25 0.86 0.013 21 53 5 2 0 13 6 6
G. g. jabouillei 3 3 33 0 0 33 0 33 0 3
G. g. spadiceus (Genbank + Gg1) 47 13 15 38 0 23 0 11 0 5*
G. g. gallus (Genbank + Gg2 + Gg3) 46 19 4 26 0 22 2 11 15 8*
* G. g. gallus also had haplotypes from cluster I and H that are not represented in this table
Table 2: List of breeds, diversity measures and geographical distribution of haplogroups: the number of samples Ni, the haplotype diversity h, the nucleotide diversity π. (Continued)
Berthouly-Salazar et al. BMC Genetics 2010, 11:53 http://www.biomedcentral.com/1471-2156/11/53
Page 8 of 11
ulation was more similar to the Yunnan breeds which originate in the north Yunnan and the bordering area with the Guizhou province. This area is indeed inhabited by the same ethnic groups as those inhabiting the Ha Giang province. Therefore the HG chicken population is still reflecting the migration history of these ethnic groups [24]. The HG population is also not so far from silky breeds such as the Chengdu Black Silky. The HG population is as yet the only Vietnamese population that can harbour a silky plumage phenotype (Vo Van Su, per-sonal communication). The current HG population is the result of ancestral admixture during the long migration across southern China [24] followed by recent admixture with wild and domestic chickens in the Ha Giang prov-ince leading to its high genetic diversity [15]. The absence of the E haplogroup may indicate two important facts. The first one being that no ancestral migration from the Indian sub-continent occurred; indeed all human migra-tions recorded in this area were from the North to the South [25]. Secondly, as observed during surveys (see [15] for more details), European exotic breeds (commercial lines) have not been introduced in recent decades. Geographical pattern and wild admixture within the province
Commune average pairwise differences were only signifi-cant for three pairwise commune comparisons: com-munes 65 and 40; comcom-munes 65 and 20; and comcom-munes 88 and 7. Two major haplotypes B1 and A1 occurred at frequencies 33% and 11% respectively overall in the HG population (Figure 2). The distribution of the five
haplo-groups among communes was not significantly variable (Chi2 test; P = 0.251). In other words, no geographic
dis-tribution pattern of haplogroups was observed in the Ha Giang province. This result, in agreement with nuclear data [15], indicates that there was no substructuring of the HG population.
Regarding the global composition of the mtDNA diver-sity per population, the HG population is the only one to show the more similar distribution pattern as compared to G. gallus spadiceus (percentage of B higher than A, and presence of F, Table 2). This was consistent with the pres-ence of an original domestication centre within the natu-ral distribution range of G. gallus spadicieus which ranged from Myanmar to the Chinese Yunnan Province ([26,27]).
In a previous analysis of nuclear diversity [15], four communes (7, 40, 65 and 88) appeared to be highly admixed with Red junglefowl. Grouping these admixed communes, 20 haplotypes were observed from which 8 were also found in the 13 haplotypes observed in the group of non-admixed communes (i.e. 1, 2, 20, 48, 61, and 103). Haplotype diversity was estimated to be 0.866 and 0.861 and nucleotide diversity was 0.129 and 0.134 respectively for admixed and non-admixed. No differ-ences in haplogroup distribution (Chi2 test; P = 0.451)
between admixed vs. non-admixed were observed. Even if some farmers admit catching eggs in the forest of these admixed communes, the occurrence of such a practice may be lower than hybridisation between wild cocks and domestic hens. This implies that hybrid offspring of crosses between domestic cocks and junglefowl hens are uncommon or rarely back-crossed into the domestic pop-ulation while the hybrid offspring of domestic females and wild males could be more easily integrated into the domestic population. Thus, such communes can not be discriminated using mtDNA but they can be discrimi-nated with the use of microsatellites which take into account male as well as female mediated gene flows. Examination of wild sympatric populations from the Ha Giang province would be necessary to ascertain the pres-ence or abspres-ence of mtDNA gene flow from wild to domestic populations.
Phylogeographical Asian pattern of mtDNA haplogroups We combined all sequences published by Oka et al. ([9]; Japanese domestic chickens); Kanginakudru et al. ([11]; Indian domestic chickens and G. gallus murghi) and Silva et al. ([10]; Sri Lankan domestic chickens) with haplo-types of this study and from those of Liu et al. [7]. We found that the best evolution model fitting the data was HKY+ I (0.711) +G (0.598). When comparing our results to the results obtained by Liu et al. [7], we found that D formed the first group comprising haplotypes D1 and D2 and some sequences from wild G. g. murghi, and grouped Figure 2 Multidimensional scaling plot constructed by K2P
dis-tances among Chinese breeds and the HG population. Colours cor-respond to province origin of the breed as in Figure 1.
Berthouly-Salazar et al. BMC Genetics 2010, 11:53 http://www.biomedcentral.com/1471-2156/11/53
Page 9 of 11
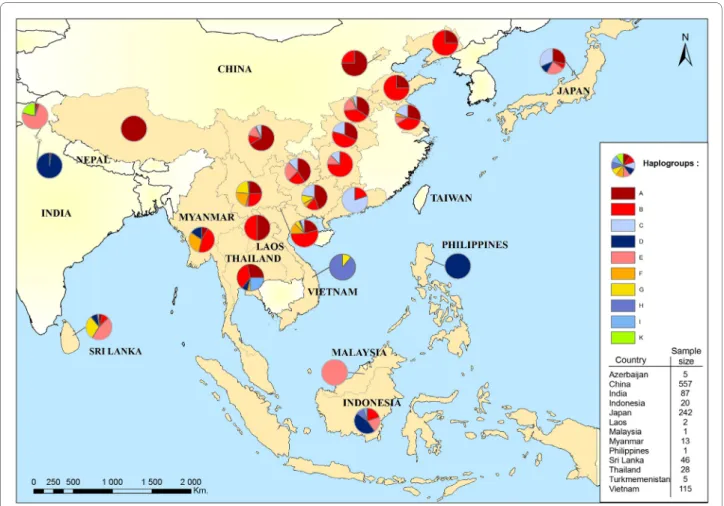
in a second time the remaining D haplotypes with Japa-nese and Sri Lankan sequences (Figure 3). An important point highlighted by this tree was the subdivision into 2 different clusters of the G. g. murghi population. As we showed previously, a first group of sequences fell with D haplotypes. The second group of sequences from G. g. murghi formed a cluster apart that we will call K. This group was not clustering with any haplotypes previously described by Liu et al. [7]. Moreover, this cluster grouped with the supercluster formed by haplogroups A, B, F, G and E. According to [7], 45% of Indian chickens belong to type D; and 55% belong to haplogroup E which also rep-resented 94% of Indian domestic chickens studied by Kanginakudru et al. [11]. Haplogroup E is mainly found in Indian breeds and also in Near Eastern and European breeds [7]. Assuming that the small proportion found in Southeastern Asian breeds (Figure 4) resulted from recent introgression of exotic breeds, we may suggest that this haplogroup originated in the Indian subcontinent. It is interesting to note that haplogroup E was not found in the G. g. murghi [11], but only in one other sample of G. g. gallus [7]. Therefore two assumptions can be made from these data: (1) the wild population carrying haplogroup E has not been sampled yet, and sampling effort within the natural distribution range of G. g. murghi is needed; (2) this haplogroup belongs to an ancestral population from the Indian subcontinent that is now extinct. Furthermore, Haplogroup C has mainly been found in Japanese breeds that originate from commercial exchanges with Korea, Taiwan or the eastern provinces of China [9]. This haplo-group is also frequently present in breeds from the Chi-nese Guangdong province (Figure 4; Huxu breed: 100% and Qinyuan breed: 67%). Therefore, the area distribu-tion of haplogroup C in the wild populadistribu-tion could be the Chinese provinces bordering the South China Sea. Hap-logroup A was rather found in Northern Asian breeds while haplogroup F and G were found in the northern part of Southeast Asia. By contrast, Haplogroup B encompassed North and Southeast Asia (Figure 4). Thus, despite human migration and commercial exchanges, we could observe a geographical pattern of haplogroup dis-tribution.
Conclusions
The Vietnamese HG chicken showed high genetic diver-sity at both the nuclear and the mitochondrial level when compared to other local breeds. This genetic diversity is the result of many factors. One of the most important is the geographical position within a domestication centre area. Furthermore, we should not underestimate the impact of human and livestock migrations. This genetic diversity has been moreover supplied by the continuous current gene flow between domestic and wild population as shown with nuclear DNA [15]. Hence, the Ha Giang
chicken represents a highly valuable genetic resource in constant co-evolution with its environment. The exten-sive contribution of wild ancestors is a source of increased genetic diversity for farm animals which may acquire the potential for adaptation to environmental changes. All this reinforces the need to maintain such a population.
However, the widespread occurrence of free-ranging livestock is raising fear that introgressive hybridisation with wild populations would lead to a loss of biodiversity Figure 3 The PhyML tree of all Asian breeds published data. Red branch indicate bootstrap values higher than 80%.
Berthouly-Salazar et al. BMC Genetics 2010, 11:53 http://www.biomedcentral.com/1471-2156/11/53
Page 10 of 11
in the wild populations that could decrease their fitness. Chazara et al. [28] suggested that introgression of domes-ticated Japanese quail genes in wild Common quail popu-lations might affect the phenotypic expression of functional traits, such as body size, feather colour, sexual calls and migratory behaviour. Continuous contacts between wild and domestic animal also favoured disease exchange. Smith et al. [29] showed that virus from the H2N2/1957 and H3N2/1968 pandemics seemed to have originated from avian hosts, probably in Asia. Wild rela-tives may represent a host population where the virus can evolve and where control measures such as vaccination are not possible to use. Identifying and quantifying such interactions may allow inferring the importance of the wild compartment in the epidemiology of viral infections. Additional material
Authors' contributions
All authors read and approved the final manuscript. NVT carried out sample collection; CB carried out sample collection, sequencing, the computational
analysis and prepared the manuscript; GM created the distribution maps, XR and JRM participated in the computational analysis and preparation of the manuscript; BB and NB participated in the sequencing, MTB contributed to the revision of the manuscript; EV participated in the design of the study and the revision of the manuscript; VCC participated in the coordination of the study; JCM participated in the design, coordination of the study, and revision of the manuscript.
Acknowledgements
This study was part of the BIODIVA project and was jointly funded by the French Ministry of Foreign Affairs and the National Institute of Animal Hus-bandry of Vietnam. We thank Mrs Wendy Brand-Williams for linguistic revision.
Author Details
1CIRAD, UPR AGIRS, Campus International de Baillarguet, F-34398 Montpellier, France, 2AgroParisTech, UMR1313 Génétique animale et biologie intégrative F-75005 Paris, France, 3INRA, UMR1313 Génétique animale et biologie intégrative, F-78350 Jouy-en-Josas, France, 4NIAH, Tu Liem, Ha Noi, Vietnam, 5Institut de Botanique (Bat. 22), University of Liège, 4000, Liège, Belgium and 6Centre de Biologie et de Gestion des Populations (CBGP), UMR 1062, Campus International de Baillarguet, CS 30016, F-34988, Montferrier le Lez, France
References
1. Pinard-Van Der Laan MH, Monvoisin JL, Pery P, Hamet N, Thomas M: Comparison of outbred lines of chickens for resistance to experimental infection with coccidiosis (Eimeria tenella). Poul Sci 1998, 77:185-191. Additional file 1 DOC Samples information. Summary of breeds used,
their origin, number of individuals and GenBank accession numbers.
Received: 9 March 2010 Accepted: 18 June 2010 Published: 18 June 2010
This article is available from: http://www.biomedcentral.com/1471-2156/11/53 © 2010 Berthouly-Salazar et al; licensee BioMed Central Ltd.
This is an Open Access article distributed under the terms of the Creative Commons Attribution License (http://creativecommons.org/licenses/by/2.0), which permits unrestricted use, distribution, and reproduction in any medium, provided the original work is properly cited.
BMC Genetics 2010, 11:53
Berthouly-Salazar et al. BMC Genetics 2010, 11:53 http://www.biomedcentral.com/1471-2156/11/53
Page 11 of 11
2. Hillel J, Groenen MAM, Tixier-Boichard M, Korol AB, David L, Kirzhner VM, Burke T, Barre-Dirie A, Crooijmans RPMA, Elo K, Feldman MW, Freidlin PJ, Mäki-Tanila A, Oortwijn M, Thomson P, Vignal A, Wimmers K, Weigend S: Biodiversity of 52 chicken populations assessed by microsatellite typing of DNA pools. Genet Sel Evol 2003, 35:533-557.
3. Muchadeyi FC, Eding H, Wollny CBA, Groeneveld E, Makusa SM, Shamseldin R, Simianer H, Weigend S: Absence of population substructuring in Zimbabwe chicken ecotypes inferred using microsatellites analysis. Anim Genet 2007, 38:332-339.
4. Berthouly C, Bed'Hom B, Tixier-Boichard M, Chen CF, Lee YP, Laloë D, Legros H, Verrier E, Rognon X: Using molecular and multivariate methods to study the genetic diversity of local European and Asian chickens breeds. Anim Genet 2008, 39:121-129.
5. Granevitze Z, Hillel J, Chen GH, Cuc NTK, Feldman M, Eding H, Weigend S: Genetic diversity within chicken populations from different continents and management histories. Anim Genet 2007, 38:576-583.
6. Fumihito A, Miyake T, Sumi S, Takada M, Ohno S, Kondo N: One subspecies of the red Junglefowl (Gallus gallus gallus) suffices as the matriarchic ancestor of all domestic breeds. Proc Natl Acad Sci USA 1994, 91:12505-12509.
7. Liu YP, Wu GS, Yao YG, Miao YW, Luikart G, Baig M, Beja-Pereira A, Ding ZL, Palanichamy MG, Zhang YP: Multiple maternal origins of chickens: out of the Asian jungles. Mol Phylogenet Evol 2006, 38:12-19.
8. Eriksson J, Larson G, Gunnarsson U, Bed'hom B, Tixier-Boichard M, Strömstedt L, Wright D, Jungerius A, Vereijken A, Randi E, Jensen P, Andersson L: Identification of the yellow skin gene reveals a hybrid origin of the domestic chicken. PLoS Genet 2008, 4:e1000010. 9. Oka T, Ino Y, Nomura K, Kawashima S, Kuwayama T, Hanasa H, Amano T,
Takada M, Takahata N, Hayashi Y, Akishinonomiva F: Analysis of mtDNA sequences shows Japanese native chickens have multiple origins.
Anim Genet 2007, 38:287-293.
10. Silva P, Guan X, Ho-Shing O, Jones J, Xu J, Hui D, Notter D, Smith E: Mitochondrial DNA-based analysis of genetic variation and relatedness among Sri Lankan indigenous chickens and the Ceylon junglefowl (Gallus lafayetti). Anim Genet 2009, 40:1-9.
11. Kanginakudru S, Metta M, Jakati RD, Nagarju J: Genetic evidence from Indian red jungle fowl corroborates multiple domestication of modern day chicken. BMC Evol Biol 2008, 8:174-197.
12. Storey AA, Ramírez JM, Quiroz D, Burley DV, Addison DJ, Walter R, Anderson AJ, Hunt TL, Athens JS, Huynen L, Matisoo-Smith EA: Radiocarbon and DNA evidence for a pre-Columbian introduction of Polynesian chickens to Chile. Proc Natl Acad Sci USA 2007,
104:10335-10339.
13. Gongora J, Rawlence JN, Mobegi AV, Jianlin H, Alcalde JA, Matus JT, Hanotte O, Moran C, Austin JJ, Ulm S, Anderson AJ, Larson G, Cooper A: Indo-European and Asian origins for Chilean and Pacific chickens revealed by mtDNA. Proc Nat Acad Sci USA 2008, 105:10308-10313. 14. Muchadeyi FC, Eding H, Simianer H, Wollny CBA, Groneveld E, Weigend S:
Mitochondrial DNA D-loop sequences suggest a Southeast Asian and Indian origin of Zimbabwean village chickens. Anim Genet 2008, 39:615-622.
15. Berthouly C, Leroy G, Nhu Van T, Hoang Thanh H, Bed'Hom B, Trong Nguyen B, Vu Ci C, Monicat F, Tixier-Boichard M, Verrier E, Maillard JC, Rognon X: Genetic Analysis of local Vietnamese chickens provides evidence of gene flow from wild to domestic populations. BMC Genet 2009, 10:1-8.
16. Hall TA: BioEdit: a user-friendly biological sequence alignment editor and analysis program for Windows 95/98/NT. Nucleic Acids Symp Ser 1999, 41:95-98.
17. Rozas J, Sánchez-DelBarrio JC, Messeguer X, Rozas R: DnaSP, DNA polymorphism analyses by the coalescent and other methods.
Bioinformatics 2003, 19:2496-2497.
18. Kimura M: A simple method for estimating evolutionary rates of base substitutions through comparative studies of nucleotide sequences. J
Mol Evol 1980, 16:111-120.
19. Excoffier L, Laval G, Schneider S: Arlequin (version 3.0): An integrated software package for population genetics data analysis. Evol Bioinform
Online 2005, 1:47-50.
20. R Development Core Team: R: A Language and Environment for Statistical Computing. R foundation for Statistical Computing, Vienna, Austria; 2006.
21. Posada D, Crandall KA: MODELTEST: testing the model of DNA substitution. Bioinformatics 1998, 14:817-818.
22. Akaike H: A new look at the statistical model identification. IEEE Trans
Automat Contr 1974, 19:716-723.
23. Guindon S, Gascuel O: A simple, fast and accurate algorithm to estimate large phylogenies by maximum likekihood. Syst Biol 2003, 52:696-704. 24. Savina FM: Histoire des Miao. Société des missions étrangères, Hong
Kong; 1924.
25. Osborne ME: Southeast Asia: an introductory history. NY, Allen & Ullin; 1997:263.
26. West B, Zhou BX: Did chickens go North? New evidence for domestication. J Archaeol Sci 1988, 15:515-533.
27. De Hoyo J, Elliot A, Sargatal J, Editions Lynx: Handbook of the birds of the World. In New World Vultures to Guineafowl Barcelona; 1994.
28. Chazara O, Minvielle F, Roux D, Bed'hom B, Feve K, Coville JL, Kayang BB, Lumineau S, Vignal A, Boutin JM, Rognon X: Evidence for introgressive hybridization of wild common quail (Coturnix coturnix) by domesticated Japanese quail (Coturnix japonica) in France. Conserv
Genet 2009. 10.1007/s10592-009-9951-8
29. Smith GJD, Vijaykrishna D, Bahl1 J, Samantha J, Lycett SJ, Worobey M, Pybus OG, Ma SK, Cheung CL, Raghwani J, Bhatt S, Peiris JSM, Guan Yi, Rambaut A: Origins and evolutionary genomics of the 2009 swine-origin H1N1 influenza A epidemic. Nature 2009, 459:1122-1125.
doi: 10.1186/1471-2156-11-53
Cite this article as: Berthouly-Salazar et al., Vietnamese chickens: a gate