HAL Id: hal-02295768
https://hal.inria.fr/hal-02295768
Submitted on 24 Sep 2019
HAL is a multi-disciplinary open access
archive for the deposit and dissemination of
sci-entific research documents, whether they are
pub-lished or not. The documents may come from
teaching and research institutions in France or
abroad, or from public or private research centers.
L’archive ouverte pluridisciplinaire HAL, est
destinée au dépôt et à la diffusion de documents
scientifiques de niveau recherche, publiés ou non,
émanant des établissements d’enseignement et de
recherche français ou étrangers, des laboratoires
publics ou privés.
City Reconstruction from Airborne Lidar: A
Computational Geometry Approach
Jean-Philippe Bauchet, Florent Lafarge
To cite this version:
Jean-Philippe Bauchet, Florent Lafarge. City Reconstruction from Airborne Lidar: A Computational
Geometry Approach. 3D GeoInfo 2019 - 14thConference 3D GeoInfo, Sep 2019, Singapore, Singapore.
�hal-02295768�
CITY RECONSTRUCTION FROM AIRBORNE LIDAR : A COMPUTATIONAL
GEOMETRY APPROACH
Jean-Philippe Bauchet1, 2∗, Florent Lafarge2
1LuxCarta Technology, Mouans-Sartoux, France - [email protected] 2Inria, Sophia-Antipolis, France - [email protected]
KEY WORDS: Urban reconstruction, airborne Lidar, point clouds, classification, kinetic data structures
ABSTRACT:
We introduce a pipeline that reconstructs buildings of urban environments as concise polygonal meshes from airborne LiDAR scans. It consists of three main steps : classification, building contouring, and building reconstruction, the two last steps being achieved using computational geometry tools. Our algorithm demonstrates its robustness, flexibility and scalability by producing accurate and compact 3D models over large and varied urban areas in a few minutes only.
1. INTRODUCTION
Urban reconstruction techniques have attracted an increasing attention from the scientific community over the last decade. Applications of such techniques include, for instance, urban planning, natural disaster management, or radio-wave propa-gation (l, i).
Various data sources are considered by such algorithms, such as ground imagery, satellite imagery, or pre-existing GIS data. However, despite high acquisition costs, LiDAR point clouds are more accurate and remain a data source commonly used by land surveying offices or civil engineers (s, u).
Yet, models generated by current city modeling techniques may be enriched with semantic information, or represented using progressive levels of detail. The CityGML standard (ö, r) con-siders four coarse-to-fine levels applicable to airborne datasets, from LOD0 to LOD3.
In this paper, we present a pipeline that receives as input an un-structured point set describing a urban environment, and gener-ates as output a LOD2 representation of the scene in compliance with the CityGML standard. More precisely, we aim at provid-ing a faithful reconstruction of buildprovid-ings with tilted roofs. The representation of superstructures like dormers or chimneys is beyond the scope of this paper. Our main idea is to make use of powerful computational geometry tools to extract the geometric signatures of the observed buildings. We emphasize the accu-racy and the scalability of our method, since it is able to process large datasets with millions of points, dense or sparse, in a few minutes.
2. RELATED WORKS
There exists a vast literature on automatic urban reconstruction techniques, (a, a; t, o; s, u), demonstrating the deep interest of scientists and industrials for this research topic. Various data sour- ces may be considered, leading us to draw a first distinc-tion between all existing approaches, based on this criterion. Indeed, some algorithms may specifically address the problem of large-scale urban reconstruction from aerial imagery (b, e; n,
∗Corresponding author
e), satellite imagery (a, u) or multi-view stereo dense meshes (u, h; r, e; l, a). Some others combine different sources of data to generate urban models with the finest level of detail (l, e). In this work, we focus on the problem of city modeling from LiDAR point clouds. Roof height estimation and building re-construction is often the most valuable information to extract from such data, which is acquired using terrestrial or aerial devices. In particular, nadir or near-nadir acquisitions pose a specific constraint, as facades are missed by scanners. Current state-of-the-art approaches have been extensively reviewed (n, a) and can be divided in three categories.
Data-driven methods are probably the most popular techniques. These are bottom-up approaches, in which parametric primi-tives are extracted from the data and assembled to form a re-constructed model. Existing pipelines typically consist of three successive steps : classification, segmentation and geometric modeling. The semantic interpretation of the data, and the clus-tering of buildings into individual structures may involve sta-tistical arguments (u, o) or discriminative geometric features coupled with energetic formulations (f, a). However, the mod-els produced by such techniques do not achieve the same level of detail. For instance, the methods proposed in (o, h) and (u, o) only reconstruct multi-level flat buildings from airborne point clouds, which is suitable for Manhattan-like districts but less accurate for residential areas. In contrast, the algorithm of (h, o) considers a binary space partitioning tree to generate LOD2 polyhedral meshes from a point cloud. The one of (o, h) reaches a similar level of detail by minimizing 2.5D quadric error functions, i.e. taking into account both the surface be-ing reconstructed and its projected boundary. However, due to the projection of the points on a 2D grid, the reconstructed facades show a zig-zagging effect, which might be corrected by the mesh simplification procedure described in (o, h). The cell decomposition approach proposed in (d, a) allows to re-construct buildings with a compact representation, but requires precise building footprints as input. The method of (f, a) also re-turns persuasive results over large-scale areas, but suffers from the same failing. Recently, deep-learning-based methods have also been developed in a context of LOD2 urban modeling and achieve very promising results (a, h).
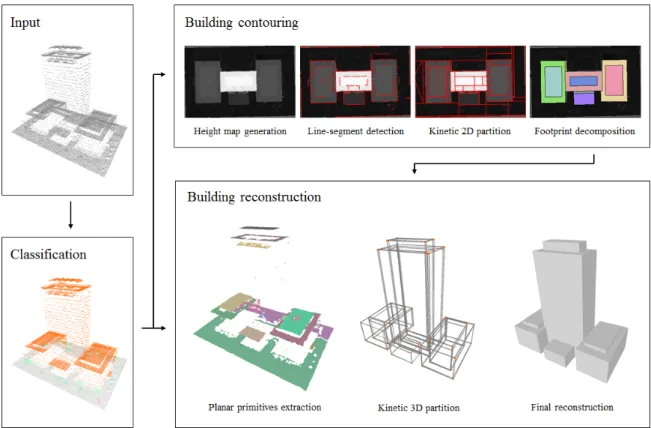
Figure 1. Overview of our pipeline. Our method consists of three main steps. We first label points of the LiDAR scan as ground, vegetation or roof. Then, we apply a contouring algorithm to the height map, revealing the facades initially absent in the point set. Finally, we extract and propagate planar primitives from the point cloud, dividing the space into
polyhedra that are labelled to obtain a 3D reconstruction of buildings.
top-down strategy. This family of techniques considers a pre-defined library of template structures (e.g. flat, gable, hip or mansard roofs) that is matched to the input data. The work of (r, e) offers a first example of model-driven algorithm : elements of the point cloud are first classified as flat or non-flat and a roof topology graph is considered to decompose a complex building into simpler structures. Another example is the work of (a, u) in which a stochastic approach is used to select the roof templates that best fit the input data. Also requiring building footprints as prior knowledge, the method of (n, e) uses Ransac and super-vised machine learning techniques to generate a LOD2 recon-struction of a sparse LiDAR point in a model-driven way. How-ever, such approaches may lack of flexibility with respect to the variety of urban landscapes. Finally, hybrid-driven methods try to take the best of both worlds : parameterized primitives are extracted and assembled with respect to a set of constraints de-rived from constructive solid geometry (o, i) (f, a).
In the following, we present an algorithm that addresses the problems we exposed before by exploiting powerful compu-tational geometry tools. Given an airborne input point cloud, we design a scalable and data-driven algorithm that generates LOD2 representations of different urban environments as con-cise polyhedral meshes.
3. ALGORITHM 3.1 Input
As depicted by Figure 1, our algorithm takes as input a point cloud with oriented normals. Normals can be easily estimated
thanks to the acquisition system information. If not provided, then basic mathematical tools like principal component analysis can be used.
3.2 Classification
The first step of our pipeline consists in assigning semantic la-bels to points of the point cloud. Three lala-bels are considered : ground, vegetation, and building.
To this end, we rely on the classification package provided by the CGAL library (r, i). For each point of the input dataset, this method computes multi-scale geometric features such as eleva-tion, planarity or vertical dispersion for instance. Extra features provided along with the dataset, like the number of returns, are also taken into account. Given a ground truth training set, these features are then used to train a classifier. The default choice for the classifier is a random forest, that constructs several decision trees to assign each point to one of the three aforementioned subsets.
Interactively labelling the data to get a representative training dataset is a tedious work. However, the CGAL library offers the possibility to save and reuse a trained classifier, which is particularly useful for processing urban scenes of similar nature (dense or surburban areas, downtowns, historical centers...). 3.3 Building contouring
Facades of buildings are often partially or completely missing in aerial point clouds. To obtain accurate reconstructions of cities from such data, we first need a robust method that detects significant height discontinuities in the classified point cloud.
To this end, we project all points on a horizontal, uniformly sampled grid, in order to generate two kinds of maps : (i) a height map, normalized as a grayscale image, (ii) a probability map, measuring the proportion of projected points labelled as buildingsin each cell of the grid.
These two maps are then processed by the polygonal partition-ing technique of (u, a). Given an input image, this algorithm first detects line-segments, which are linear approximations of regions where the image gradient is high and regular. These line-segments propagate across the image, until intersecting each other, resulting in a decomposition of the image into convex polygons. Here, we generate a polygonal decomposition of the height map. Intuitively, the detected line-segments, later in-cluded in the edges of the partition, correspond to regular height discontinuities in a given direction, i.e. to facades.
Using the probability map previously defined, we further assign a binary activation variable to each polygonal cell, indicating if it is part, or not, of a building footprint. In order to simplify the partition, and decrease the number of cells, we finally apply a clustering algorithm that merges neighbor cells upon condition that there is no height discontinuity at their common border. 3.4 Building reconstruction
To obtain a LOD2 reconstruction from an oriented point cloud, from which we discard all points labelled as vegetation, we pro-pose an algorithm in three steps.
First of all, we extract planar primitives from the point cloud. We apply a region-growing algorithm, implemented in the CGAL library (s, e). A plane hypothesis is iteratively propagated from a point to its neighbors. It is accepted if it has a minimum num-ber of inliers N , with respect to a maximal point-to-plane dis-tance ε. If input points are noisy, more robust methods such as efficient Ransac (h, c) or structure-aware shape collapse (n, a) can be considered. The threshold N should be set depending on the density of the cloud, so that N points cover an area of 5 m2approximately, whereas ε is typically set to 0.5 m. Once all
planes have been extracted, we obtain a set of primitives repre-sented by the planar convex hulls of the different sets of inliers associated to those planes.
The second step of our algorithm consists in performing a ki-netic propagation of the primitives in the 3D space. Similarly to the work of (u, a), we initialize and process a priority queue to predict and sort intersections between extending primitives. We choose to apply homothetic transformations of ratio (1 + t), where t ≥ 0 represents the current simulation time. Assuming the existence of a bounding box containing all primitives, pro-cessing all intersections results in a polyhedral decomposition of the space.
However, predicting the intersection time between two planar primitives is a costly operation. For large datasets with millions of points, the simultaneous propagation of thousands of primi-tives is a very complex and time-consuming operation. On the other hand, vertical planes corresponding to facades cannot be extracted from the input point cloud, since the data is missing. This is the reason why we split the spatial propagation problem into F subproblems, where F is the number of polygonal foot-prints returned by the procedure described in section 3.3. More precisely, for each footprint we get the list of primitives that in-tersect or are included in it by projection, and perform a spatial
propagation restricted to the dimensions of the footprint. We obtain a set of F 3D subgraphs G1, G2, . . . GF.
The third and final step of our pipeline consists in labelling the polyhedra of each subgraph Gias inside or outside the
build-ings to reconstruct. The facets at the interface between outside and inside polyhedra then correspond to the output surface. We use a voting scheme, based on the observation that in aerial datasets, points delimit the upper parts of the objects of interest. Let Pibe the set of polyhedrons of the subgraph Gi. For each
polyhedron pj ∈ Pi, where j = 1, 2 . . . |Pi|, we initialize a
counter cj to 0. All polyhedrons located below (resp. above)
any plane inlier decrement (resp. increment) their counters. Let us now consider a vector X with |Pi| binary activation
vari-ables : xj = 1(resp. xj = 0) if the polyhedron pjis labelled
as inside (resp. outside) a building to extract. We measure the quality of an output surface using a two-term energy of the form U (X) = D(X) + λV (X) (1) D(X)is a data term that encourages the selection of a poly-hedron pj when cj < 0, and its rejection when cj > 0. We
have : D(X) = 1 |I| |Pi| X j=1 dj(xj) (2) where dj(xj) = ( −cj when xj= 0 cj when xj= 1 (3)
and |I| is twice the number of inliers. V (X), for its part, is a generalized Potts model that penalizes the total area of the surface : V (X) = 1 A X j∼k ajk· 1xj6=xk (4)
where j ∼ k denotes an adjacency relationship between two polyhedra pjand pk, ajkis the surface of their common facet,
and A is a normalization term defined as the sum of the areas of all facets of the subgraph Gi.
Given a balancing term λ ∈ [0, 1], the optimal surface that min-imizes energy U is determined by a min-cut algorithm (y, o). A low value of λ returns a too large and too complex surface, while a high value of λ tends to shrink it. In our experiments, we typically set λ to 0.5.
4. EXPERIMENTS
Datasets. We tested our algorithm on four datasets, represent-ing various urban landscapes. The covered cities are listed in Table 1. The size is given in millions of points.
Qualitative results. We present in Figures 2, 3, 4 and 4 the models generated by our algorithm for these cities. From a qualitative point of view, we obtain persuasive LOD2 recon-structions of most buildings. The Biberach and Vaihingen data-sets contain a lot of gable and hip roofs which are correctly approximated by our algorithm. As for the Portland and San
(a) Biberach. 0
≥ 1 m
(b) Vaihingen.
0 ≥ 1 m
Figure 2. Results on European-style urban landscapes. Left column : classified point clouds. Points labelled as ground, vegetation or buildings are colored in gray, green and red, respectively. Center column : reconstructed models. Right column : altimetric error map, in which a darker color represents a larger error. From left to right : classified point cloud,
reconstructed model, and altimetric error map. Some close-ups are showed in Figures 4 and 4.
Diego datasets, our technique also succeeds in determining in-termediate levels in complex structures, as well as tilted roofs if any. Facades, which are almost completely missing in the in-put scans, are generally recovered by a single plane in a given direction. Some of them, however, might be affected by an un-wanted zig-zagging effect, reflecting errors in the building con-touring procedure. Note that trees could be also reconstructed in 3D by template matching (r, e) to better represent the urban
landscapes.
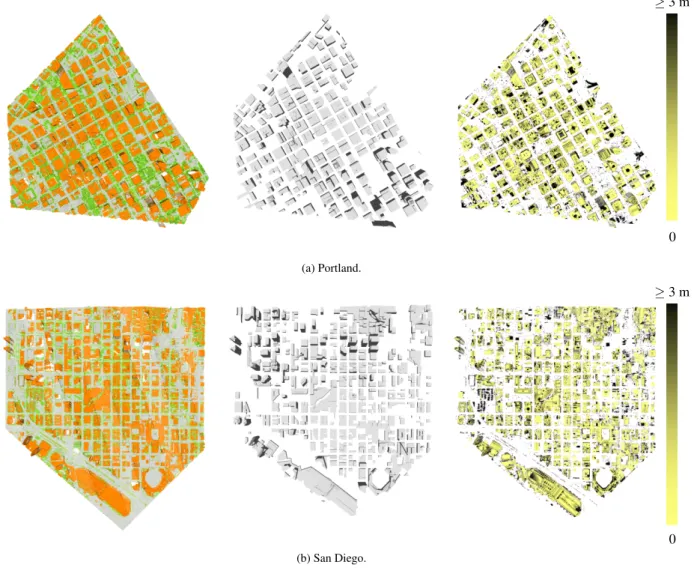
Quantitative results. In Figures 2 and 3, we provide altimet-ric error maps for each dataset. To generate them, we restaltimet-rict the input point cloud to elements labelled as rooftops, and compute the one-sided Hausdorff distance from every point to the recon-structed surface. This way, we can evaluate the precision of our method. We compute a raw reconstruction error : the mean
(a) Portland. 0 ≥ 3 m (b) San Diego. 0 ≥ 3 m
Figure 3. Results on American-style urban landscapes. Some close-ups are showed in Figures 4 and 4.
City Type Size Density (pts/m2)
Biberach Historical center 2.3M 3.0 Vaihingen Residental area 7.3M 6.3 Portland Downtown 8.7M 7.8 San Diego Downtown 4.5M 1.6
Table 1. Presentation of the dataset.
one-sided Hausdorff distance. However, this measure may be biased. Indeed, isolated mislabelled points in the classification process, and a few buildings missed by the contouring algo-rithm and further ignored in the reconstruction phase, tend to overestimate the average reconstruction error. That is why we suggest, on an indicative basis, a corrected reconstruction er-ror, which discards points located at more than 3 meters from a building which corresponds to the average height of a floor. Our measures are listed in Table 2.
The geometric error is typically caused by : (i) undetected su-perstructures on rooftops, (ii) uncorrectly approximated prim-itives in the plane extraction procedure (e.g. a unique plane approximates the two sides of a gable roof) and (iii) the reso-lution of the generated height map, that may shift the extracted
City Raw error (m) Corrected error (m) Biberach 0.85 0.31 Vaihingen 1.91 0.43 Portland 1.75 0.53 San Diego 2.34 0.62
Table 2. Geometric error for each dataset.
footprints towards one direction or another.
Performances. We list in Table 3 the performances of our al-gorithm for our two biggest datasets, Vaihingen and Portland, in terms of memory peak and running times. Measures were per-form on a machine equiped with an Intel CoreR TMi7-6700HQ
processor clocked at 2.60 GHz and a 32 GB RAM. The obtained values demonstrate the ability of our algorithm to process large volumes of data in a short time.
Limitations. Despite its advantages, our algorithm suffers from a few shortcomings. Any error caused by an intermediate step of the pipeline has an impact on the final result. Parts of the cloud representing buildings mislabelled by the classifier will not be reconstructed. Besides, the reconstruction is very
sensi-Figure 4. Close-ups on the reconstructed models. From top to bottom : church (Biberach), tent (Biberach), residential area (Vaihingen).
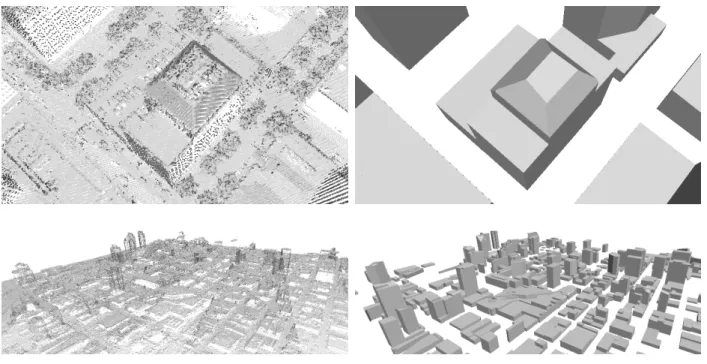
Figure 5. Close-ups on the reconstructed models. From top to bottom : multi-level building (Portland), urban landscape (San Diego). Vaihingen Portland Building contouring (s) 13.5 20.9 Building reconstruction (s) 509.3 872.8 Memory peak (GB) 2.2 2.6
Table 3. Performance measures for datasets Vaihingen and Portland.
tive to building contouring errors : if some footprints or inter-mediate heights inside multi-level structures are missed in the coutouring process, then buildings will also be missing or badly approximated in the final result.
Besides, our primitive detection scheme only extracts planes from the input point cloud. This feature is sufficient for recon-structing accurately most buildings, but free-form shapes like domes or curved walls will only be approximated as a set of planar shapes. Small structures like dormers and chimneys may also be ignored in the reconstructed model, if the minimal num-ber of inliers by the plane extraction procedure is too high.
5. CONCLUSIONS
In this paper, we presented a pipeline for automatically recon-structing a urban scene from an airborne LiDAR scan at the level of detail LOD2. We used a kinetic approach, in which a set of predetected line-segments and planar polygons propagate to decompose the 2D and 3D spaces into cells that are labelled and assembled in our final model. Our approach is fast, scalable and delivers simple polyhedral meshes. It returns promising re-sults on various datasets, representing different types of urban environments.
In future works, we plan to refine the building contouring al-gorithm in order to simplify and improve the accuracy of our
reconstructed models. We might resort to deep-learning-based methods to this end. Another research path would consist in in-tegrating non-linear primitives to our kinetic scheme to achieve better reconstructions of free-form structures.
ACKNOWLEDGEMENTS
This work was supported by LuxCarta Technology. The authors thank Lionel Laurore, Yuliya Tarabalka and Frederic Trastour for their comments and technical discussions.
References
Bauchet, Jean-Philippe, Lafarge, Florent, 2018. Kippi: Kinetic polygonal partitioning of images. Proceedings of the IEEE Conference on Computer Vision and Pattern Recognition, 3146–3154.
Biljecki, Filip, Stoter, Jantien, Ledoux, Hugo, Zlatanova, Sisi, Çöltekin, Arzu, 2015. Applications of 3D city models: state of the art review. ISPRS International Journal of Geo-Information, 4, 2842–2889.
Boykov, Yuri, Kolmogorov, Vladimir, 2004. An experimental comparison of cut/max-flow algorithms for energy min-imization in vision. IEEE Transactions on Pattern Analysis & Machine Intelligence, 1124–1137.
Duan, Liuyun, Lafarge, Florent, 2016. Towards large-scale city reconstruction from satellites. Proc. of the European Confer-ence on Computer Vision (ECCV).
Fang, Hao, Lafarge, Florent, Desbrun, Mathieu, 2018. Pla-nar Shape Detection at Structural Scales. Proc. of the IEEE conference on Computer Vision and Pattern Recognition (CVPR).
Giraudot, Simon, Lafarge, Florent, 2019. Classification. CGAL User and Reference Manual, 4.14 edn, CGAL Editorial Board.
Gröger, Gerhard, Kolbe, Thomas H, Nagel, Claus, Häfele, Karl-Heinz, 2012. OGC city geography markup language (CityGML) encoding standard.
Haala, Norbert, Kada, Martin, 2010. An update on automatic 3D building reconstruction. ISPRS Journal of Photogramme-try and Remote Sensing, 65, 570–580.
Henn, André, Gröger, Gerhard, Stroh, Viktor, Plümer, Lutz, 2013. Model driven reconstruction of roofs from sparse LI-DAR point clouds. ISPRS Journal of photogrammetry and remote sensing, 76, 17–29.
Huang, Hai, Brenner, Claus, Sester, Monika, 2013. A genera-tive statistical approach to automatic 3D building roof recon-struction from laser scanning data. ISPRS Journal of pho-togrammetry and remote sensing, 79, 29–43.
Kada, Martin, McKinley, Laurence, 2009. 3D building recon-struction from LiDAR based on a cell decomposition ap-proach. International Archives of Photogrammetry, Remote Sensing and Spatial Information Sciences, 38, W4.
Kelly, Tom, Femiani, John, Wonka, Peter, Mitra, Niloy J., 2017. BigSUR: Large-scale Structured Urban Reconstruc-tion. ACM Transactions on Graphics, 36.
Lafarge, Florent, Descombes, Xavier, Zerubia, Josiane, Pierrot-Deseilligny, Marc, 2010. Structural approach for building re-construction from a single DSM. IEEE Transactions on Pat-tern Analysis and Machine Intelligence, 32.
Lafarge, Florent, Mallet, Clement, 2011. Building large urban environments from unstructured point data. Proc. of the IEEE International Conference on Computer Vision (ICCV). Musialski, Przemyslaw, Wonka, Peter, Aliaga, Daniel G.,
Wim-mer, Michael, Van Gool, Luc, Purgathofer, Werner, 2013. A Survey of Urban Reconstruction. Computer Graphics Forum, 32.
Oesau, Sven, Verdie, Yannick, Jamin, Clément, Alliez, Pierre, Lafarge, Florent, Giraudot, Simon, 2019. Point set shape de-tection. CGAL User and Reference Manual, 4.14 edn, CGAL Editorial Board.
Poullis, Charalambos, 2013. A framework for automatic mod-eling from point cloud data. IEEE transactions on pattern analysis and machine intelligence, 35, 2563–2575.
Poullis, Charalambos, You, Suya, 2009. Automatic reconstruc-tion of cities from remote sensor data. 2009 IEEE conference on computer vision and pattern recognition, IEEE, 2775– 2782.
Rottensteiner, Franz, Sohn, Gunho, Gerke, Markus, Wegner, Jan Dirk, Breitkopf, Uwe, Jung, Jaewook, 2014. Results of the ISPRS benchmark on urban object detection and 3D building reconstruction. ISPRS Journal of Photogrammetry and Remote Sensing, 93, 256–271.
Salinas, David, Lafarge, Florent, Alliez, Pierre, 2015. Structure-Aware Mesh Decimation. Computer Graphics Fo-rum, 34.
Schnabel, Ruwen, Wahl, Roland, Klein, Reinhard, 2007. Ef-ficient ransac for point-cloud shape detection. Computer graphics forum, 26number 2, Wiley Online Library, 214– 226.
Sohn, Gunho, Huang, Xianfeng, Tao, Vincent, 2008. Using a binary space partitioning tree for reconstructing polyhedral building models from airborne lidar data. Photogrammetric Engineering & Remote Sensing, 74, 1425–1438.
Verdie, Yannick, Lafarge, Florent, 2012. Efficient Monte Carlo sampler for detecting parametric objects in large scenes. Proc. of the European Conference on Computer Vision (ECCV).
Verdie, Yannick, Lafarge, Florent, Alliez, Pierre, 2015. LOD Generation for Urban Scenes. ACM Trans. on Graphics, 34. Verma, Vivek, Kumar, Rakesh, Hsu, Stephen, 2006. 3d building
detection and modeling from aerial lidar data. CVPR, 2213– 2220.
Wang, Ruisheng, Peethambaran, Jiju, Chen, Dong, 2018. Li-DAR Point Clouds to 3-D Urban Models : A Review. IEEE Journal of Selected Topics in Applied Earth Observations and Remote Sensing, 11, 606–627.
Xiong, Biao, Elberink, S Oude, Vosselman, G, 2014. A graph edit dictionary for correcting errors in roof topology graphs reconstructed from point clouds. ISPRS Journal of Pho-togrammetry and Remote sensing, 93, 227–242.
Zebedin, Lukas, Bauer, Joachim, Karner, Konrad, Bischof, Horst, 2008. Fusion of feature-and area-based information for urban buildings modeling from aerial imagery. European conference on computer vision, Springer.
Zeng, Huayi, Wu, Jiaye, Furukawa, Yasutaka, 2018. Neu-ral proceduNeu-ral reconstruction for residential buildings. Pro-ceedings of the European Conference on Computer Vision (ECCV), 737–753.
Zhang, Liqiang, Zhang, Liang, 2018. Deep Learning-Based Classification and Reconstruction of Residential Scenes From Large-Scale Point Clouds. IEEE Transactions on Geo-science and Remote Sensing, 56, 1887-1897.
Zhou, Qian-Yi, Neumann, Ulrich, 2009. A streaming frame-work for seamless building reconstruction from large-scale aerial lidar data. 2009 IEEE Conference on Computer Vision and Pattern Recognition, IEEE, 2759–2766.
Zhou, Qian-Yi, Neumann, Ulrich, 2010. 2.5d dual contouring: A robust approach to creating building models from aerial lidar point clouds. ECCV.
Zhou, Qian-Yi, Neumann, Ulrich, 2012. 2.5 D building model-ing by discovermodel-ing global regularities. IEEE Conference on Computer Vision and Pattern Recognition, 16-21 June 2012, Providence, USA, 326–333.
Zhu, Lingjie, Shen, Shuhan, Gao, Xiang, Hu, Zhanyi, 2018. Large scale urban scene modeling from mvs meshes. Pro-ceedings of the European Conference on Computer Vision (ECCV), 614–629.