HAL Id: hal-03191372
https://hal.archives-ouvertes.fr/hal-03191372
Submitted on 7 Apr 2021
HAL is a multi-disciplinary open access
archive for the deposit and dissemination of
sci-entific research documents, whether they are
pub-lished or not. The documents may come from
teaching and research institutions in France or
abroad, or from public or private research centers.
L’archive ouverte pluridisciplinaire HAL, est
destinée au dépôt et à la diffusion de documents
scientifiques de niveau recherche, publiés ou non,
émanant des établissements d’enseignement et de
recherche français ou étrangers, des laboratoires
publics ou privés.
variability in the Mediterranean Sea: a first overview of
the HYDROCHANGES network
K. Schroeder, C. Millot, L. Bengara, S. Ben Ismail, M. Bensi, M. Borghini, G.
Budillon, V. Cardin, L. Coppola, C. Curtil, et al.
To cite this version:
K. Schroeder, C. Millot, L. Bengara, S. Ben Ismail, M. Bensi, et al.. Long-term monitoring programme
of the hydrological variability in the Mediterranean Sea: a first overview of the HYDROCHANGES
network. Ocean Science, European Geosciences Union, 2013, 9 (2), pp.301-324.
�10.5194/os-9-301-2013�. �hal-03191372�
Ocean Sci., 9, 301–324, 2013 www.ocean-sci.net/9/301/2013/ doi:10.5194/os-9-301-2013
© Author(s) 2013. CC Attribution 3.0 License.
EGU Journal Logos (RGB)
Advances in
Geosciences
Open Access
Natural Hazards
and Earth System
Sciences
Open AccessAnnales
Geophysicae
Open AccessNonlinear Processes
in Geophysics
Open AccessAtmospheric
Chemistry
and Physics
Open AccessAtmospheric
Chemistry
and Physics
Open Access DiscussionsAtmospheric
Measurement
Techniques
Open AccessAtmospheric
Measurement
Techniques
Open Access DiscussionsBiogeosciences
Open Access Open Access
Biogeosciences
DiscussionsClimate
of the Past
Open Access Open Access
Climate
of the Past
Discussions
Earth System
Dynamics
Open Access Open Access
Earth System
Dynamics
DiscussionsGeoscientific
Instrumentation
Methods and
Data Systems
Open Access
Geoscientific
Instrumentation
Methods and
Data Systems
Open Access DiscussionsGeoscientific
Model Development
Open Access Open Access
Geoscientific
Model Development
DiscussionsHydrology and
Earth System
Sciences
Open AccessHydrology and
Earth System
Sciences
Open Access DiscussionsOcean Science
Open Access Open Access
Ocean Science
DiscussionsSolid Earth
Open Access Open Access
Solid Earth
DiscussionsThe Cryosphere
Open Access Open Access
The Cryosphere
Discussions
Natural Hazards
and Earth System
Sciences
Open Access
Discussions
Long-term monitoring programme of the hydrological variability in
the Mediterranean Sea: a first overview of the HYDROCHANGES
network
K. Schroeder1,*, C. Millot2, L. Bengara3, S. Ben Ismail4, M. Bensi5, M. Borghini1, G. Budillon6, V. Cardin5,
L. Coppola7,8, C. Curtil9, A. Drago10, B. El Moumni3, J. Font11, J. L. Fuda2, J. Garc´ıa-Lafuente12, G. P. Gasparini1, H. Kontoyiannis13, D. Lefevre2, P. Puig11, P. Raimbault2, G. Rougier2, J. Salat11, C. Sammari4, J. C. S´anchez Garrido12, A. Sanchez-Roman12, S. Sparnocchia14, C. Tamburini2, I. Taupier-Letage2, A. Theocharis13, M. Vargas-Y´a ˜nez15, and A. Vetrano1
1CNR-ISMAR, Forte Santa Teresa, 19036 Pozzuolo di Lerici, La Spezia, Italy
2Aix-Marseille Univ., Mediterranean Institute of Oceanography (MIO), 13288 Marseille cedex 09, France; Universit´e du Sud Toulon-Var, 83957 La Garde cedex, France; CNRS/INSU, MIO ,UMR 7294, 13288 Marseille cedex 09, France; IRD, MIO, UR235, 13288 Marseille cedex, France
3Universit´e Abdelmalek ESSAADI, FP – Larache, Morocco
4Institut National des Sciences et Technologies de la Mer (INSTM), 28 rue 2 mars 1934 Salammbo, 2025, Tunisia
5Istituto Nazionale di Oceanografia e di Geofisica Sperimentale, Borgo Grotta Gigante, 42/c, 34010, Sgonico (Trieste), Italy 6Universit`a degli Studi di Napoli “Parthenope”, Dipartimento di Scienze per l’Ambiente, 80143 Napoli, Italy
7Universit´e Pierre et Marie Curie (UPMC), UMS829, Observatoire Oc´eanologique de Villefranche-sur-Mer, 06234 Villefranche-sur-Mer, France
8CNRS/INSU, UMS829, Observatoire Oc´eanologique de Villefranche-sur-Mer, 06234 Villefranche-sur-Mer, France 9CPPM, Aix-Marseille Universit´e, CNRS/IN2P3, Marseille, France
10Physical Oceanography Unit, IOI-Malta Operational Centre, University of Malta, Msida MSD08, Malta 11Institut de Ci`encies del Mar (CSIC), Passeig Mar´ıtim de la Barceloneta, 37–49, 08003, Barcelona, Spain 12Physical Oceanography Group, University of M´alaga, M´alaga, Spain
13Hellenic Centre for Marine Research, 46.7 km Athens-Sounio Avenue, 19013, Anavyssos, Greece 14CNR-ISMAR, Viale Romolo Gessi 2, 34123 Trieste, Italy
15Instituto Espa˜nol de Oceanograf´ıa, Centro Oceanogr´afico de M´alaga, Puerto pesquero s/n, 29640, Fuengirola, M´alaga, Spain
*now at: CNR-ISMAR, Arsenale – Tesa 104, Castello 2737/F, 30122 Venezia, Italy
Correspondence to: K. Schroeder (katrin.schroeder@ismar.cnr.it)
Received: 13 March 2012 – Published in Ocean Sci. Discuss.: 19 April 2012
Revised: 30 January 2013 – Accepted: 21 February 2013 – Published: 19 March 2013
Abstract. The long-term monitoring of basic hydrological parameters (temperature and salinity), collected as time se-ries with adequate temporal resolution (i.e. with a sampling interval allowing the resolution of all important timescales) in key places of the Mediterranean Sea (straits and channels, zones of dense water formation, deep parts of the basins), constitute a priority in the context of global changes. This led CIESM (The Mediterranean Science Commission) to
sup-port, since 2002, the HYDROCHANGES programme (www. ciesm.org/marine/programs/hydrochanges.htm), a network of autonomous conductivity, temperature, and depth (CTD) sensors, deployed on mainly short and easily manageable subsurface moorings, within the core of a certain water mass. The HYDROCHANGES strategy is twofold and develops on different scales. To get information about long-term changes of hydrological characteristics, long time series are needed.
But before these series are long enough they allow the detec-tion of links between them at shorter timescales that may pro-vide extremely valuable information about the functioning of the Mediterranean Sea. The aim of this paper is to present the history of the programme and the current set-up of the net-work (monitored sites, involved groups) as well as to provide for the first time an overview of all the time series collected under the HYDROCHANGES umbrella, discussing the re-sults obtained thanks to the programme.
1 Introduction
Due to its relatively small size and its geographical location, enclosed between continents, the Mediterranean Sea is very sensitive and responds relatively rapidly to atmospheric forc-ings and/or anthropogenic influences, compared to oceanic timescales. Demographic growth, climate change and over-exploitation of marine resources are exerting exceptional pressure on the Mediterranean environment, its ecosystems, services and resources. Further, it is a region where major oceanic processes occur, though on smaller scales than those occurring in the world ocean, as for instance the dense water formation (DWF) and the thermohaline circulation, known as the conveyor belt. For these reasons it has often been de-fined as an ideal test domain for climatic studies (e.g. Garrett et al., 1993). Significant long-term changes of the hydrolog-ical characteristics (potential temperature, θ , and salinity, S) have been reported during the last decades (since the 1960s) in both the Western Mediterranean (WMED) and the Eastern Mediterranean (EMED), essentially for the waters formed in-side the two basins and found at intermediate and deep levels (the Mediterranean Waters, or MWs), but also for the surface water of Atlantic origin (Atlantic Water, or AW).
This paper aims at presenting a review of the Mediter-ranean Sea variability by analysing hydrological time se-ries collected within different water masses all around the Mediterranean in the framework of the CIESM (Mediter-ranean Science Commission) HYDROCHANGES net-work (HC hereafter, http://www.ciesm.org/marine/programs/ hydrochanges.htm). Some of these time series have already been studied, entirely or partially, in a number of scientific papers, while others are presented and discussed here for the first time. For sure it is a novelty that all partners have concurred to provide an overall presentation of all series to-gether, giving a significant contribution to the understanding of the degree of variability, in space and in time, of hydro-logical properties on the long-term in the Mediterranean.
In this introductory section a review of the Mediterranean Sea functioning and its variability is given, and some issues related to the monitoring of long-term hydrological variabil-ity are discussed. In the remainder of the paper, we review the rationale behind the HC programme, as well as the his-tory and the present status of the network (Sect. 2). Sections 3
and 4 are dedicated to the presentation and the discussion of the observations collected so far in the HC framework. Sec-tion 5 points out improvements that are envisaged and pro-vides some concluding remarks.
1.1 Mediterranean Sea functioning and documented variability
The Mediterranean basin-wide thermohaline circulation cell is an open cell, driven by the net buoyancy flux toward the atmosphere that takes place over the sea: the thermohaline circulation starts in the Strait of Gibraltar with the inflow of AW and ends at the same site with an undercurrent of intermediate and deep MWs. Schematically, the AW enters the Mediterranean in the surface layer at Gibraltar, it fol-lows then an anticlockwise circuit in both basins, and is pro-gressively transformed into MWs in the northern parts of the sea during wintertime. Sooner or later these intermediate and deep waters end up exiting the Mediterranean at depth through Gibraltar. The upper branch that carries the AW to-wards the interior of the sea is a superposition of interact-ing large-scale and mesoscale patterns (e.g. Pascual et al., 2007), each of them showing their own variability (circu-lation schemes are given e.g. in Schroeder et al., 2012). In the lower branch the Levantine Intermediate Water (LIW), formed in the EMED, moves at intermediate depths, and is thus able to flow through the Sicily Channel into the WMED without major topographic constrictions. In addition, during milder winters the DWF areas see the formation of other in-termediate water masses (e.g. the Western Inin-termediate Wa-ter, WIW, and the Cretan Intermediate WaWa-ter, CIW, see Mil-lot, 2013) that participate in the lower branch circulation. The deep cells of the two basins are separated by the topography of the channel and driven by DWF processes in the north-ern parts of the sea: the Eastnorth-ern Mediterranean Deep Water (EMDW) is formed within the Adriatic or Aegean, while the Western Mediterranean Deep Water (WMDW) is formed in the northern WMED. The naming of these water masses (and others that will be mentioned throughout the paper) follows the recommendations given by CIESM (2001). All acronyms used in the paper are given in Table 1.
In the EMED, dramatic changes in the thermohaline prop-erties and circulation occurred during the late 1980s and early 1990s, when the location of the source of the EMDW shifted abruptly from the Adriatic subbasin to the Aegean subbasin (see e.g. Roether et al., 1996, 2007; Klein et al., 1999; Lascaratos et al., 1999). This event, known as the East-ern Mediterranean Transient (EMT) induced a change in the thermohaline properties and in the circulation of the Ionian subbasin (Malanotte-Rizzoli et al., 1997, 1999; Pinardi et al., 1997) leading to significant changes in the EMDW charac-teristics. The competition between the two sources of deep waters (Adriatic Deep Water, AdDW, and Cretan Deep Wa-ter, CDW) is presently favouring again the Adriatic as the main source of EMDW, producing denser water than the
Aegean. It is still controversial whether the EMT has been an unprecedented phenomenon or not, due to the scarcity of historical data sets, but Josey (2003) reported that similar strong heat flux anomalies occurred also during the 1970s. Recent studies (Rubino and Hainbucher, 2007; Roether et al., 2007; Cardin and Gaˇci´c, 2008; Cardin et al., 2011; Bensi et al., 2013) indicate a noticeable salt/heat increase in the in-termediate layer of the southern Adriatic between 2003 and 2008, favouring the formation of AdDW (and consequently EMDW in the Ionian abyssal plain), saltier and warmer than before and during the EMT. On the long-term, Tsimplis and Baker (2000) found statistically significant θ increas-ing trends in the deep Ionian and in the Levantine subbasins (0.002◦C yr−1 and 0.001◦C yr−1, respectively) at 3000 m from 1960 to 1991. At intermediate levels, Rohling and Bry-den (1992) reported an increase in S in the LIW in the Io-nian subbasin at a rate of 0.002 yr−1between 1909 and 1990 and of 0.005 yr−1between 1955 and 1990. Interestingly, in the eastern North Atlantic the same order of magnitude of S trends has been found in the Mediterranean outflow wa-ters (S increase of 0.0028 yr−1over the period 1955–1993) by Potter and Lozier (2004). It is still controversial whether this increase is caused by changes in the North Atlantic Cen-tral Water (NACW) or by actual changes in the source waters within the Mediterranean (Potter and Lozier, 2004).
In the WMED the steady increase of the surface layer temperature close to the Catalan coast has been documented through a 30-yr long time series of fortnightly observa-tions: 0.04◦C yr−1at the surface and 0.025◦C yr−1at 80 m depth (Pascual et al., 1995; CIESM, 2002). Long-term θ and S increases have been documented for the WMDW and for the LIW. In the deep layers these increases have been documented by various authors and for different pe-riods: 0.0016◦C yr−1/0.0008 yr−1 (1960–1995, Krahmann and Schott, 1998), 0.0027◦C yr−1/0.0019 yr−1(1969–1987, Leaman and Schott, 1991), 0.0035◦C yr−1/0.0011 yr−1 (1957–1997, B´ethoux et al., 1998), respectively for θ and S, to cite a few. Even stronger increases have been found in the Tyrrhenian Deep Water (TDW) by Fuda et al. (2002) (0.016◦C yr−1 and 0.008 yr−1 during the 1990s, for θ and S respectively). In the Ligurian subbasin in the layer oc-cupied by the LIW core (300–400 m), B´ethoux and Gen-tili (1996) detected a θ increase of ∼ 0.0068◦C yr−1and a S increase of ∼ 0.0018 yr−1 (1960–1992), the latter being in accordance with the estimates for the EMED by Rohling and Bryden (1992) mentioned above. More recently, Millot et al. (2006) described a warming and salinification of the Mediterranean outflow waters, which in early 2000s were 0.3◦C warmer and 0.06 saltier than in early 1980s. Finally, since 2005 the deep waters of the WMED have experi-enced significant physical changes, which are comparable to the EMT, both in terms of intensity and observed ef-fects (Schroeder et al., 2008). The production of high vol-umes of anomalously warm and salty new deep water dur-ing the winters 2004/2005 and 2005/2006 uplifted the old
Table 1. List of acronyms used in the paper.
Acronym Meaning
AdDW Adriatic Deep Water
ANTARES Astronomy with a Neutrino Telescope and Abyss environmental RESearch
AW Atlantic Water
CAS Camarinal Sill
CC Corsica Channel
CCC Cap de Creus Canyon
CDW Cretan Deep Water
CS Catalan slope
CT Conductivity-Temperature CTD Conductivity-Temperature-Depth DWF Dense Water Formation
DYFAMED Dynamique des Flux Atmosph´eriques en Mediterran´ee
EMDW Eastern Mediterranean Deep Water EMED Eastern Mediterranean
EMT Eastern Mediterranean Transient EOW Eastern Mediterranean Overflow Water
ES Espartel Sill
GOL Gulf of Lion
HC HYDROCHANGES
JGOFS Joint Global Ocean Flux Study LIW Levantine Intermediate Water MBT Mechanical Bathythermograph
MEDAR/MEDATLAS Mediterranean Data Archaeology and Rescue MedARGO Mediterranean ARGO program
MOW Mediterranean Outflow Water
MS Moroccan Shelf
MW Mediterranean Waters
NACW North Atlantic Central Waters NAdDW North Adriatic Dense Water
S Salinity
SBE Sea-Bird Electronics
SC Sardinia Channel
TDW Tyrrhenian Deep Water
TMW Transitional Mediterranean Waters WMED Western Mediterranean
XBT Expendable Bathythermograph
θ Potential Temperature
WMDW by several hundreds of meters in almost the whole western basin, inducing an abrupt increase in the deep heat and salt contents, thus resulting in a change in the deep stratification. The described changes were proposed by the group of researchers gathered at the CIESM workshop no. 38 to be referred to as the Western Mediterranean Transition (WMT), in order to avoid confusion with the better known EMT (CIESM, 2009). Data collected between 2004 and 2006 showed that in this period the deep layer of the WMED ex-perienced a θ increase of ∼ 0.038◦C and a S increase of ∼0.016 (Schroeder et al., 2008). These increases are five to seven times greater than the increasing trends indicated by B´ethoux and Gentili (1999) and about four times greater than the estimates given for the 1985–2000 period by Rixen et al. (2005). These figures highlight the importance and the ex-ceptional character of the 2004/2005 and 2005/2006 events, but also show how interannual variability can induce θ –S changes several times stronger than those associated to long-term changes.
This fact reinforces the necessity of obtaining long-term series.
In general it is postulated that the majority of these changes and trends should be attributed to changes in the hydrological cycle and air–sea fluxes, and/or to the reduced river runoff as a consequence of human intervention (Lea-mann and Schott, 1991; Rohling and Bryden, 1992; Krah-mann and Schott, 1998; Send et al., 1999; CIESM, 2009). Further, up to the early 2000s, the hypotheses about the causes of trends in the MWs were based on the assump-tion that the AW inflow at Gibraltar was not undergoing any properties change, and trends were attributed only to cli-matic and anthropogenic influences inside the Mediterranean Sea. Even if Krahmann and Schott (1998) reported a S in-crease of the upper layer in the northern WMED, they at-tributed it to “local” causes (decrease of precipitations and river runoff), rather than to “upstream” changes (in the At-lantic and at Gibraltar). But the salinification of the AW in-flow (see Sect. 3.1) observed thanks to HC data suggests that both causes need to be explored jointly (Millot, 2007). In-deed, the monitoring of the characteristics of the inflowing AW, which strongly modulates the Mediterranean circula-tion and DWF processes, should be included in any obser-vational network, but both dynamical and topographic limi-tations make the long-term monitoring in this area a difficult task.
1.2 Issues about monitoring hydrological variability Most of the past studies about hydrological variability rely on ship-based CTD or even bottle sample observations being operated only in specific places and on a monthly (at best) to annual basis. The data available since the beginning of the last century (e.g. Painter and Tsimplis, 2003) revealed that the sea has witnessed interannual and decadal variabil-ity as well as abrupt changes. Different timescales were thus involved in those processes. In the light of the above men-tioned changes and trends, it is clear that the Mediterranean Sea is a highly sensitive, fast-reacting system. Indeed, the whole Mediterranean region has been defined as a “hot-spot” for climate change (Giorgi, 2006), as numerical model pro-jections (2080–2099 minus 1960–1979) indicate pronounced mean warming (surface air temperature), large decrease in precipitation, and increase in precipitation variability during the dry (warm) season. This is another reason why it is of much interest to study the evolution of water masses in this region in response to such climatic changes, as well as to im-prove knowledge about the general functioning of the sea, its internal feedback mechanisms and specific processes.
The coexistence of different temporal and spatial scales in the ocean–atmosphere system makes it difficult to anal-yse oceanographic time series and to detect trends, since the number of long oceanic instrumental time series is much smaller and scattered in time and space than for meteoro-logical observations. Long time series are practically
lim-ited to tide gauge data. In general, the lack of long-term records precludes a more profound knowledge of the marine response to the climatic forcings. Oceanographic trends are thus usually estimated by using CTD data, which are highly scattered in time and space. This implies that the resulting trend estimates can be very different, depending on the pe-riod considered (i.e. the first and the last point in a time series), the place, the depth interval used and so on. Fur-ther limitations in the use of time- and space-scattered (ship-handled CTD) data for trends estimates are: (i) the sensitivity of results to data analysis methods in the case of scarce data sets (Vargas-Y´a˜nez et al., 2009); (ii) difficulty in detecting trends in shallow waters or in the surface layer, where short term variability is high and seasonal cycles are difficult to remove (Vargas-Y´a˜nez et al., 2009); (iii) difficulty to prop-erly estimate important statistical parameters, such as data significance and covariance between data sets, due to large gaps in time series; (iv) difficulty in comparing trends esti-mated in different places and/or different periods (Millot et al., 2006), preventing an analysis of propagation of signals through the sea (in terms of phase lags between time series); (v) high expensiveness of the experimental strategy, in terms of costs and logistics, preventing the measurements to be per-formed on e.g. a weekly basis, except for coastal regions (Pascual et al., 1995); (vi) instrumental biases in tempera-ture time series (Vargas-Y´a˜nez et al., 2010). Feedback mech-anisms regulating the connections between climate, circula-tion and marine ecosystems, and possible alteracircula-tions under future climate scenarios are not yet well understood. In addi-tion, several Mediterranean areas, mainly its southern parts, are widely undersampled (and some of them have never been sampled), due to historical-political difficulties, as well as to financial and logistic constraints. This is a serious limit, given the importance of intense mesoscale dynamics in these ar-eas, which makes the interpretation of data from monitoring programs even more difficult (Millot and Briand, 2002), and prevents reliable trend detection from episodic and sparse ob-servations (e.g. Millot and Taupier-Letage, 2005).
Even though the task of investigating the long-term variability of hydrological properties by using shipboard CTD data was greatly aided by an EU coordinated ac-tion, MEDAR-MEDATLAS (Mediterranean Data Archae-ology and Rescue), which managed to facilitate access to the dispersed CTD data sets together with data from bot-tles, expendable bathythermograph (XBT) and mechani-cal bathythermograph (MBT) probes and developed a joint comprehensive database of oceanographic data (1900–2002, Mediterranean and Black Sea) (MEDAR Group, 2002), this data set was basically not very suitable to specify long term variations (scarcity of data, high noise levels). Neverthe-less these data provide useful information about long term changes in the past, some of them have been enumerated above and can be summarised as the warming and salinifica-tion of deep waters and the salinity increase of intermediate waters both in the eastern and western Mediterranean.
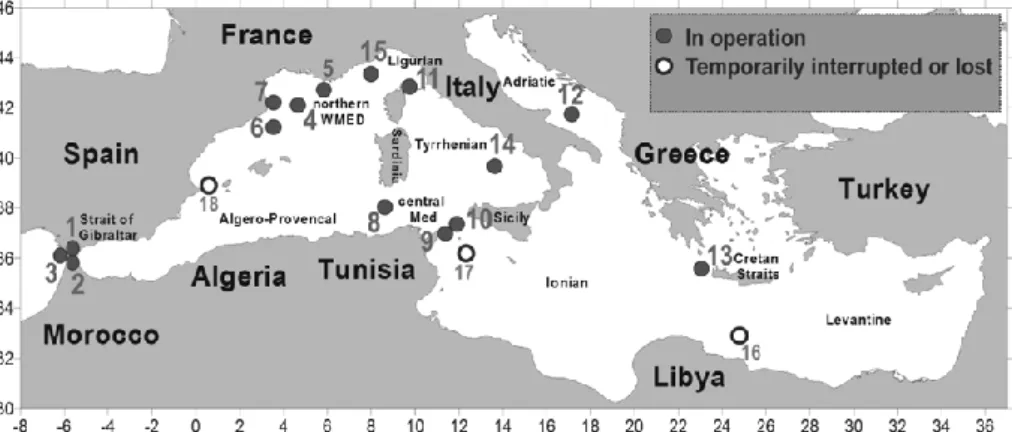
Fig. 1. Present status of the HYDROCHANGES network. The numbers refer to details of each site, which are listed in Table 2: involved institutes, position, time frame, instruments and measured parameters for each depth.
2 Data and methods
The limitations listed in paragraph 1.2 were the main rea-son for the proposal of a CIESM coordinated workshop in 2002 (CIESM workshop no. 6, Monaco, April 2002) enti-tled “Tracking long-term hydrological change in the Mediter-ranean” (CIESM, 2002). During the workshop, more than 30 scientists from 12 countries found a general agreement that the monitoring of hydrological long-term variability needed a coordinated action having a twofold objective, i.e. to bet-ter specify trends in different regions all over the sea and to better understand the major processes of the sea function-ing. In the definition of a common strategy some priorities had to be defined, since a regular monitoring of the climate system cannot be applied to all temporal and spatial scales over the whole Mediterranean, and not all parameters can be monitored. The adopted HC strategy has been the con-tinuous monitoring of key sites. It has been recognized that permanently collecting time series at some specific places, even if in a relatively limited number, was the sole strat-egy that clearly would allow comparisons and thus infer-ences about the propagation of signals, the circulation and the functioning of the sea.
HC has become over the years one of the emblematic CIESM programmes, as it well reflects key characteristics of the Commission’s engagement: limited but guaranteed fund-ing over a long-term horizon, donation and maintenance of material (CTDs in this case) provided to developing Mediter-ranean countries, north–south cooperation with continuous capacity building (training of local engineers and physicists), cross-basin scale with a gradual but sure extension of the net-work towards eastern and southern waters, in-depth discus-sion of HC at each CIESM Congress, etc.
With the focus on trend detection, the HC coordinated ac-tion is thus aimed at (i) addressing problems on the long term (i.e. the action should continue over decades), (ii) focusing on temporal variability, using eulerian data at few selected key locations and from the surface layer down to the greatest
depths, (iii) achieving the necessary time and space resolu-tions (i.e. to resolve all important variaresolu-tions, at least in time), which requires autonomous instrumentation collecting data at high temporal resolution over decades in as many places as possible (a sort of sea-wide experiment), (iv) using instru-mentations as inexpensive and simple as possible (CIESM, 2002). The strength of this type of measurements, which complement other existing components of the global ocean observing system (e.g., ARGO, gliders, satellites, ship-based hydrology, XBTs, integrated coastal observing systems) are the high temporal resolution (which allows to resolve events and abrupt variations and processes), the possibility to make measurements in locations that otherwise would be difficult to perform with mobile platforms (such as straits and bound-ary currents), and the maintenance of a long-term presence in those sites, since sustained eulerian long time series are considered the most powerful tool for the identification of climate change effects (Send et al., 2010).
2.1 Present status and monitored sites
At present day, nine years after the beginning of the pro-gramme, the HC network involves up to 15 fully operational mooring sites, three temporarily interrupted or lost moor-ings and one foreseen in the Algerian subbasin. The list in-cludes two new sites that have joined the HC network in sum-mer 2010. There are 12 involved institutes from six countries around the Mediterranean Sea. The synthesis of the present network status is given in Table 2 and Fig. 1. As can be seen from Table 2, some regions have been monitored, with-out interruption, well before the start of the HC programme. Soon after the initial CIESM workshop of 2002, the first two moorings under the HC umbrella were deployed at Gibral-tar to monitor the inflowing and outflowing water masses (January 2003) in the framework of a collaboration between the Service Hydrographique et Oc´eanographique de la Ma-rine Royale du Maroc (SHOMAR) and the French CNRS – Centre d’Oc´eanologie de Marseille (CNRS/COM). Shortly
Table 2. Contributing institutes and details of the monitored sites.
ID Institute/Group (country)/ Site (lon, lat) Period Bottom depth/ Installed instruments (depth) – Point of contact Acronym used in figures mooring length measured parameters
(∗indicates which data are plotted in figures) 1 SHOMAR&CNRS/COM (Morocco, France)/ Camarinal Sill – Gibraltar, Jan 2003– 270 m/10 m ∗SBE37 (270 m) – temperature,
Bouchta El Moumni, Lahoucine Bengara, (35◦55.20N, 5◦44.90W) CAS present conductivity Gilles Rougier, Isabelle Taupier-Letage
2 SHOMAR&CNRS/COM (Morocco, France)/ Moroccan shelf – Gibraltar Jan 2003– 80 m/10 m ∗SBE37 (80 m) – temperature, Bouchta El Moumni, Lahoucine Bengara, (35◦52.9 N, 5◦43.60W) MS Oct 2008 conductivity
Gilles Rougier, Isabelle Taupier-Letage
3 University of Malaga, UMA (Spain)/ Espartel Sill – Gibraltar Oct 2004– 360 m/15 m ADCP RDI LR (345 m) – current profile Jesus Garc´ıa-Lafuente (35◦51.720N, 5◦58.590W) ES March 2011 NORTEK Aquadopp (352 m) – current
∗SBE37 (356 m) – conductivity, temperature 4 CNRS/COM (France)/Gilles Rougier, Gulf of Lion Oct 2006– 2400 m/10 m ∗SBE37 (2400 m) – temperature, conductivity MORS
Isabelle Taupier-Letage (41◦59.00N, 04◦550E) GoL present currentmeter (2400 m) – current 5 ANTARES Group (France)/Christian Offshore Toulon Dec 2007– 2500 m/350 m ∗SBE37 (2200 m) – temperature, conductivity
Tamburini, Dominque Levefre (42◦450N, 6◦100E) ANTARES present SBE37 (2290 m) – temperature, conductivity RCM8 (2300 m) – current, temperature, conductivity ADCP (2400 m) – current profile
6 ICM-CSIC (Spain)/ Jordi Font, Catalan Slope Oct 2003– 1890 m/30 m ∗SBE 37 (1875 m) – temperature, conductivity Pere Puig, Jordi Salat (41◦28.00N, 03◦40.40E) CS present RCM8 (1878 m) – current, temperature, conductivity
RCM11 (1881 m) – current, temperature, conductivity 7 ICM-CSIC (Spain)/ Cap de Creus Canyon Nov 2003– 315 m/15 m ∗RCM9 (310 m) – current, temperature,
Pere Puig (42◦23.40N, 3◦19.30E) CCC present conductivity, turbidity
8 INSTM&CNRS/COM (Tunisia, France)/ Sardinian Channel Jul 2003– 1900 m/10 m ∗SBE37 (1900 m) – temperature, conductivity Cherif Sammari, Ben Ismail (2012) (38◦20.0470N, 09◦19.9590E)SC present RCM8 (1900 m) – current, temperature,
conductivity
9 CNR-ISMAR (Italy)/ Sicily Channel Since 1993 530 m/273 m NORTEK Aquadopp (400 m) – current Katrin Schroeder, Mireno Borghini (37◦17.1200N, 11◦30.0190E) C02 SBE37 (395 m) – temperature, conductivity
RCM7 (300 m) – current, temperature, conductivity ADCP NORTEK Continental (250 m) – current profile 10 CNR-ISMAR (Italy)/ Sicily Channel Since 1993 450 m/365 m ADCP RDI WH (415 m) – current profile
Katrin Schroeder, Mireno Borghini (37◦22.8360N, 11◦35.6360E) C01 ∗SBE37 (387 m) – temperature, conductivity SBE37(82 m) – temperature, conductivity 11 CNR-ISMAR (Italy)/Katrin Schroeder, Corsica Channel Since 1985 440 m/370 m RCM7 (410 m) – current, temperature, conductivity
Mireno Borghini (43◦02.0210N, 9◦41.1540E) CC RCM9 (320 m) – current, temperature *SBE37 (400 m) – temperature, conductivity RCM9 (70 m) – current, temperature
12 OGS (Italy)/ Southern Adriatic Nov 2006– 1204 m/840 m ADCP RDI BB (before: 265 m/after: 360 m) – current Vanessa Cardin (41◦500N, 17◦450E) present ∗SBE19 (364 m) – temperature, conductivity, turbidity, oxygen
∗
SBE37 (564 m) – temperature, conductivity
*SBE19 (764 m) – temperature, conductivity, turbidity, oxygen ∗SBE37 (1014 m) – temperature, conductivity
∗SBE37 (1172) – temperature, conductivity RCM11 (1182 m) – current, temperature, turbidity 13 HCMR (Greece)/ Antikythira Strait Nov 2007–May 2009 & 870 m/15 m ∗SBE37(850 m) (temperature,
Harilaos Kontoyiannis (35◦36.6’ N, 23◦31.8’ E) Jun 2010–Nov 2010 conductivity, pressure)
14 DiSAm, CNR-ISMAR, ENEA-UTMAR, Central Tyrrhenian Aug 2010–present 3410 m/1650 m *SBE37 (3380 m) – temperature, conductivity CONISMA (Italy)/ (39.4994◦N, 13.4765◦E)present TYR RCM11 ( 3370 m) – current, temperature
Katrin Schroeder, Giorgio Budillon *SBE39 (2524) - temperature
RCM7(1774 m) – current, temperature, conductivity 15 Observatoire Oceanologique de Ligurian subbasin Jun 2009– 2350 m/2200 m SBE37 (200m) – temperature, conductivity
Villefranche-sur-mer (France)/Laurent Coppola (43.4185◦N, 7.903◦E) DYF present *SBE37 (700m) – temperature, conductivity SBE37 (1000 m) – temperature, conductivity *SBE37 (2000 m) – temperature, conductivity RBR (170 m) – temperature
RBR (350 m) – temperature RBR (500 m) – temperature Aquadopp (200 m) – current, temperature Aquadopp (1000m) – current, temperature 16 COM/LOB (France)/Gilles Rougier, South-western Levantine April 2006– 3226 m
Isabelle Taupier-Letage (32.2967◦N, 25.6018◦E) March 2007 17 INSTM&CNRS/COM (Tunisia, France) Central Sicily Channel
18 IEO (Spain) Ibiza Channel
after, in July 2003, the Tunisian Institut National des Sci-ences et Technologies de la Mer (INSTM), with the support of CNRS/COM staff, deployed two deep moorings, in the Sardinia Channel at 1900 m as well as in the central part of the Sicily Channel at 1200 m depth (now lost), to moni-tor the exchanges between the two Mediterranean basins. In
the same year (October–November 2003) the DWF area in the northern WMED started to be monitored with a moor-ing on the lower part of the Catalan slope (at 1890 m) and another one (at 315 m) in the upper part of the Cap de Creus Canyon, by the Spanish Institut de Ci`encies del Mar (ICM-CSIC). A third mooring at Gibraltar was deployed
further west (Espartel Sill) in October 2004 by the Uni-versity of Malaga (UMA), to monitor the variability of the outflowing MWs in the main channel of this section (at 360 m). The CNRS/COM also initiated a monitoring site in the Gulf of Lion in October 2006, which is providing complementary results to the ICM-CSIC data. The impor-tance of this DWF region is evidenced by the fact that a third mooring has started operating there in December 2007; through its collaboration with CNRS/COM, the ANTARES (Astronomy with a Neutrino Telescope and Abyss envi-ronmental RESearch, see ANTARES Collaboration, 2006) collaboration participates in the CIESM HC programme. Most of the HC monitoring sites are located in the WMED. Presently in the EMED, the Italian Istituto Nazionale di Oceanografia e di Geofisica Sperimentale (OGS) operates a mooring site in the southern Adriatic, a DWF region as well, since 2002 (continuously since November 2006), while the Greek Hellenic Centre for Marine Research (HCMR) de-ployed a mooring in the Antikithira Strait in November 2007. A one-year time series was recorded off Libya, in the south-western Levantine subbasin (3226 m depth) from April 2006 to March 2007 by CNRS/COM (Taupier-Letage et al., 2007). Recently (summer 2010), two more mooring sites joined the HC network: one in the Ligurian subbasin (2350 m, close to the DYFAMED site), managed by the French Observa-toire Oceanologique de Villefranche-sur-mer, and one in the central deep Tyrrhenian (3410 m), a region where the wa-ter of easwa-tern origin cascades to great depths and contributes to the formation of the TDW. This latter mooring is man-aged jointly by the Italian groups at DiSAm (Department of Environmental Sciences of the “Parthenope” University of Naples), CNR-ISMAR, and ENEA-UTMAR (Technical Unit for Marine Environment and Sustainable Development of the Italian National Agency for New Technologies, Energy and Sustainable Economic Development).
Presently (Fig. 1 and Table 2) there is good spatial cover-age of key regions, especially in the WMED, while only two site are fully operational in the EMED. Besides this E–W im-balance, there are other key regions that should be included in the network, in order to be more representative and useful for the description of the sea functioning and the understand-ing of its long-term variability. Those issues are detailed in Sect. 5 and represent future commitments for the HC com-munity.
2.2 Instruments and data processing
The basic HC strategy is to employ relatively inexpensive, autonomous instruments, which are highly performing in terms of accuracy, resolution, stability, memory and energy consumption, to constitute a network of autonomous oceano-graphic stations with a wide geooceano-graphical coverage of the Mediterranean Sea (CIESM, 2002), placing CTDs in key re-gions, on short and easily manageable subsurface moorings. Ship-based CTDs are still necessary to provide information
on the spatial distribution of temperatures and salinities in the moorings’ surroundings. Since HC aims at evidencing trends that are of the order of O (0.001–0.01) per year, the great-est care must be taken for θ (and S) measurements. There-fore the HC quality requirement is to employ SBE37 Mi-croCATs manufactured by Sea-Bird Electronics (Bellevue, Washington, USA; www.seabird.com/products/spec sheets/ 37sidata.htm) to measure temperature, conductivity and (op-tional) pressure (Table 2). The SBE37 MicroCAT is a high-accuracy temperature and conductivity sensor, very stable in time, with an optional pressure gauge. A pressure gauge is very important for the accurate determination of hydrolog-ical long-term variability. For instance, for the computation of salinity a pressure difference of 10 dbar (which is of the order of the uncertainty about the actual immersion of moor-ings, especially on varying bathymetry) may cause a salinity difference of ∼ 0.004. Constructed of titanium and other non-corroding materials to ensure long life with minimum main-tenance, the MicroCAT’s depth capability is 7000 m. The Mi-croCAT’s unique internal-field conductivity cell permits the use of expendable anti-foulant devices, which is of the ut-most importance to guarantee the good quality of conduc-tivity data especially for shallow moorings. The aged and pressure-protected thermistor has a long history of excep-tional accuracy and stability.
The accuracy of the MicroCAT is sustained by the care and periodic calibration of the sensors and by establishing proper handling practices, respecting the manufacturer’s recommen-dations. The primary source of temperature sensor drift is the aging of the thermistor element. Sensor drift will usually be a few thousandths of a degree during the first year, and less in subsequent intervals. Sensor drift is not substantially depen-dent upon the environmental conditions, and the thermistor is insensitive to shock. All sensors are calibrated by the manu-facturer, coefficients are then computed, which are used with appropriate algorithms to obtain engineering units. The con-ductivity and temperature sensors on the MicroCAT are sup-plied fully calibrated. Each HC partner is then responsible for the successive calibrations, ideally on a yearly basis (or less, if maintenance is more frequent). Recalibrations are made ei-ther in at home calibration baths or returning the sensor reg-ularly to the manufacturer. The new calibration coefficients are then applied to the time series between two successive calibrations. Even though there is not a common data for-mat established between the partners, all data are processed following common recognized post-processing QA/QC pro-cedures, which make them extremely reliable. Furthermore, flags are assigned according to domain criteria specified for each parameter as well as by visual inspection of data values and scatter/line plots.
The data that are presented in the following section have not been time-averaged. The original acquisition frequency (ranging from 15 minutes to 1 h, depending on the site) has been used for representing the time series.
Fig. 2. Location of the three monitoring sites at Gibraltar (ES = Espartel Sill; CAS = Camarinal Sill; MS = Moroccan Shelf).
3 Results
Key regions presently monitored in the HC framework in-clude straits, channels, DWF areas, the deeper parts of vari-ous subbasins and the continental rise. In this section we pro-vide an overview of all HC θ time series collected in different parts and depths of the Mediterranean Sea, generally in the core of a certain water mass. In all cases the temporal reso-lution of the records, spanning from minutes to a few hours, is well suited to resolve the scales of variability of concern here (long-term, interannual variability) The presentation is mainly devoted to θ (S is not shown, with the exception of the AW at Gibraltar), as not all sites have post-calibrated S data yet (and pressure data, allowing an accurate computa-tion of salinity from conductivity data are not available for all sites).
At each mooring site the partners have deployed au-tonomous CTDs, often accompanied by current meters (Ta-ble 2). The relevant amount of data has been in part ex-ploited scientifically, also linking them with repeated CTD sections (Gasparini et al., 2005; Vargas-Y´a˜nez et al., 2005, 2009, 2010; Millot et al., 2006; Millot, 2007, 2009; Palan-ques et al., 2006, 2009, 2012; Garc´ıa-Lafuente et al., 2007, 2009, 2011; Font et al., 2007; CIESM, 2008, 2009; Puig et al., 2008, 2013; S´anchez-Rom´an et al., 2009; Millot and Garc´ıa-Lafuente, 2011; Rib´o et al., 2011). There are evi-dences of interannual θ and S variability in different water masses, even though most of the HC time series are still too short to significantly address issues on long-term variability and trends. Nevertheless, the results are encouraging and are providing new insights on the functioning of the sea. Obser-vations collected till now in each site are described in the following, while an attempt to link different time series is done in Sect. 4.
3.1 The Strait of Gibraltar
Deploying and maintaining long-term moorings in this re-gion, “the key-place” to monitor the overall functioning of the Mediterranean Sea, presents some specific difficulties,
due to the complex topography, the bio-fouling, the presence of strong tidal currents that reverse the inflow and/or the out-flow in many places of the strait (Candela et al., 1990; Bry-den et al., 1994; Garc´ıa-Lafuente et al., 2000), as well as the remarkable internal tide that strongly distorts what is basi-cally a two-layer exchange, through mixing processes often reaching the bottom in the whole strait.
As already discussed, the inflowing AW directly condi-tions the properties of the water masses involved in the Mediterranean Sea circulation (MW), in DWF processes and finally in the Mediterranean Outflow Waters (MOW). Moni-toring AW should therefore be considered a necessity for all analyses dealing with trends in the sea and thus be included in any observational network (Millot and Briand, 2002). This is why the first HC mooring was deployed in 2003 at 80 m on the Moroccan Shelf (MS, Fig. 2), a convenient place due to an AW–MOW interface generally sloping down southward.
To monitor MOWs, two favourable sites are the Camarinal and Espartel sills (CAS and ES in Fig. 2), which have advan-tages for the monitoring purpose and display some similari-ties (Garc´ıa-Lafuente et al., 2007). Bray et al. (1995) showed that the greatest AW vs. MOWs contrast is at CAS, which points at this sill as the best place for monitoring the two-layer exchange. On the other hand, experimental (Farmer and Armi, 1988; S´anchez-Rom´an et al., 2009) and numeri-cal (Castro et al., 2004; Sannino et al., 2004, 2009; S´anchez-Rom´an et al., 2009) studies suggest that hydraulic control on MOW is a rather permanent feature at ES, which is the last topographic constriction before they sink in the ocean down to ∼ 1000 m (Baringer and Price, 1997; Ambar et al., 2002), while at CAS the hydraulic control is lost almost every tidal cycle. This hydraulic behaviour gives ES practical advan-tages to compute the volume transport using a single mooring line. Thus, HC moorings were deployed at both sites, near the southern sill at CAS on a small plateau at 270 m (since its deepest part at 290 m is steeply V-shaped), and at the south-ern sill at ES (350 m). However, it must be emphasized that the MOW outflowing in the northern part of the strait are to-tally missed (Millot, 2013).
For AW, Fig. 3 (adapted from Millot, 2007) shows a marked seasonal variability of S (amplitude ∼ 0.5, maximum in winter), due to air–sea interactions, and a remarkable inter-annual salinification during 2003-2007 (about ∼ 0.05 yr−1, according to Millot, 2007). This fact reflects (according to Millot, 2007) the marked variability evidenced in the nearby ocean (e.g. Reverdin et al., 2007) and cannot be extrapolated to the evolution of AW in the long-term. Since it was ob-served at the very beginning of the HC experiment, it clearly validates the HC strategy and questions (as expected by Mil-lot and Briand, 2002) bulk analyses that, more or less ex-plicitly, assume a constant salt content within the sea (e.g. B´ethoux et al., 1998; Rohling and Bryden, 1992).
The MOW seasonality in the strait is still a debated ques-tion. Some authors (e.g. Garc´ıa-Lafuente et al., 2007) claim that the MOW leaving the sea is relatively warm and light
Fig. 3. S time series of the AW (at 80 m) on the MS (west of Gibraltar). The black dots represent the lowest S value during each semi-diurnal (12 h) cycle.
in early winter and cooler and dense in late spring and sum-mer, with amplitudes of 0.05◦C and 0.015 kg m−3for θ and potential density, respectively. The θ minimum, occurring usually in April, is also accompanied by a MOW maximum transport. On the contrary, Millot (2009) assumes that the MOW entering the strait does not display any significant sea-sonality until it starts mixing with AW. Whatever the case, Millot and Garc´ıa-Lafuente (2011) showed that tidal mix-ing with the seasonally variable AW within the strait induces seasonal and fortnightly variability in the MOW. Millot et al. (2006) showed that in the early 2000s the MWs at CAS was ∼ 0.3◦C warmer and ∼ 0.06 saltier than in the 1980s and earlier. They hypothesized that this was due to changes in the MOW composition, with waters originated in the east-ern basin representing, in the early 2000s, higher percentages than those originated in the western basin, maybe as a con-sequence of the EMT. At CAS, this mainly results in sam-pling TDW more often than WMDW. A different explana-tion was given by Garc´ıa-Lafuente et al. (2007, 2009) who suggest that the observed variability derives from the differ-ent properties of the dense waters located at the maximum depth from where they can be uplifted and aspired through the strait. That depth is roughly located in the transitional layer between LIW and WMDW in the Alboran subbasin (Parrilla et al., 1986; Kinder and Bryden, 1990), so that any vertical displacements of this layer would change the θ –S characteristics of the aspired water. This explanation em-phasizes another debated feature since Millot (2009) ques-tions the necessity to invoke any aspiration process. Indeed, when the newly formed, relatively dense WMDW sinks to the bottom, it uplifts all other waters in the western basin: should WMDW be the sole water in such a basin, the old-est WMDW would thus be naturally uplifted, year after year, up to the sill at CAS.
Garc´ıa-Lafuente et al. (2007) showed a rather similar be-haviour of θ at CAS and ES with a correlation coefficient of 0.94 and a quite constant difference of 0.107 ± 0.021◦C (see Fig. 4), indicating similar fluctuations ranges for tide-filtered data at both sills. The similarity is striking in March 2005 and February 2006, when the same sharp θ decrease is registered simultaneously at both sills. Further, MOW at ES is fresher (not shown) and warmer (Fig. 4) than at CAS, due to the progressive mixing in the Tangier Basin with ei-ther NACW (Garc´ıa-Lafuente et al., 2011) or Surface At-lantic Water (SAW) (Millot, 2013). It is now demonstrated (Millot and Garc´ıa-Lafuente, 2011) that AW–MOW mixing lines (dθ /dS) inferred from the tide-filtered time series gener-ally show similar slopes at both CAS and ES (between −0.7 and −1.7◦C), and that the temporal variability of MOW characteristics increases westwards. Since the MWs entering the strait display marked spatial heterogeneity and long-term temporal variability, accurately predicting the characteristics of the MOW into the North Atlantic Ocean appears almost impossible (Millot and Garc´ıa-Lafuente, 2011).
3.2 The northern WMED
The northern part of the western basin is the region of WMDW formation, which may occur either over the shelf (dense shelf water cascading) or in the open sea (deep con-vection). Circulation in the northern WMED is cyclonic with an along-slope current (the Northern Current, see Mil-lot and Taupier-Letage, 2005, for a review) showing in-tense mesoscale activity. Beyond this area, offshore, there is a central less dynamic zone, known as MEDOC area (MEDOC Group, 1970), where the surface salinity is higher than in the rest of the northern WMED because of a pos-itive E − P − R (evaporation–precipitation–runoff) budget.
Fig. 4. θ time series of the MW outflow at CAS (grey dots, at 270 m) and at ES (black dots, at 356 m).
Fig. 5. Location of the four monitoring sites in the north-western Mediterranean (CCC = Cap de Creus 39 Canyon; CS = Catalan slope; GoL = Gulf of Lion, at the centre of the offshore DWF area; ANTARES = ANTARES mooring).
The cyclonic circulation favours low stability in winter en-abling the doming of LIW. Once the surface mixed layer is dense and thick enough, bursts of cold, dry northerly winds may trigger deep convection producing the new deep water (open sea convection). Conversely, over the wide shelf of the Gulf of Lion and adjacent areas, E − P − R values are usu-ally lower or even negative because of large river runoff. De-spite its low salinity, the cooling of a relatively thin layer of coastal water is sufficiently large to induce a density in-crease, which eventually is high enough to force the water to sink over the shelf, overfill the shelf-edge and flow down the continental slope, in a process known as cascading, until they reach their density equilibrium at a depth depending on both the severity of the cooling event and the initial θ –S proper-ties of the coastal waters. Cascading events are characterized by abrupt decreases in water θ associated with increases in current speed. DWF in the northern WMED is thus the re-sult of highly variable phenomena, which in turn depend on a number of interacting processes, as e.g. air–sea heat ex-changes, extreme winds, river discharges, general cyclonic circulation. Such complexity as well as the violent water mo-tions involved, short episodes with high velocities, make this
phenomenon difficult to study. Oceanographic cruises can-not be programmed rapidly enough to sample the area at the right moment, and sea conditions can be difficult even for larger ships, so that at best they may provide a certain degree of spatial coverage but lack in temporal resolution. Historical campaigns in the area have focused on convection and not on cascading, which might have been observed only by chance. Thus the HC recorded time series may also provide the op-portunity to fully investigate the occurrence of episodes of DWF, both by cascading and open convection. The need of high temporal sampling to resolve events and rapid processes is addressed by the use of moorings located in specific areas where DWF is known to occur. Although the primary goal of HC is to monitor long-term variability, recent results demon-strated the relevance of the strategy also for accurately de-tecting, characterizing and monitoring DWF processes and their effects. This has been particularly evident in the rela-tively short history of the four monitoring sites in the north-ern WMED (Table 2 and Fig. 5). Winter 2004/2005 was cer-tainly anomalous and very favourable for DWF in the region, both by cascading and open sea convection (Canals et al., 2006; Font et al., 2007; Puig et al., 2008; Palanques et al., 2009; CIESM, 2009).
Figure 6 summarizes the θ records at the four sites: the Cap de Creus Canyon (CCC), the Catalan slope (CS), the Gulf of Lion (GoL) in the centre of the open sea DWF area and the ANTARES site. It is noteworthy that different scales had to be used to highlight the variability observed at each mooring: 10–14◦C was necessary for CCC, 12.5–13◦C for CS, 12.84-12.92◦C for GoL, and 12.88–12.93◦C for ANTARES. The mooring installed at the head of the CCC (at 315 m depth), at a level generally occupied by WIW/LIW, recorded the occurrence of cascading from the Gulf of Lion shelf (Fig. 6a). In winter 2003/2004, several cascading events not reaching layers below LIW took place (from January to May) and lasted for a few days, which were generally associ-ated to storms (Palanques et al., 2006). A major continu-ous cascading event was observed from January 2005 to late March 2005, with strong decreases in θ (of the order of 3◦C, Fig. 6a) and an increase in current speeds (up to 80 cm s−1, see Canals et al., 2006, and Puig et al., 2008). Strong θ decreases and high current speeds were registered also in winter 2005/2006 (from mid-December to mid-April), while
Fig. 6. θ times series in (a) CCC (at 315 m), (b) CS (at 1875 m), (c) GoL (at 2400 m) and (d) ANTARES (at 2200 m). Note that scales are different.
winters 2006/2007, 2007/2008 and 2008/2009 were charac-terized only by some minor cascading events lasting for a few days (CIESM, 2009). Cascading at the canyon head in win-ter 2009/2010 increased its intensity, while winwin-ter 2010/2011 was less intense in terms of duration and θ decrease.
About 120 km downstream the CCC site, another moor-ing was installed at 1890 m on the Catalan slope (CS), lo-cated within the WMDW, close to the seabed. This site was chosen because it was previously used in 1993–94 for the study by Send et al. (1996) about the spreading of the new deep waters. So for this location background information was available. θ (Fig. 6b) and S (not shown) were almost constant from October 2003 (when the mooring has been deployed) until the end of January 2005, indicating a ho-mogeneous water mass with typical WMDW characteristics (12.846 ± 0.008◦C and 38.456 ± 0.002, respectively), with-out any seasonal signal (Font et al., 2007; CIESM, 2009). Then both variables suddenly increased to 12.99◦C and 38.50, respectively, and in early March 2005 they dropped down by more than 0.3◦C and 0.06. Such low values were maintained for almost one month and then they gradually increased reaching steady values, which were higher than the initial ones (12.882 ± 0.005◦C and 38.481 ± 0.002, re-spectively). Font et al. (2007) attributed the first phase of increasing θ and S in the CS data to the arrival of dense waters formed by open sea convection, with a large con-tribution of unusually warm LIW. The sudden cooling and freshening in early March 2005 was interpreted as the arrival of colder and fresher dense shelf waters originated during winter 2004/2005, which cascaded to the lower Catalan con-tinental slope reaching speeds up to 60 cm s−1 (Font et al., 2007). The final characteristics (0.04◦C warmer, 0.03 saltier and 0.012 kg m−3 denser) are thus the result of the mix-ing of the two dense waters formed by open sea convection and cascading, respectively. One year later, another
signifi-cant episode was recorded, with a subsequent cooling of the WMDW caused by the winter 2005/2006 cascading pulse, but without significant modification of the background θ –S properties that were reached at the end of the previous 2005 event. The CS mooring was serviced in early March 2007 without showing any evidence of thermohaline changes in the WMDW associated to the several minor cascading events that occurred in winter 2006/2007 (CIESM, 2009). The gaps between March 2007 and June 2008 and from late 2009 to 2011 are due to a failure in recovering the instruments.
The HC mooring maintained in the bottom layer (where the new WMDW begins its spreading) of the MEDOC area, at the centre of the open sea DWF area (Gol; 42◦N, 5◦E at 2400 m) by CNRS/COM since October 2006, was ser-viced in June 2011. The most striking features on this record are the abrupt positive jumps in θ (Fig. 6c) and S (not shown) that occurred in February 2009, 2010 and 2011, while previous values have been stable at 12.869 ± 0.005◦C and 38.479 ± 0.002 for more than 2 yr. It is interesting to note that θfirst reaches a maximum (12.91–12.92◦C) and then slowly decreases during the following 2 weeks, before finally reach-ing 12.88◦C. The θ after each event was a bit higher than before the event, finally reaching (June 2011) values higher than 12.89◦C.
The ANTARES mooring is located offshore Toulon at 2200 m, in the same layer as the GoL mooring. The time series is still quite short, since the SBE37 was added in December 2007 and could not cover the main DWF events of the winters 2004/2005 and 2005/2006. The data show a strong oscillating behaviour, both in θ (Fig. 6d) and S (not shown), with mean values of 12.90 ± 0.007◦C and 38.480 ± 0.001, respectively, in line with the records of the other three moorings after the abrupt WMDW warming and salinification in winter 2004/2005. No offshore convection event down to these depths was observed in this easternmost
Fig. 7. Location of the three monitoring sites in the central Mediter-ranean (SC = Sardinia Channel; C01 = mooring #1 in the Sicily Channel; C02 = mooring #2 in the Sicily Channel).
location (which is “upstream” of the typical DWF site) in winter 2008/2009, as was in the 42◦N, 5◦E mooring, but the event in winter 2009/2010 was evident also here, with a sud-den θ increase.
3.3 The central Mediterranean region
The central Mediterranean region, i.e. the region between Algeria–Tunisia, Sicily and Sardinia, is the transition zone between the WMED and the EMED. Both surface waters, coming from Gibraltar and intermediate waters from the EMED, cross the region before continuing their paths in the eastern/western part of the Mediterranean, respectively. Fig-ure 7 shows the precise location of the three monitoring sites in this region.
The Sardinia Channel (SC) is a wide opening between Tunisia and Sardinia, which has a sill at about 1900 m in a narrow deep trench that allows exchanges of the upper part of the deep waters to occur between the Algerian and the Tyrrhenian subbasins (Astraldi et al., 1999). The densest part of WMDW, which is trapped in the Algerian subbasin, is thus overflowing the sill when uplifted by even denser WMDW. The less dense WMDW, circulating anticlockwise and along-slope may enter the Sardinia Channel directly following the Algerian slope. These two parts of WMDW will thus be lo-cated at different places in the channel, and the HC moor-ing bemoor-ing at the sill (Fig. 7) is thought to chiefly monitor the overflowing dense WMDW. The other water mass ex-changed in this region results from the mixing, inside the Tyrrhenian, between the WMDW and waters of eastern ori-gin. In particular, the sinking of the Eastern Mediterranean Overflow Water (EOW) from depths shallower than 400 m down to 2000 m induces a tremendous mixing of the EOW itself and of the EOW with the resident water in the Tyrrhe-nian (Millot, 1999), giving origin to the TDW. The moni-toring in the SC is operated at the sill (Fig. 7) in order to
observe the variability of the deep water exchanged between the two adjacent subbasins. The θ time series (Fig. 8a) col-lected at the sill since July 2003 (salinity not shown) shows an alternation of WMDW presence (lower θ and S, between 12.81 and 12.86, and ∼ 38.45; generally flowing eastward) and TDW presence (“pulses” of higher θ and S, > 12.86 often exceeding 12.9◦C, and S > 38.46 sometimes > 38.48; generally flowing westward) (see also Bouzinac et al., 1999). Those TDW pulses are generally of short duration (between 1 day and 1 week), and are likely to be due to displace-ments of the interface between the two deep water masses. Thus the mooring alternatively sampled WMDW (mainly) and TDW. Further we may observe a constant increase of θ in the WMDW (about +0.05◦C in 5 yr). On the contrary S (not shown) exhibits a decrease in the first half of the time series, between July 2003 and September 2005, followed by a stronger S increase. A closer look at the θ time series also shows that the increasing tendency is accelerated after September 2005 (about +0.38◦C in 2.5 yr; for comparison, we note that Fuda et al., 2002, reported a similar increas-ing trend of 0.016◦C yr−1in the deep Tyrrhenian during the 1990s).
The Sicily Channel separates the sea into its two basins, the EMED and the WMED, and it is the most important Mediterranean passage after Gibraltar. As at Gibraltar, there is a two-layer system that is maintained by the excess of evaporation over the EMED. Its monitoring is fundamental for the quantification of the highly variable exchanges be-tween the two basins, in particular of the heat and salt im-port from the EMED to the WMED (and thus towards the DWF region and the Strait of Gibraltar). The channel is a complex region, delimited by two sill systems and a deep basin between them. Both the eastern and the western sill systems are in the 400–500 m depth range, while the inter-nal portion reaches a depth of 1700 m, and plays a role as a buffer zone. Between Cape Bon (Tunisia) and Mazara del Vallo (Italy), a ridge divides the channel longitudinally into two trenches each with very different cross-sectional areas (Fig. 7). The axis of the Sicilian trench and adjacent to the wide Sicilian plateau is directed northwards, is very narrow, and has a maximum depth of 450 m (mooring C01). The Tunisian trench is wider, shallower, and with a sill depth at about 530 m located some 20 nm to the south-west of the other (mooring C02). The monitoring of the bottom layer in both trenches (where the intermediate waters and the upper part of the deep waters of eastern origin pass) started in 1993, well before the start of HC. This data set presently constitutes one of the longest, uninterrupted Mediterranean time series (along with the Corsica Channel series, the DYFAMED and the CEFREM – Centre de Formation et de Recherche sur l’Environnement Marin– series). These data were of partic-ular relevance in documenting the propagation of the EMT signature from the eastern to the western basin. The excep-tionally large volume of new deep waters of Aegean origin (Roether et al., 2007) produced during the EMT modified the
Fig. 8. (a) θ time series at SC (at 1900 m), (b) θ times series in at C01 (at 387 m).
thermohaline characteristics of the intermediate layer in the channel (traditionally occupied by LIW) and induced the up-lifting of the resident deep waters in the Ionian, significantly increasing the volume of EOW crossing the Sicily Channel towards the Tyrrhenian subbasin (Gasparini et al., 2005).
Presently the sub-surface moorings, which measure cur-rents, θ and S at different depths, monitor the exchanges both in the surface and the deep layers. In the bottom layer, moor-ings are equipped with a high quality CTD probe to detect the hydrological variability in correspondence to the intermedi-ate wintermedi-ater layer (Table 2). The θ time series (shown since Oc-tober 1998, Fig. 8b) at C01 at 400 m depth gives evidences of the high variability of the water masses crossing the channel. This variability is related to the intense mesoscale dynam-ics in this region (Sammari et al., 1999) and the presence of new water masses in the transition layer (Ben Ismail et al., 2012). Data collected at C02 (not shown) have comparable patterns but are on average 0.04◦C colder than in C01. This is explained by the dynamics of the channel, which forces the core of LIW (warmer and saltier than the surroundings) to flow mainly through the eastern passage (Ben Ismail et al., 2012).
An investigation of the interannual variability reveals that θpresents a cycle with warming and cooling periods. More in detail, a warming period is well evident between Octo-ber 1998 and July 2004, with a mean increase of 0.15◦C (from 13.89◦C to 14.04◦C, Fig. 8b). After July 2004 a strong cooling occurred (−0.10◦C), which lasted to June 2006, fol-lowed again by a warming period (peaked in March 2008, when 14.02◦C was reached in the low-passed time series). The final part of the time series shows again the beginning of a cooling period. Higher frequencies are superimposed to this trend: there is a seasonal cycle of 0.05◦C amplitude peak-to-peak (maximum θ in late winter–early spring, probably due to the stronger presence of LIW in this period, which forms in winter in the EMED, and minimum θ in late autumn), and
Fig. 9. Location of the monitoring sites in the Tyrrhenian– Ligurian subbasins (TYR = Tyrrhenian, CC = Corsica Channel, DYF = DYFAMED).
numerous higher frequency variations of the order of days or weeks, suggesting a pulsating nature of the flow crossing the channel. Indeed Astraldi et al. (1999) and Grancini and Michelato (1987) found that the flow undergoes pulses with a period of about 15–20 days. It is worth to note that part of this variability may also be ascribed to the intense mesoscale activity of that region (Sammari et al., 1999), which would be able to modify the slope of, or raise and lower, the interface between water masses.
3.4 The Tyrrhenian and Ligurian subbasins
The Ligurian and Tyrrhenian are two of the WMED sub-basins that are connected through the Corsica Channel (Fig. 9), with a sill depth of about 460 m and a surface width of 30 km. The Ligurian subbasin has a cyclonic circulation,
with a marked seasonal variability: the Northern Current is more intense and also more unstable in winter than in sum-mer (Taupier-Letage and Millot, 1986). The Tyrrhenian cir-culation presents a well developed mesoscale activity and a mean cyclonic circulation that is less intense than the Lig-urian circulation (Krivosheya and Ovchinnikov, 1973; Ve-trano et al., 2010). In this region HC is operating three sta-tions (see Fig. 9): in the deep southern Tyrrhenian, within the shallow Corsica Channel and in the central part of the Ligurian subbasin, close to the historical DYFAMED station, 30 nm off the French Riviera.
The Tyrrhenian is a deep subbasin characterized by a com-plex bottom bathymetry. It has a narrow and shallow north-ern opening toward the Ligurian subbasin (the Corsica Chan-nel) and a much larger and deeper opening in the south, a 250 km wide passage between Sardinia and Sicily. Beyond this opening, there is a deep communication toward the west-ern Algerian subbasin (through the Sardinia Channel) and an eastern shallow connection to the EMED (through the Sicily Channel). As mentioned in the previous section, through the Sicily Channel the Tyrrhenian receives the LIW, which is marked by a subsurface temperature and salinity maximum, and the EOW, which mixes with the surface AW above and the deeper water masses below. One product of this mixing, below 700 m down to the bottom, is the TDW. The deep mooring in the southern Tyrrhenian (Fig. 9) is placed in a relevant site to be monitored for a number of peculiar char-acteristics: it has relatively weak dynamics (Vetrano et al., 2010), making it a suitable site to monitor the long term evo-lution of hydrographic properties of deep water masses (Gas-parini et al., 2005); it has a highly oligotrophic regime and appears to have been a net CO2 source for the atmosphere from the 1960s to the 1980s and only transformed into a sink in the 1990s (Louanchi et al., 2009); it is a salt fingering re-gion characterized by the presence of thermohaline staircases in the deep layers (Zodiatis and Gasparini, 1996), subject to internal waves which modify the vertical fluxes. Two θ time series are shown in Fig. 10a, at 3880 m and at 2524 m depth. They have a similar variability of about 0.03◦C with the deeper one being about 0.05◦C cooler than the shallower one. The frequent sudden θ jumps are a striking feature that might be indicative of internal waves passing by and dis-placing the interfaces of the thermohaline staircases, which are typical for the deep central Tyrrhenian subbasin (stairs of 20–54 m thickness, separated by thinner interfaces of about 2–27 m, as reported by Zodiatis and Gasparini, 1996). The time series is still too short for any further analysis of long-term processes.
Historical observations show that the Corsica Channel (CC) is crossed by a two-layer shear flow with an upper layer of AW and a lower layer of LIW (Astraldi et al., 1987). Long-term velocity measurements (Astraldi et al., 1999) show that there is a northward flow with clear seasonal variability. The highest velocity occurs in winter, when the flow crossing the channel is about 60 % of the annual transport. The exchanges
through the CC are being monitored without interruptions since July 1985, well before the start of the HC network. The θ time series at 400 m depth (Fig. 10c) is able to capture the hydrological variability of the LIW layer. The highest θ of the whole record was recorded in early 2005 (more than 13.9◦C) and then again in February 2010: compared to the mid 1980s, when the average was 13.55◦C, up to 2005 there has been an increase of +0.35◦C. After winter 2004/2005 the θ at 400 m dropped suddenly to the lowest value of the whole record, reaching < 13.35◦C in spring 2006, and recov-ered shortly after again to 13.6◦C. It is interesting to note that within one year (early 2005–early 2006) the highest and the lowest values of the 1985–2010 time series were observed. Part of the variability in the channel may be explained by the seasonal cycle, with the drops in θ (and S, not shown) being caused by the intrusion of intermediate water coming from the north. Air–sea fluxes differences and steric differences between the two basins, also related to DWF events in the Ligurian subbasin and in the north-western Mediterranean, are possible candidates to explain the variability of the 25-yr θtime series. According to Astraldi and Gasparini (1990) a link can be established between the winter increase of the current in the CC and the cooling of the Ligurian subbasin induced by episodes of significant heat loss. In particular, the oscillating behaviour of the final part of the series might be connected to the fact that the north-western Mediterranean seems to have become a quite active DWF site recently, i.e. since 2005 (CIESM, 2009).
The Ligurian subbasin comprises the area east of the Gulf of Lion and north of the island of Corsica, characterized by a basin-scale cyclonic circulation (Cr´epon et al., 1982) with strong currents around its edge, the Northern Current flowing close to the Italian and French coasts and the western Corsica Current (Astraldi and Gasparini, 1992) flowing west of Cor-sica. This cyclonic gyre has been attributed to geostrophic adjustment to winter deep-water formation (Cr´epon et al., 1989) and the influence of cyclonic wind stress curl (Herbaut et al., 1997). The DYFAMED site is located in the central Ligurian subbasin, where the water depth is 2350 m. Thanks to monthly CTD monitoring programme at this site, a steady increase of θ and S has been detected in the deep waters during 1995–2005 (Marty and Chiaverini, 2010). In Febru-ary 2006, an abrupt increase in θ (+0.1◦C) and S (+0.03) was measured at 2000 m depth as the result of successive in-tense DWF events during the three preceding years and as a signal of the EMT event (Schroeder et al., 2008). Since August 2009, and in the framework of HC, the WMDW (at 2000 m) and the lower LIW (at 700 m) are continuously monitored (Fig. 10b). Currently, the θ at 2000 m depth is decreasing slowly down to 12.90◦C. At 700 m depth the θ shows a strong seasonal and interannual variability (between 12.95◦C and 13.35◦C). The θ minimum has been observed during the full water column mixing (winter 2005–2006, as reported in Schroeder et al., 2010) and presently θ is reaching 13.2◦C (Fig. 10b).