HAL Id: hal-01780650
https://hal.archives-ouvertes.fr/hal-01780650
Submitted on 11 Apr 2019
HAL is a multi-disciplinary open access
archive for the deposit and dissemination of
sci-entific research documents, whether they are
pub-lished or not. The documents may come from
teaching and research institutions in France or
abroad, or from public or private research centers.
L’archive ouverte pluridisciplinaire HAL, est
destinée au dépôt et à la diffusion de documents
scientifiques de niveau recherche, publiés ou non,
émanant des établissements d’enseignement et de
recherche français ou étrangers, des laboratoires
publics ou privés.
Dramatic Changes in Malaria Population Genetic
Complexity in Dielmo and Ndiop, Senegal, Revealed
Using Genomic Surveillance
Amy K. Bei, Makhtar Niang, Awa B. Deme, Rachel F. Daniels, Fatoumata D.
Sarr, Cheikh Sokhna, Cheikh Talla, Joseph Faye, Nafissatou Diagne,
Souleymane Doucoure, et al.
To cite this version:
Amy K. Bei, Makhtar Niang, Awa B. Deme, Rachel F. Daniels, Fatoumata D. Sarr, et al.. Dramatic
Changes in Malaria Population Genetic Complexity in Dielmo and Ndiop, Senegal, Revealed Using
Genomic Surveillance. Journal of Infectious Diseases, Oxford University Press (OUP), 2018, 217 (4),
pp.622-627. �10.1093/infdis/jix580�. �hal-01780650�
The Journal of Infectious Diseases
Dramatic Changes in Malaria
Population Genetic Complexity in
Dielmo and Ndiop, Senegal, Revealed
Using Genomic Surveillance
Amy K. Bei,1,2,3,a Makhtar Niang,4,a Awa B. Deme,2,3 Rachel F. Daniels,1,5 Fatoumata D. Sarr,6 Cheikh Sokhna,7 Cheikh Talla,6 Joseph Faye,6
Nafissatou Diagne,7 Souleymane Doucoure,7 Souleymane Mboup,2,8 Dyann F. Wirth,1,5 Adama Tall,6 Daouda Ndiaye,3 Daniel L. Hartl,1,5,9 Sarah K. Volkman,1,5,10,a and Aissatou Toure-Balde4,a
1Department of Immunology and Infectious Diseases, Harvard T.H. Chan School of Public Health, Boston, Massachusetts; 2Laboratory of Bacteriology and Virology, Le Dantec Hospital, and 3Laboratory of Parasitology and Mycology, Faculty of Medicine and Pharmacy, Cheikh Anta Diop University, and 4Immunology Unit, Institut Pasteur de Dakar, Senegal; 5Broad Institute of Massachusetts Institute of Technology and Harvard, Cambridge; 6Epidemiology Unit, Institut Pasteur de Dakar, 7French National Research Institute for Sustainable Development, URMITE, and 8Institut de Recherche en Santé, de Surveillance Epidemiologique et de Formations, Dakar, Senegal; and 9Department of Organismic and Evolutionary Biology, Harvard University, Cambridge, and 10School of Nursing and Health Sciences, Simmons College, Boston, Massachusetts
Dramatic changes in transmission intensity can impact
Plasmodium population diversity. Using samples from 2 distant
time-points in the Dielmo/Ndiop longitudinal cohorts from Senegal, we applied a molecular barcode tool to detect changes in parasite genotypes and complexity of infection that corresponded to changes in transmission intensity. We observed a striking sta-tistically significant difference in genetic diversity between the 2 parasite populations. Furthermore, we identified a genotype in Dielmo and Ndiop previously observed in Thiès, potentially implicating imported malaria. This genetic surveillance study validates the molecular barcode as a tool to assess parasite popu-lation diversity changes and track parasite genotypes.
Keywords. malaria; Dielmo/Ndiop; Senegal; genomic
surveillance; molecular barcode.
Traditional estimates of malaria transmission are often difficult and costly to perform, especially in areas of low transmission [1]. The ability to monitor and predict changes in transmission intensity in real time is critical to evaluating malaria parasite biol-ogy and malaria control efforts. Recently, a 24-single-nucleotide polymorphism (SNP) molecular barcode tool that correlates with whole-genome identity has assessed changes in malaria population
genomics and malaria incidence rates from cross-sectional studies in Thiès, Senegal [2], a region with very low malaria endemicity based upon an annual entomological inoculation rate (EIR) of 1–5.
Dielmo and Ndiop are 2 extensively described Senegalese vil-lages 5 km apart where longitudinal follow-up studies on deter-minants of malaria infection have been conducted since 1990 and 1993, respectively [3–5]. Until the mid-2000s, Ndiop and Dielmo had contrasting malaria endemicity due to continual anopheline breeding year-round in Dielmo [4], thus sustaining intense and perennial malaria transmission (EIR of 258 infected bites/person/year during 1990–2006) [5], whereas transmission was moderate and seasonal (EIR = 80 infectious bites/person/ year) in Ndiop [6]. Malaria transmission intensity has since declined substantially in both villages: EIR was 0.00 in Ndiop and 26.3 in Dielmo in 2014 (unpublished data).
The goal of this study was to apply the 24-SNP molecular bar-code [7] to blinded samples from a longitudinal cohort spanning 25 years to evaluate the correlation between key genetic signals and malaria transmission and parasite population diversity in areas with dramatically different malaria endemicities. Specifically, the study aimed to characterize (1) the complexity of infection (COI); (2) the presence of any shared parasite clusters; and (3) whether the barcodes (genomic signature) of parasites from Dielmo/Ndiop match those previously identified throughout Senegal.
METHODS
Ethics Statement
The Ethics Committee of the Ministry of Health in Senegal approved this study. All samples were collected with informed consent per ethical requirements of the National Ethics Committee of Senegal, Pasteur Institutes of Dakar and Paris, and the Institut de Recherche pour le Développement.
Patient DNA Samples
All samples microscopically positive for P. falciparum infection were confirmed using quantitative polymerase chain reaction [8] following DNA extraction (QIAamp, Qiagen). Forty randomly selected blood samples from an archived collection (2001–2002 [n = 20] and 2014 [n = 20]) corresponding to periods of high transmission (Dielmo EIR = 353.8 [2001] and 409.9 [2002] [5]; Ndiop EIR = 171.9 [2001] and 16.9 [2002]) or extremely low transmission (Dielmo EIR = 26.3 and Ndiop EIR = 0.0 [2014, unpublished]), with sample sets blind-coded prior to analysis. DNA samples were preamplified as needed [7, 9].
Genotyping
24-SNP Molecular Barcoding
DNA was diluted, used directly, or preamplified as previ-ously described [9]. Molecular barcoding was performed
B R I E F R E P O R T
© The Author(s) 2018. Published by Oxford University Press for the Infectious Diseases Society of America. All rights reserved. For permissions, e-mail: [email protected]. DOI: 10.1093/infdis/jix580
Received 17 August 2017; editorial decision 31 October 2017; accepted 26 December 2017; published online January 9, 2018.
aA. K. B., M. N., S. K. V., and A. T.-B. contributed equally to this work.
Correspondence: S. K. Volkman, ScD Harvard T.H. Chan School of Public Health, 665 Huntington Ave, Bldg 1, Rm 715, Boston, MA 02115 ([email protected]).
STANDARD
The Journal of Infectious Diseases® 2018;217:622–7
15 217
February
using high-resolution melting methodology [10] in 96-well plates on a Roche Light Cycler 96, with 8 assays per plate for 10 unknown samples, and 2 controls (either 3D7 and Dd2, or 3D7 and Tm90C6B, depending upon assay) in a final volume of 5 µL. Occasionally assay confirmation was performed on a Light Scanner-32. Here, a single assay was run on 30 unknown samples and 2 controls (either 3D7 and Dd2, or 3D7 and Tm90C6B, depending upon assay) in a final volume of 10 µL [11]. A novel SNP was identified in the IP20 sample for the A1 assay (Figure 1B) and confirmed by sequencing.
Barcode Phylogenetic Analysis
A neighbor-joining phylogenetic tree using the Jukes-Cantor method was created using Geneious (version 9.1.5, created by Biomatters).
Complexity of Infection Estimates
Complexity of infection was determined using the COIL algo-rithm [12], with monogenomic infections having <2 Ns and polygenomic infections having ≥2 Ns in the 24-SNP barcode.
Sample Size Estimates and Statistics
Sample size estimates and statistical significance was deter-mined using Fisher exact test. The 2 blinded populations (IP1– IP20 and IP21–IP40) were evaluated first for bias, then for differences regarding (1) proportion of polygenomic infections and (2) repeated barcodes. To achieve 5% significance level for polygenomic vs monogenomic, 10 samples from the IP21–IP40 set and 7 samples from the IP1–IP20 set would be required, thus 20 samples per set exceeds the required number. To achieve 5% significance for unique monogenomic vs repeated monog-enomic samples would require 5 samples from IP21–IP40 and 7 samples from IP1–IP20, such that 20 samples per set exceeds the required number. Thus, 20 samples per set is about 2 times the minimum required to detect statistically significant differ-ences at the 5% level.
RESULTS
Patient Population
Demographic characteristics of the study population (Table 1) indicate the sex ratio (male/female) favored males (1.5 and 1.22 for the 2001–2002 and 2014 groups, respectively). The mean age was 6.37 (range, 0.7–16.1) years and 19.5 (range, 1.9–44.6) years for the 2001–2002 and 2014 groups, respectively. This shift in the age distribution is representative of the overall population, and is expected as malaria cases occur more frequently in older individuals as transmission declines [5]. Other statistically sig-nificant differences (highest in 2001–2002) included the mean parasite density, EIR, and malaria incidence.
Barcode Comparisons for COI and Genetic Diversity
We first tested whether the 2 barcode sample sets were balanced and found no significant difference (P = .73, Fisher exact test),
indicating no sampling bias between the 2 sample sets. This is consistent with neighbor-joining analysis (Figure 1C) that suggests admixing of parasite genotypes between the 2 study populations—Dielmo and Ndiop. We next estimated COI using the COIL algorithm for the 2 blinded sample sets. For samples IP1–IP20, COI was 1.35 (10/20 [50%] polygenomic samples), whereas samples IP21–IP40 had a COI of 1, as all samples con-tain single genotypes. These COI differences represent highly significant differences (P = .0016, Fisher exact test) in the num-ber of monogenomic and polygenomic infections between 2001–2002 and 2014.
We also observed dramatic differences between these 2 sam-ple populations when comparing genetic diversity and identity of specific parasite types. For samples IP1–IP20 there were no repeated barcodes (all were unique), whereas the IP21–IP40 set contained 3 repeated barcode clusters (n = 2, n = 2, and n = 6) that represented 66.6% (10/15) of the population (Figure 1A). While the number of barcode clusters in IP21–IP40 (n = 3) compared to IP1–IP20 (n = 0) was only borderline significant (P = .069, Fisher exact test), the difference in the number of repeated barcode samples for IP21–IP40 (n = 10) compared to IP1–IP20 (n = 0) was highly significant (P = .0010, Fisher exact test). These results support the hypothesis that samples IP1–IP20 originated from a period of relatively high malaria transmission based upon increased genomic diversity, whereas samples IP21–IP40 were collected during a period of relatively low malaria transmission given decreased genomic diversity. When samples were unblinded, the findings confirmed the hypothesis that the IP1–IP20 sample set was from a highly malaria-endemic 2001–2002 period characterized by high transmission intensity, whereas the IP21–IP40 set was from the lowly malaria endemic 2014 collection, where transmission intensity had dropped substantially.
Specific Barcode Identity Compared to Known Barcodes Implicates Possible Imported Malaria
In addition to genetic diversity, we also asked whether any of these genotypes matched a large database (n = 1034 monog-enomic barcodes) of previously published [2] and unpub-lished barcodes (Deme and Daniels, unpubunpub-lished data: n = 215 monogenomic barcodes) from other regions of Senegal. For samples from the high transmission period (2001–2002), none of the individual barcodes matched previously observed hap-lotypes. For samples from the low transmission period (2014), 1 of the 3 repeated barcode clusters (n = 6) corresponded to a parasite type (haplotype 3), observed in Thiès in both 2007 and 2010 [2]. The other 2 clusters (IP1, n = 2; IP2, n = 2) had not previously been observed, with one set (IP1) having a member each from Dielmo and Ndiop and the other set (IP2) having both cluster members from Ndiop.
We found no other matching barcodes in a large database (n = 1249) of published [2] and unpublished Senegal barcodes
from Thiès, Dakar, Kaolack, Kaffrine, Kedougou, Kolda, Saint Louis (Figure 1D). Travel histories for the 6 individuals with the haplotype 3 genotype, previously identified in Thiès (Figure 1D), indicated both extensive local travel as well as travel to the Thiès region. Thus, genetic evidence of shared parasite genotypes between Dielmo/Ndiop and Thiès was confirmed by travel history.
DISCUSSION
Changes in transmission can dramatically influence the genetic diversity of circulating P. falciparum parasites. To test this hypothesis, we characterized the genetic complexity at 2 time points from a well-characterized longitudinal cohort to deter-mine if genomic approaches can predict transmission inten-sity [2]. We characterized COI, polygenomic vs monogenomic infections, and evidence of shared genetic clusters, and asked whether the barcodes of these Dielmo/Ndiop parasites match parasite types previously identified throughout Senegal.
We observed a striking and statistically significant difference in the genetic signatures between the 2 blinded sample popula-tions, with one (2001–2002) population having a high percent-age of polygenomic infections (50%), no shared clusters, and no previously observed barcodes, whereas the other (2014) pop-ulation contained only monogenomic infections and 3 shared clusters representing two-thirds (10/15 [66.6%]) of the popula-tion diversity. Such changes in genetic signatures were true for
both Dielmo and Ndiop if considered separately. Monogenomic proportions went from 40% (Ndiop) and 60% (Dielmo) in 2001–2002 to 100% monogenomic for both populations in 2014. Conversely, barcode clonality went from 0 to 66% in both Dielmo and Ndiop across this same time, with both signals mir-roring decline in EIR as a measure of transmission. These trends in genotypic diversity and complexity mirror expectations for a population with high outcrossing (2001–2002) or increased self-ing (2014) [13, 14]. These striking changes represent statistically significant differences despite relatively small sample sizes, which is one of the advantages of genetic data. Indeed, for the genetic signals we were testing, we only needed approximately ≤10 sam-ples to achieve significance (5% level with a Fisher exact test).
Parasite genotypes are shared between Dielmo and Ndiop based upon neighbor-joining tree analysis (Figure 1C) that revealed no strict clustering of barcodes by locality. Nevertheless, we saw dis-tinct patterns across time that corresponded to dramatic changes in transmission levels. Among these patterns, we detected a clus-ter of parasites (haplotype 3) that was detected in Thiès in 2007 and 2010 [2], suggesting possible migration of parasites either by infected humans or infected mosquitoes. These genetic findings are supported by travel history, as a subset of individuals who harbored these shared barcode infections (ND14 and DI12) had traveled to the Thiès region. Thus, genetic signatures may help in tracking parasite infections and networks of transmission.
Table 1. Baseline Demographic Characteristics of the Study Population
Characteristic 2001–2002 (n = 20) 2014 (n = 20) OR (95% CI) P Value Sex, No. (%) Male 12 (60) 11 (55) 1 Female 8 (40) 9 (45) 1.22 (.29–5.16) Ratio (M/F) 1.5 1.22 Age, y Mean 6.37 19.5 .00048 Range (0.7–16.1) (1.9–44.6) Parasite density/µL Mean 11 757.5 6283.2 .0038 Range (150–29 450) (25–45 000) Location, No. (%) Dielmo 10 (50) 11 (55) Ndiop 10 (50) 9 (45) mEIR Dielmo 29.6a 2.19 <.0001 Ndiop 7.9b 0.0c .06
IR, mean (95% CI)
Dielmo 2.25 (2.13–2.37) 0.136 (0.099–0.173) <.0001 Ndiop 1.98 (1.865–2.087) 0.104 (0.072–0.136) <.0001
Characteristics of the sample populations from Dielmo and Ndiop are listed for the 2 time periods described in this study, 2001–2002, and 2014. Kruskal–Wallis and Fisher exact tests were used to compare distribution of quantitative and qualitative variables respectively between subgroups. For all statistical tests, α = .05.
Abbreviations: CI, confidence interval; IR, annual incidence rate (number of episodes per person per year); mEIR, mean entomological inoculation rate (number of infected bites per person per year, averaged over the year); ND, not determined; OR, odds ratio.
aFrom previously published data [5]. bFrom previously published data [6]. cUnpublished data.
C D B 3D7-A1 Dd2-A1 IP20-A1 10 20 30 40 50 60 T T T TC T T CT TT CC TA A T AA A T T T TC T T CA T T A T A TG CA T CT T T TA CA TCA C C T A CA T T T TT T T T TC T T CT TT CC TA A T AA A T T T TC T T CA T T A T A TGT A T CT T T TA CA TCA C C T A CA T T T TT T T T TC T T CT TT CC TA A T AA A T T T TC T T CAC T A T A TG CA T CT T T TA CA TCA C C T A CA T T T TT T T T TC T T CT TT CC TA A T AA A T T T TC T T CA Y T A T A TGY A T CT T T TA CA TCA C C T A CA T T T TT
Probe binding site-A1
SNP-A1 novel SNP Pf_01_000130573 Pf_01_000539044 Pf_02_000842803 Pf_04_000282592 Pf_05_000931601 Pf_06_000145472 Pf_06_000937750 Pf_07_000277104 Pf_07_000490877 Pf_07_000545046 Pf_07_000657939 Pf_07_000671839 Pf_07_000683772 Pf_07_000792356 Pf_07_001415182 Pf_08_000613716 Pf_09_000634010 Pf_10_000082376 Pf_10_001403751 Pf_1 1_0001 171 14 Pf_1 1_000406215 Pf_13_000158614 Pf_13_001429265 Pf_14_000755729
A1 B1 A2 B2 A3 B3 A4 B4 A5 B5 A6 B6 A7 B7 A8 B8 A9 B9 A10 B10 A11 B11 A12 B12 Sample Code Sample ID Date Sex Age Parasite Density Location M/P genomic COI 1 2 3 4 5 6 7 8 9 10 11 12 13 14 15 16 17 18 19 20 21 22 23 24 Haplotype
IP01 DI01 2/6/01 M 2.3 10550 Dielmo P 3 N N C N G C N G N C T A N N C C N N A N A N T G IP02 DI02 2/6/02 M 12. 4 6950 Dielmo P 2 N A C T G C G G N T T A N N A C N N A N A N T G IP03 DI03 2/5/01 M 10. 5 6450 Dielmo P 2 N A N T C N N G N T T A C N C N N N A N A T T G IP04 DI04 2/3/02 F 11.6 19750 Dielmo M 1 T A T T G C G G T C T A C C A C T A A G A C T G IP05 DI05 2/5/01 F 3.8 22200 Dielmo P 1 C A T C G C A G T C T N T A C C C N A A A N T G IP06 DI06 1/14/02 M 1.1 10000 Dielmo M 1 T A T C G C G G T T T A T C A C C A A G A C T G IP07 DI07 1/3/01 F 2.6 20800 Dielmo P 1 T A C T C C G G T N T A C C C C C A C A C N T G IP08 DI08 1/7/02 F 3.7 29450 Dielmo M 1 T A C C G C G A A T T A T A C C C T A G A C T G IP09 DI09 1/2/01 F 3.4 9150 Dielmo M 1 C A C C G C A G T T T A T C A A C T C G A T T G IP10 DI10 1/7/02 M 3.2 13450 Dielmo P 1 N A N C G N G G T T T A T C A C C A A G C C T G IP11 ND01 5/2/01 M 0.7 2150 Ndiop M 1 T A C T C G G G T C N G T A C A T A C G A C T G IP12 ND02 2/7/02 M 15. 7 8350 Ndiop P 2 C A C T N C N G N T T N N N A C N N C G N T T G IP13 ND03 5/2/01 M 1.5 150 Ndiop M 1 T A T T C C A G T C C A C A C A T T C G A T T G IP14 ND04 2/7/02 M 4.7 7400 Ndiop M 1 T A T T C G G G T C C A C C C C C T A G A T T G IP15 ND05 1/2/01 F 5.6 15200 Ndiop P 2 N A C T C C G G T T T A T N N A N A A N A N T G IP16 ND06 2/5/02 F 16. 1 5750 Ndiop M 1 T A T T C C G G T T T A T A C C C T C G C C T G IP17 ND07 1/2/01 M 5.6 13600 Ndiop M 1 T A T T C C A G T T T A C C A A C T A G A T T G IP18 ND08 1/9/02 M 7.8 10750 Ndiop P 2 N A C T G C N G T T T A T A C A C T A N N T T G IP19 ND09 1/1/01 M 10.1 15550 Ndiop P 1 T A C T C C A N T N C G N C C A T T C G C T T G IP20 ND10 1/8/02 F 5 7500 Ndiop M 1 C A C C C C G G T C T A C C C A C A C G A T T G IP22 DI14 8/29/14 M 20. 1 2350 Dielmo M 1 T A C T G C G G A T T G C A C C C A A A A C T G IP23 ND16 8/7/14 F 10. 7 3650 Ndiop M 1 C A T T C C A G N C C A C C A A T A A A A T T G IP26 ND17 8/5/14 M 11.8 50 Ndiop M 1 T A T T G C G G T T T G T A A C T T A A A T T G IP29 ND18 8/8/14 F 1 7 14700 Ndiop M 1 T A T T G C G G T T T G T A A C T A A A A T T G IP32 DI16 9/5/14 F 28,7 250 Dielmo M 1 T A C T G C G G A T T G C A A C C A A A A C T G IP28 DI15 7/28/14 F 44. 6 2500 Dielmo M 1 T A C C C C G G T C T A C A C C T A A G A T T G IP40 ND19 10/13/14 F 4.4 9450 Ndiop M 1 T A C C C C G G T C T A C A C C T A A G A T T G IP27 ND11 7/27/14 F 6.6 25 Ndiop M 1 C A C T C C A G T C T A C C A C C T C G C T T G IP33 ND12 9/1/14 F 38. 2 50 Ndiop M 1 C A C T C C A G T C T A C C A C C T C G C T T G IP24 DI11 8/18/14 M 16 6900 Dielmo M 1 T A C T C C A G A C C G T A C C T T A G A T T G IP25 ND13 10/3/14 F 43. 7 50 Ndiop M 1 T A C T C C A G A C C G T A C C T T A G A T T G IP30 ND14 10/15/14 M 5.5 10100 Ndiop M 1 T A C T C C A G A C C G T A C C T T A G A T T G IP31 DI12 11/16/14 M 15. 8 50 Dielmo M 1 T A C T C C A G A C C G T A C C T T A G A T T G IP38 ND15 7/4/14 F 6.7 50 Ndiop M 1 T A C T C C A G A C C G T A C C T T A G A T T G IP39 DI13 8/17/14 M 44.6 15050 Dielmo M 1 T A C T C C A G A C C G T A C C T T A G A T T G SenT125.2007 TH01 2007 M 10 135000 Thies M 1 T A C T C C A G A C C G T A C C T T A G A T T G SenT198.2010 TH02 2010 F 5 6 28350 Thies M 1 T A C T C C A G A C C G T A C C T T A G A T T G IP1 IP2 3 3 Thies Dielmo Ndiop Kaolac k Kaffrine ND15 ND14 ND13 DI13 DI12 DI11 1 4 16 # Trips A Dielmo Ndiop
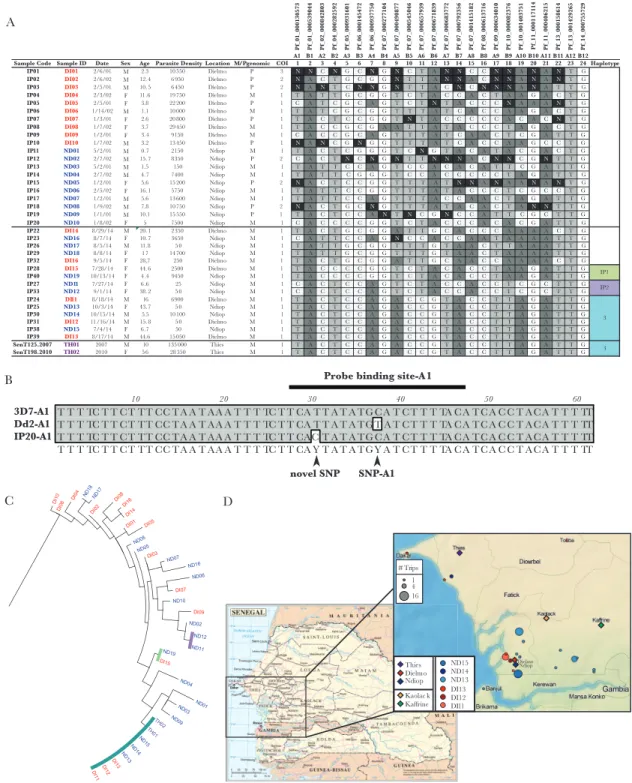
Figure 1. Molecular barcode diversity from Dielmo and Ndiop, Senegal. A, Barcodes from samples included in this study. Blinded sample codes, Patient parameters are
shown including sample ID (color coded per region of collection), date of collection, sex, age, parasite density /µL, and collection location. Single-nucleotide polymorphism (SNP) calls are shown for each of 24 markers and a call of “N” represents a mixed-allele call. M/P genomic indicates monogenomic or polygenomic infections, based on number of Ns; ≥2 represents a polygenomic infection. Based on the barcodes, complexity of infection (COI) is also shown as estimated by the COIL algorithm. Common genetic signature (CGS) cluster haplotypes are listed and colored on the far right. B, Polymerase chain reaction (PCR) sequencing for marker A1 reveals a novel polymorphism in the probe-binding region for sample IP20. PCR sequencing to confirm SNP assay A1 call was performed with the same primers used for the high-resolution melting amplicon: A1
F: 5ʹ-AGCAATCGAACCCTTTGATCTA-3ʹ; A1 R: 5ʹ- AATGAGAAGAGAGAAATATGTGTTGATAA- 3ʹ and the same PCR conditions, as described previously [7]. PCR products from
sample and controls (3D7 and Dd2) were run on a gel to confirm size and purity and were sequenced by Sanger sequencing in both forward and reverse directions using the same primers. Contiguous sequences were generated and alignments were performed using MacVector (version 12.7.3). C, Neighbor-joining phylogenetic tree of molecular barcodes using the Jukes–Cantor method. Sample names at the branch ends are colored per sample location. CGS haplotype clusters are indicated by colored bars. D, Map of sample locations and travel history for individuals with the haplotype 3 parasite genotype. Base map of Senegal (left) is based on United Nations map of Senegal (map number 4174, revision 3, January 2004); zoomed in panel (right) was created with TileMill Version 0.10.1 (MapBox) with terrain data from Natural Earth. Legend indicates major cities and villages of interest (diamonds: Dielmo, Ndiop, Thiès, Kaolack, Kaffrine), and color-coded travel histories for the 6 individuals with the haplotype 3 parasite genotype. The size of the circle indicates the number of trips to each location.
Our findings are generalizable and consistent with obser-vations both in other parts of Senegal [2] as well in other geo-graphic areas. For example, a recent study used barcode identity to suggest that the source of an outbreak of P. falciparum malaria in Panama was possibly from neighboring Colombia [10]. The finding of shared barcodes between Thiès and Dielmo/Ndiop, in addition to shared barcodes between Dielmo and Ndiop empha-size the need to evaluate domestic importation of parasite types, which may be interrogated with other surveillance methods [15].
This study validates and confirms the use of genetic surveil-lance to monitor malaria transmission changes, but additional studies are needed to more comprehensively investigate para-site population dynamics with changing malaria epidemiol-ogy resulting from malaria-reducing interventions. Additional investigation will extend this study to the larger longitudinal cohort to determine precise inflection points of transmission intensity across time and their correlation with parasite popula-tion genomic complexity. Such sampling will better inform the minimal essential data required to detect changes in R0 through epidemiological modeling [2]. Such work will expand the bar-code database for Dielmo and Ndiop and inform the underlying genetic diversity of the region across time. Integration of genetic data with patient clinical and behavioral data (such as travel) can guide definition of “local” circulating vs imported malaria genotypes for parasite tracking, informing transmission net-works and identifying “sink” and “source” populations toward successful malaria elimination [2, 15].
This study illustrates the utility of Plasmodium molecular genetic surveillance to assess parasite population complexity as transmission changes, to detect changes in parasite popu-lation structure that signal success or failure of interventions and impact policy decisions. Furthermore, this study illustrates the value of employing genomic surveillance to monitor the movement of specific parasite genotypes between regions that, with larger sample sizes and database of region-specific parasite genomes, could be used to track imported malaria strains from other regions and guide effective elimination activities.
Notes
Acknowledgments. The longitudinal cohorts in Dielmo
and Ndiop were funded by The Pasteur Institutes of Dakar and Paris, the Institut de Recherche pour le Developpement (IRD), and the Senegalese Ministry of Health. We acknowledge the vil-lagers of Dielmo and Ndiop for their continuous support and participation in the cohort. We thank the creators of Geneious (Biomatters) for their generous donation of a 1-year license to scientists in malaria-endemic regions, including author M. N., attending the Harvard-Broad Barcode Workshop.
Financial support. The longitudinal cohorts in Dielmo and
Ndiop were funded by the Pasteur Institutes of Dakar and Paris, IRD, and the Senegalese Ministry of Health. This work was sup-ported by a grant from the Bill & Melinda Gates Foundation
(to D. F. W.). A. K. B. is supported by an International Research Scientist Development Award (award number 1K01TW010496). M. N.’s attendance at the Harvard-Broad Barcode Workshop was supported by the Bill & Melinda Gates Foundation.
Potential conflicts of interest. All authors: No reported
con-flicts of interest. All authors have submitted the ICMJE Form for Disclosure of Potential Conflicts of Interest. Conflicts that the editors consider relevant to the content of the manuscript have been disclosed.
References
1. Tusting LS, Bousema T, Smith DL, Drakeley C. Measuring changes in Plasmodium falciparum transmission: precision, accuracy and costs of metrics. Adv Parasitol 2014; 84:151–208. 2. Daniels RF, Schaffner SF, Wenger EA, et al. Modeling
malaria genomics reveals transmission decline and rebound in Senegal. Proc Natl Acad Sci U S A 2015; 112:7067–72. 3. Rogier C, Ly AB, Tall A, Cissé B, Trape JF. Plasmodium
fal-ciparum clinical malaria in Dielmo, a holoendemic area
in Senegal: no influence of acquired immunity on initial symptomatology and severity of malaria attacks. Am J Trop Med Hyg 1999; 60:410–20.
4. Trape JF, Rogier C, Konate L, et al. The Dielmo project: a longi-tudinal study of natural malaria infection and the mechanisms of protective immunity in a community living in a holoen-demic area of Senegal. Am J Trop Med Hyg 1994; 51:123–37. 5. Trape JF, Tall A, Sokhna C, et al. The rise and fall of malaria
in a West African rural community, Dielmo, Senegal, from 1990 to 2012: a 22 year longitudinal study. Lancet Infect Dis
2014, 14:476–488.
6. Rogier C. Natural history of Plasmodium falciparum malaria and determining factors of the acquisition of anti-malaria immunity in two endemic areas, Dielmo and Ndiop (Senegal). Bull Mem Acad R Med Belg 2000; 155:218–26. 7. Daniels R, Volkman SK, Milner DA, et al. A general
SNP-based molecular barcode for Plasmodium falciparum iden-tification and tracking. Malar J 2008; 7:223.
8. Canier L, Khim N, Kim S, et al. An innovative tool for mov-ing malaria PCR detection of parasite reservoir into the field. Malar J 2013; 12:405.
9. Mharakurwa S, Daniels R, Scott A, Wirth DF, Thuma P, Volkman SK. Pre-amplification methods for tracking low-grade Plasmodium falciparum populations during scaled-up interventions in southern Zambia. Malar J 2014; 13:89. 10. Obaldia N 3rd, Baro NK, Calzada JE, et al. Clonal outbreak
of Plasmodium falciparum infection in eastern Panama. J Infect Dis 2015; 211:1087–96.
11. Daniels R, Ndiaye D, Wall M, et al. Rapid, field-deploy-able method for genotyping and discovery of single-nu-cleotide polymorphisms associated with drug resistance in Plasmodium falciparum. Antimicrob Agents Chemother
2012; 56:2976–86.
12. Galinsky K, Valim C, Salmier A, et al. COIL: a methodology for evaluating malarial complexity of infection using likeli-hood from single nucleotide polymorphism data. Malar J
2015; 14:4.
13. Conway DJ, Roper C, Oduola AM, et al. High recombina-tion rate in natural popularecombina-tions of Plasmodium falciparum. Proc Natl Acad Sci U S A 1999; 96:4506–11.
14. Anderson TJ, Haubold B, Williams JT, et al. Microsatellite markers reveal a spectrum of population structures in the malaria parasite Plasmodium falciparum. Mol Biol Evol
2000; 17:1467–82.
15. Wesolowski A, Eagle N, Tatem AJ, et al. Quantifying the impact of human mobility on malaria. Science 2012; 338:267–70.