HAL Id: hal-00831604
https://hal.archives-ouvertes.fr/hal-00831604
Submitted on 7 Jun 2013
HAL is a multi-disciplinary open access
archive for the deposit and dissemination of
sci-entific research documents, whether they are
pub-lished or not. The documents may come from
teaching and research institutions in France or
abroad, or from public or private research centers.
L’archive ouverte pluridisciplinaire HAL, est
destinée au dépôt et à la diffusion de documents
scientifiques de niveau recherche, publiés ou non,
émanant des établissements d’enseignement et de
recherche français ou étrangers, des laboratoires
publics ou privés.
Edge effects on ground beetles at the woodlot-field
interface are short-range and asymmetrical
Anthony Roume, Marc Deconchat, Laurent Raison, Gerard Balent, Annie
Ouin
To cite this version:
Anthony Roume, Marc Deconchat, Laurent Raison, Gerard Balent, Annie Ouin. Edge effects on
ground beetles at the woodlot-field interface are short-range and asymmetrical. Agricultural and
Forest Entomology, Wiley, 2011, Vol. 13 (4), pp. 395-403. �10.1111/j.1461-9563.2011.00534.x�.
�hal-00831604�
This is an author-deposited version published in:
http://oatao.univ-toulouse.fr/
Eprints ID: 6795
To
link
to
this
article:
DOI:
10.1111/j.1461-9563.2011.00534.x
URL:
http://dx.doi.org/10.1111/j.1461-9563.2011.00534.x
To cite this version:
Roume, Anthony and Deconchat, Marc and Raison,
Laurent and Balent, Gérard and Ouin, Annie Edge effects on ground
beetles at the woodlot-field interface are short-range and asymmetrical.
(2011) Agricultural and Forest Entomology, 13 (4). pp. 395-403. ISSN
1461-9563
O
pen
A
rchive
T
oulouse
A
rchive
O
uverte (
OATAO
)
OATAO is an open access repository that collects the work of Toulouse researchers and
makes it freely available over the web where possible.
Any correspondence concerning this service should be sent to the repository
administrator:
[email protected]
DOI: 10.1111/j.1461-9563.2011.00534.x
Edge effects on ground beetles at the woodlot–field interface
are short-range and asymmetrical
Anthony Roume1, Marc Deconchat, Laurent Raison, G ´erard Balent and Annie Ouin∗
INRA, UMR 1201 DYNAFOR, INRA/INP-ENSAT, F-31326 Castanet Tolosan, France and ∗Universit´e de Toulouse, UMR 1201 DYNAFOR, INRA/INP-ENSAT, BP 32607, 31326 Castanet Tolosan, France
Abstract 1 Boundaries between woodlots and agricultural habitats are numerous in temperate agricultural landscapes and influence ecological processes in both woodlots and agricultural habitats.
2 We aimed to determine how far the species assemblage of ground beetles in woodlot and open habitats was influenced by the presence of the woodlot–field boundary. 3 We studied the distribution of ground beetles on both sides of the boundaries of four
woodlots along transects of pitfall traps (n = 140). The depth of edge influence (i.e. the distance from the boundary at which the presence of the boundary has no more significant influence) on the species assemblage of ground beetles in each woodlot and in each agricultural habitat was determined with nonlinear canonical analysis of principal coordinates, an ordination method that is followed by nonlinear regression of the principal coordinates on distance from the boundary.
4 The depth of edge influence on the species assemblages of ground beetles was asymmetrical relative to the boundary: it was generally higher and had higher variability in open habitats (14.4 ± 12.3 m) than in woodlots (4.9 ± 2.3 m). Species assemblages of ground beetles in edges were a mix between both adjacent species assemblages. Edge effects in woodlots were deeper in the woodlots exhibiting a deeper penetration of open habitat species. Symmetrically, edge effects in open habitat were deeper in the open habitats with a deeper diffusion of forest species into the open habitat.
5 Forest ground beetles were not threatened by edge effects. Rather, edge effects are likely to benefit agriculture, mostly through the dispersal of predatory forest species into agricultural fields.
Keywords Beneficial insects, Carabidae, Coleoptera, depth of edge influence, forest–agriculture interface, nonlinear canonical analysis of principal coordinates, temperate rural landscape.
Introduction
The interaction between forest and agricultural habitats is a key factor shaping insect diversity in temperate landscapes, where these habitats are often highly interspersed and subjected to edge effects (Fahrig, 2003). Edge effects are defined by local variations in abiotic and biotic parameters, such as microclimate, species abundance and species assemblage.
Correspondence: Anthony Roume. Tel.: +335 61 28 53 46; fax: +335 61 28 54 11; e-mail: [email protected]
1Present address: INRA Centre de Toulouse, UMR 1201 DYNAFOR,
Chemin de Borde Rouge, BP 52627 F-31326 Castanet Tolosan, France.
Such variations occur in response to the interaction between two different adjacent habitats across an abrupt transition zone defined as the boundary (Matlack, 1993; Murcia, 1995; Cadenasso et al., 2003; Ries et al., 2004). Edge effects influence both adjacent patches and result in edge zones on both sides of the boundary. For example, in forest edge zones, microclimatic conditions are less buffered than in forest core areas, and biotic parameters, such as vegetation composition and structure, or ecological processes, such as predation and competition, also differ compared with the forest core area (Matlack, 1993; Murcia, 1995).
Species characteristic of a particular habitat can respond to edge effects in distinct manners. They can be a strict specialist
of their habitat and never cross the boundary or even avoid the edge zone of their habitat. Alternatively, they can be indifferent or benefit from the presence of the adjacent habitat and spread in this habitat close to the boundary or even concentrate in the edge zone of their habitat (Ries et al., 2004).
To evaluate the spatial extent of these two manifestations of edge effects and their potential implication for agriculture, it is necessary to measure how far species and their assemblages in both woodlots and adjacent open habitats are influenced by the presence of a boundary. The distance over which species or their assemblage are influenced by the boundary is defined as the penetration depth of edge influence (DEI) on them in the habitat concerned (Chen et al., 1992).
Among insects affected by habitat fragmentation and habitat boundaries (Didham et al., 1996; Hunter, 2002), ground beetles (Coleoptera: Carabidae) are convenient subjects to study forest–agricultural habitat boundaries because representative species are found in both wooded and open habitats, with different species assemblages in the two habitats (Bedford & Usher, 1994; Lovei & Sunderland, 1996). The sensitivity of ground beetles to environmental factors such as microclimate and vegetation cover, which vary greatly between forest and open habitats, has been reported as explaining the differences in species assemblages between the two habitats (Lovei & Sunderland, 1996). Moreover, ground beetles are one of the most common and abundant families of ground-dwelling arthropods and may thus have an important ecological role in their ecosystem. In particular, a number of them are known to consume weed seeds or to be generalist predators of agricultural pests (Lovei & Sunderland, 1996; Kromp, 1999; Warner et al., 2008). Because they are active early in crop fields and have a broad range of preys, their assemblages in fields are thought to play a complementary role in pest control to that of specialist predators, which may take a longer time to develop in crop fields (Symondson et al., 2002).
The DEI on ground beetles has rarely been statistically estimated (Magura, 2002; Baker et al., 2007) but would be useful to evaluate the potential effect of woodlots as enhancers of pest control when located in the vicinity of crops. Consequently, the objectives of the present study were first to quantify the DEI on species assemblages of ground beetles, on both sides of woodlot–open habitat (crop field or grassland) boundaries. Then, we aimed to describe the distribution of species characteristic from both habitats through the boundary, aiming to relate DEI with species distributions and to assess whether species characteristic from woodlots or open habitats are present: (i) only in their habitat except in its edge zone; (ii) in their habitat and in its edge zone; or (iii) in their habitat (including its edge) and also in the adjacent habitat with a lower abundance. Finally, we related transition in species assemblage through the edges studied to environmental conditions.
Materials and methods
Site
The study was carried out in the long-term socioecologi-cal research site ‘Valleys and Hills of Gascogny’, a rural
region located in south-western France (43◦16′N, 0◦54′E).
This temperate agro-forested landscape is characterized by boundaries between forest and agriculture that present a sharp contrast as a result of regular management by farmers and are quantitatively important because of the high number of small woodlots (total forest cover approximately 15% of total area). The region is hilly (250–400 m a.s.l.) and has a sub-Atlantic climate with mountain and slight Mediterranean influences
(mean annual temperature, 12.5◦C; mean annual precipitation,
750 mm).
We selected woodlots that were representative of the site with respect to area, vegetation composition, type of manage-ment and adjacent habitat, and that also contained boundaries that have been present for several decades. Moreover, we chose woodlots that were in direct contact with a crop field or grass-land, that had not recently been logged, and that were located within a few square kilometres. South-facing edges have higher insulation than the other edges of woodlots, which leads to a higher contrast between woodlot and open habitat conditions at south-facing edges compared with the other edges (Ries et al., 2004). Consequently, south-facing edges are considered to have the deepest edge effect and were selected in the present study. Four sites, each composed of a woodlot and its adjacent open habitat, were selected taking all these conditions into account, as well as the fact that many other studies have been carried out on a similar number of cases (Bedford & Usher, 1994; Barbosa & Marquet, 2002; Baker et al., 2007). The respective wood-lot areas were 13 ha (woodwood-lot denoted W13), 11 ha (W11), 2 ha (W2) and 0.8 ha (W1). All the woodlots were dominated by oak species (Quercus robur and Quercus pubescens) and were managed as coppices with standing trees. The nature of the adjacent open habitat was different between the four sites (W1, grassland; W2, oilseed rape; W11, soybean; W13, win-ter wheat). As a consequence of the differences in woodlots size and adjacent open habitats, sites were used to draw pat-terns of response (of ground beetles) to the boundary that were representative of the diversity found in the landscape but not to compare these pattern between the four sites. The study was conducted in 2006 in all the sites except for W13-wheat, which was studied in 2007.
Ground beetle trapping
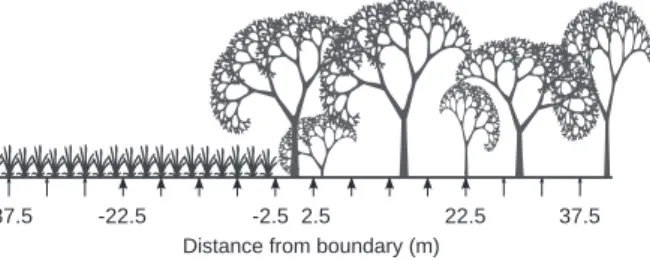
A woodlot boundary was defined as the line joining the bases of the first trees (diameter at 1.3 m height > 10 cm) belong-ing to the woodlot. All sites were studied with 35 pitfall traps. We defined two 70-m transects (15 pitfall traps each) in the two sites with the largest woodlots and three 45-m transects (10 pit-fall traps each) in the two remaining sites in accordance with the previous study reported by Barbosa and Marquet (2002). Tran-sects were centred on and perpendicular to the boundary and, within each site, transects were separated by at least 25 m. The transects were shorter in the smallest woodlots than in the largest ones because, otherwise, traps would have been closest from another boundary than the studied one as a result of the area and shape of the woodlots. Along a given transect, the traps were 5 m from each other, starting 2.5 m from the boundary in each direction (Fig. 1). To sample the species assemblage of ground beetles undergoing the lowest edge effects, five addi-tional pitfall traps were installed in the centre of each woodlot,
2.5 22.5 37.5 -2.5
-22.5 -37.5
Distance from boundary (m)
Figure 1 Transect crossing a woodlot–field boundary. The cups under
the distance axis represent pitfall traps. Small arrowheads represent traps that were present only in the sites with the largest woodlots (W11-soybean and W13-wheat), whereas large arrowheads represent traps that were present in all sites. Negative values of distance represent open habitat.
forming the 10-m diagonals of a square with traps in the corners and at the centre (distances from the nearest edge were 40, 60, 80 and 130 m, respectively, in W1, W2, W11 and W13).
Pitfall traps are largely used to study ground beetles because they comprise a simple and affordable method. Nonetheless, it is noteworthy that their catches do not measure the real density of species; rather, they give a measure of the activity density of the species at the place where the traps are positioned (Thiele, 1977). Traps were unbaited and consisted of a plastic cup with a funnel (diameter 8 cm) level with the soil surface. They contained 100 mL of 5% formaldehyde solution to preserve the beetles. Ground beetles being active mostly between April and October in the region of the study, the traps were in place all over this period (7 months) to catch both early and late species, although they were left open only for 1 week/month to limit the number of catches. Sampling ground beetles during 1 week per month is not exhaustive but we considered that discontinuous trapping was sufficient for a comparative study (Barbosa & Marquet, 2002; Baker et al., 2007; Ewers & Didham, 2008). The pattern of edge effects on the diversity of ground beetles at a forest–grassland boundary has been shown to be similar during two consecutive years (Magura et al., 2001). As in most studies concerning edge effects on ground beetles, we thus sampled ground beetles during a single year (Bedford & Usher, 1994; Barbosa & Marquet, 2002; Magura, 2002; Taboada et al., 2004; Baker et al., 2007; Gaublomme et al., 2008). Ground beetles were identified to species with morphological keys (Jeannel, 1942; H`urka, 1996) and named according to Fauna Europea(2010). We summed ground beetle abundance over the whole trapping period and used species abundances per trap for analysis.
The species caught were grouped into forest species, generalist species and open habitat species in accordance with previous publications (Lindroth, 1945; Thiele, 1977; H`urka, 1996; Ribera et al., 1999; Fournier & Loreau, 2001; Thomas et al., 2002; Pizzolotto et al., 2005) and previous observations made in the study site (A. Roume, unpublished data). Only four species out of 46 (corresponding to 22 individuals) could not be attributed to a particular group because no information was found about their habitat (Appendix).
Environmental variables were recorded in the immediate surroundings of each trap (in a radius of 1 m) to observe subtle differences along the transects that could explain species
assemblage changes. We measured ground moisture in the first 5 cm of soil (Hygrometer Thetaprobe ML2x; Dynamex Inc., Houston, Texas), light intensity (luxmeter HANNA HI 975000; Hanna Instruments, Woonsocket, Rhode Island), bare ground and ground cover by moss, litter and dead wood using the visual estimate vegetation coverage grid of Prodon and Lebreton (1981). Vegetation cover in the 0–25, 25–50 and 50–100 cm strata was also estimated by the same visual method, and it was estimated by the number of interceptions of a vertical pole by vegetation in the 1–2, 2–4 and 4–6 strata.
Statistical analysis
As a first step, we performed correspondence analysis of the abundance of ground beetle species from all the traps to validate the existence of two distinct species assemblages of ground beetles in woodlots and open habitats. The analysis was also performed to check whether species assemblages in edges were clearly separated from those of both adjacent habitats or constituted a transition between them. The main axes were thus interpreted according to their relationships with habitat (woodlot, open habitat or edge) and with specific sites in which the traps were located.
Second, because the species assemblage of edges was found to constitute a transition between adjacent species assemblages, we then determined the DEI on the species assemblage of ground beetles by nonlinear canonical analysis of principal coordinates (NCAP). This method consists of an ordination of species assemblages followed by a nonlinear regression of the first principal coordinate(s) of this ordination, performed on the distance from the boundary (Millar et al., 2005). We chose a logistic model for this regression because we expected varia-tions in the species assemblage of ground beetles to be steepest near the boundary and to decrease further from the boundary (Millar et al., 2005; Baker et al., 2007). The DEI was com-puted as the distance from the boundary giving an assemblage similar to the estimated species assemblage of the habitat cen-tre at the 95% level (i.e. if the NCAP score characterizing woodlots is 1 and that characterizing open habitats is 0, then the respective DEIs in woodlots and open habitats are the dis-tances from the boundary at which the score estimated with the logistic regression is equal to 0.95 and 0.05). The mathematical form of the logistic model fixes a symmetrical curve around the inflection point (corresponding to the boundary in the model) and thus an equal DEI in the two adjacent habitats, which may be ecologically inappropriate. To measure DEI in wood-lots without the constraint of a symmetrical curve around the boundary, we chose to apply the method separately on wood-lots and open habitats. For woodwood-lots, we applied the method only to woodlot traps, and traps located 2.5 and 22.5 m from the boundary in the open habitats (i.e. to represent the open habitat extremity of the species assemblage gradient). Then, we computed the DEI in open habitat by using all open habitat traps and those located 2.5 and 22.5 m from the boundary in the woodlots.
Third, we related the position of species assemblages on the woodlot-open habitat gradient (i.e. the score of traps given by NCAP, used here as the response variable) with environmental
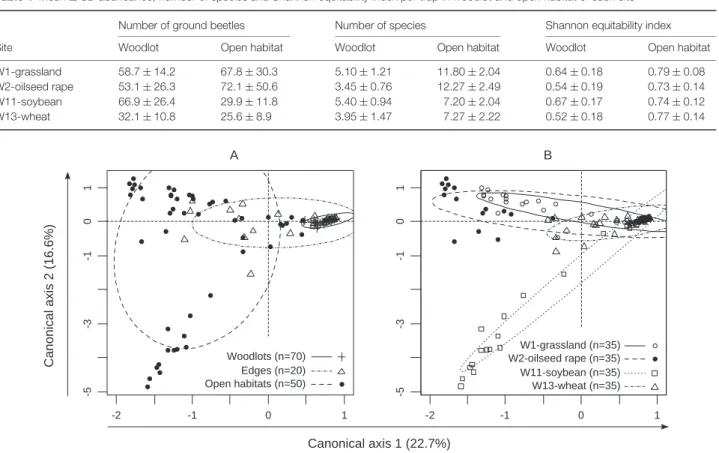
Table 1 Mean ± SD abundance, number of species and Shannon equitability index per trap in woodlot and open habitat of each site
Number of ground beetles Number of species Shannon equitability index
Site Woodlot Open habitat Woodlot Open habitat Woodlot Open habitat
W1-grassland 58.7 ± 14.2 67.8 ± 30.3 5.10 ± 1.21 11.80 ± 2.04 0.64 ± 0.18 0.79 ± 0.08 W2-oilseed rape 53.1 ± 26.3 72.1 ± 50.6 3.45 ± 0.76 12.27 ± 2.49 0.54 ± 0.19 0.73 ± 0.14 W11-soybean 66.9 ± 26.4 29.9 ± 11.8 5.40 ± 0.94 7.20 ± 2.04 0.67 ± 0.17 0.74 ± 0.12 W13-wheat 32.1 ± 10.8 25.6 ± 8.9 3.95 ± 1.47 7.27 ± 2.22 0.52 ± 0.18 0.77 ± 0.14 -2 -1 0 1 -5 -3 -1 0 1 A Woodlots (n=70) Edges (n=20) Open habitats (n=50) -2 -1 0 1 -5 -3 -1 0 1 B W1-grassland (n=35) W2-oilseed rape (n=35) W11-soybean (n=35) W13-wheat (n=35) Canonical axis 1 (22.7%) Canonical axis 2 (16.6%)
Figure 2 Correspondence analysis computed on all the traps used in the present study. Traps were grouped in three classes according to their distance
from boundary (‘edge’ represents traps located 2.5 m from the boundary on both of its sides, ‘woodlot’ and ‘open habitat’ denote the remaining traps in the corresponding habitats; A) or according to the site in which they were located (B). Ellipses represent the main area occupied by each group, and are centred on the barycentre of this group.
variables measured along the transects (used as predictor variables). The scores of woodlot traps were extracted from the NCAP on woodlots and those of open habitat traps were extracted from the NCAP on open habitats. Then, a generalized linear model was computed separately on each of the four sites after having selected relevant predictor variables with a forward stepwise method.
The different transects of each site were not used as pseudoreplicates but all traps were included simultaneously in the same model, for all analyses. All the analyses were performed using r software, version 2.8.1 (R Development Core Team, 2008) and NCAP was performed using the author’s code (Millar, 2005).
Results
We caught a total of 7145 ground beetles belonging to 46 species during the trapping period. Within each site, the abundance of ground beetles was comparable in the woodlot and the adjacent open habitat, except for W11-oilseed rape where ground beetles in the woodlot were twice as abundant than in the open habitat (Student’s t-test, t = 5.6, P < 0.001; Table 1). All woodlots showed similar abundance of ground beetles except W13 in which fewer ground beetles were trapped
compared with the other woodlots (t > 3 and P < 0.005 for all comparisons). W1 and W11 had higher number of species and equitability than W2 and W13 (t > 2.7 and P < 0.01 for all comparisons of species richness between W1 or W11 and W2 or W13; t > 2.1 and P < 0.05 for comparisons of equitability). Finally, the grassland and oilseed rape crop adjacent to W1 and W2 showed a higher abundance and number of species than the other open habitats studied (t > 3.1 and P < 0.005 for all comparisons of abundance between grassland or oilseed rape and wheat or soybean; t > 5 and P < 0.001 for comparisons of species richness). Open habitats had higher number of species per trap and higher evenness than their adjacent woodlot (t > 3 and P < 0.005) except for W11-oilseed rape for which the evenness of ground beetle assemblages was not significantly different between both habitats (t = 1.3 and P = 0.19).
Species assemblages of ground beetles in edges
The first plane of the correspondence analysis clearly showed that the traps on the positive extreme of the first axis (approx-imately half the traps) were grouped and thus had a lower variability of their species assemblage in comparison with the traps on the opposite side of the first axis in this plane (Fig. 2). Looking at the habitat in which the traps were located (Fig. 2A),
0 0.5 1 -20 0 20 40 W1-grassland 8.3 m 0 0.5 1 -20 0 20 60 W2-oilseed rape 3.2 m 0 0.5 1 -20 0 20 80 W11-soybean 4.3 m 0 0.5 1 -20 0 20 130 W13-wheat 3.8 m
Distance from boundary (m)
Gradient
Figure 3 Plots of the logistic gradient (solid line) fitted to the species
assemblage of ground beetles in woodlots along transects perpendicular to woodlot boundaries (nonlinear canonical analysis of principal coordinates method). The vertical axis shows the score of the traps (dots) on the gradient between open habitat and woodlot assemblages. Negative values of distance represent open habitat. Dotted lines indicate the distance from the boundary at which the assemblage is 95% similar to woodlot centre assemblage and the depth of edge influence (DEI) is indicated. Analyses are performed separately on each woodlot. The abscissa axis contains a gap between the last trap on transects and the centre of the woodlot. The respective correlations (R2) of the
logistic regressions for W1-grassland, W2-oilseed rape, W11-soybean and W13-wheat are 0.941, 0.973, 0.909 and 0.911, respectively.
we observed that the aggregated traps with higher value on the first axis were located in woodlots or in edges, whereas the other traps corresponded to open habitat and the remaining edge traps. The second axis discriminated the different open habitats, separating the soybean crop adjacent to W11 from the other open habitats (Fig. 2B).
Edge traps (situated 2.5 m from the boundary in the woodlots and in the adjacent open habitats) were on average located between woodlot and open habitat traps on the first plane of this analysis, revealing that the species assemblages of ground beetles near woodlot boundaries were intermediate between open habitat and woodlot species assemblages.
DEI on the species assemblage of ground beetles
The DEI on the species assemblage of ground beetles in woodlots had a mean ± SD of 4.9 ± 2.3 m and ranged from 3.2 to 4.3 m for W13, W11 and W2, whereas W1 had a DEI of 8.3 m (Fig. 3).
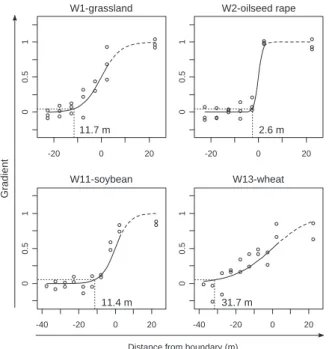
The DEI on the species assemblage of ground beetles in open habitats had a mean ± SD of 14.4 ± 12.3 m. W1-grassland (11.7 m) and W11-soybean (11.4 m) had a similar and median DEI, whereas W2-oilseed rape showed a four-fold lower DEI
Distance from boundary (m)
Gradient 0 0.5 1 -20 0 20 W1-grassland 11.7 m 0 0.5 1 -20 0 20 W2-oilseed rape 2.6 m 0 0.5 1 -40 -20 0 20 W11-soybean 11.4 m 0 0.5 1 -40 -20 0 20 W13-wheat 31.7 m
Figure 4 Plots of the logistic gradient (solid line) fitted to the species
assemblage of ground beetles in open habitats along transects perpendicular to woodlot boundaries (nonlinear canonical analysis of principal coordinates method). The vertical axis shows the score of the traps (dots) on the gradient between open habitat and woodlot assemblages. Negative values of distance represent open habitat. Dotted lines indicate the distance from the boundary at which the assemblage is 95% similar to the estimated assemblage of the open habitat centre and the depth of edge influence (DEI) is indicated. Analyses performed separately on each woodlot. The respective correlations (R2) of the logistic regressions for W1-grassland, W2-oilseed
rape, W11-soybean and W13-wheat are 0.912, 0.970, 0.908 and 0.701, respectively.
(2.6 m) and W13-wheat had a three-fold higher DEI (31.7 m) (Fig. 4). DEI in the open habitat was 1.4-, 2.7- and 8.3-fold higher, respectively, than DEI in the woodlot for W1-grassland, W11-soybean and W13-wheat. W2-oilseed rape was the only site showing a slightly lower DEI (1.2-fold lower) in the open habitat than in the woodlot.
Different edge effects depending on species
Among the species collected, four were classified as for-est species: Abax parallelepipedus Piller & Mitterpacher, Carabus auratusLinnaeus, Carabus nemoralis O.F. M¨uller and Pterostichus madidus Fabricius (cf. Appendix). These species accounted for more than 95% of the individuals caught in each of the four woodlots and Carabus auratus was the dominant species in all woodlots. These four species were present in woodlot edges, as well as in woodlot centres.
As a whole, forest species were also present in the adjacent open habitats, with a decrease in abundance as the distance from the woodlot increased (Fig. 5). This was true of all the species in this group except A. parallelepipedus, which was only found in the woodlots. The presence of forest species in adjacent open habitats was most prominent in the grassland and the
0 40 80 120 -20 0 20 40 W1-grassland 0 40 80 120 -20 0 20 60 W2-oilseed rape 0 40 80 120 -20 0 20 80 W11-soybean 0 40 80 120 -20 0 20 130 W13-wheat -40 -40
Distance from boundary (m)
Abundance of ground beetles
Figure 5 Total abundance of forest (black symbols), generalist (grey
symbols) and open habitat species (open symbols) along the two or three transects for each of the four woodlots studied. Negative values of distance represent open habitat and dashed lines represent the position of the boundary. The abscissa axis contains a gap between the last trap on transects and the centre of the woodlot. The species belonging to the three groups are listed in the Appendix.
wheat crop adjacent to W1 and W13 (respectively). By contrast, open habitat species were rarely trapped in woodlots, except in W1 where the penetration of open habitat species was slightly greater than in the other woodlots. Only five of the species caught were generalist species, and they were caught in fewer numbers compared with forest and open habitat species. They showed greater abundance in open habitats than in woodlots. It is noteworthy that none of the species caught was more abundant in edges than in the adjacent habitats.
Relationship between the species assemblages of ground beetles and environmental variables
The score of the species assemblages on the woodlot–open habitat gradient was related to environmental variables. All of the four models (corresponding to the four sites) computed were highly significant. Litter cover was the most recurrent predictor variable in the models (present in three out of four models; Table 2). Moss cover, bare ground and light intensity were present in two models and vegetation cover in the 0–25 cm, 25–50 cm and 1–2 m strata had a significant contribution in only one model each (Table 2).
Discussion
Species assemblage of ground beetles across woodlot boundaries
The results obtained in the present study show that the main factor that influenced the species assemblages of ground beetles was the position relative to woodlot–open habitat boundary. Its influence was found in all sites, showing consistent edge effects whatever the size of the woodlot or the nature of the adjacent open habitat.
The coexistence of ground beetle species from forest and open habitats in the forest edges has been reported previously for a range of biogeographical and ecological contexts (Bed-ford & Usher, 1994; Baker et al., 2007). However, the existence of edge-associated or edge-preferring species (more frequently caught in forest edges than in core forest area) is controversial. Their presence was observed in a number of studies in temper-ate landscapes (Bedford & Usher, 1994; Magura et al., 2001; Molnar et al., 2001; Magura, 2002), whereas they were not observed in temperate and nontemperate landscapes (Spence et al., 1996; Heli¨ol¨a et al., 2001; Kotze & Samways, 2001; Taboada et al., 2004; Baker et al., 2007). The presence of edge associated species could be related to the natural occurrence of gradual forest edges in the biogeographical context con-cerned, which could have enabled edge specialized species to Table 2 Relationship between nonlinear canonical analysis of principal coordinates score of traps and environmental variables: results of a generalized
linear model after a forward stepwise selection of environmental variables computed separately on each of the four sites
W1-grassland W2-rape W11-soybean W13-wheat
Light intensity −(t = −1.51) −(t = −5.74)∗∗∗ − (t = −21.11)∗∗∗ — Bare ground +(t = 3.02)∗∗ — — +(t = 6.04)∗∗∗ Litter +(t = 4.81)∗∗∗ + (t = 5.43)∗∗∗ — +(t = 11.25)∗∗∗ Moss +(t = 5.09)∗∗∗ — — +(t = 5.63)∗∗∗ V.25 — — — +(t = 2.55)∗ V.50 +(t = 2.57)∗ — — — V2 — — +(t = 2.20)∗ +(t = 1.52) Degrees of freedom 29 32 32 29 Total variance 6.753 8.324 7.941 6.495 Variance explained (%) 92.6 96.7 95.3 93.7
Level to which the coefficient of the variable in the model is different from zero:
∗
P < 0.05;∗∗
P < 0.01;∗∗∗
P < 0.001.
The superior part of the table gives the contribution of each variable to the model. −, negative correlation; +, positive correlation; a blank entry means that the variable was not selected by the algorithm; the number in parenthesis indicates the value of the statistic of the corresponding Student’s t-test. V.25, V.50 and V2 indicate the respective vegetation cover in the 0–25 cm, 25–50 cm and 1–2 m strata.
evolve. The physiognomy of the edges in the present study area, which were generally quite abrupt because of frequent manage-ment operations, could explain the absence of ground beetle species associated with edge habitats. As a consequence of this absence of edge-associated species and the presence of species from both adjacent habitats in the woodlot–open habitat edges, we found that the species assemblage of ground beetles in the edge zone constituted a transition between the assemblages of woodlots and open habitats.
DEI on the species assemblage of ground beetles in woodlots
Quantifying the DEI on ground beetles in forests and woodlots has led to contrasting results being reported in the literature. For ground beetles, values explicitly reported in previous studies are in the range 5–22 m despite the fact that they rely on different trapping designs and concern very diverse ecological and biogeographical contexts such as an agro-forested landscape in England (5 m; Bedford & Usher, 1994), boreal forest–clearcut boundaries (<15 m; Heli¨ol¨a et al., 2001), old forest-grassland boundaries in eastern Europe (approximately 10 m; Magura, 2002) or wet eucalyptus forest-clearcut boundaries (22 m; Baker et al., 2007). The results obtained in the present study match the lower limit of this range. This suggests that, in the landscape of the present study, edge effects in wooded habitats do not extend far from boundaries. The woodlots investigated did not, however, enable us to test the existence of large-scale edge effects as have been reported in several studies showing edge effects reaching hundreds of metres or kilometres (Laurance, 2000; Ewers & Didham, 2008).
Asymmetry of edge effects on the species assemblages in woodlots and open habitats
We have not found previous studies in the literature dealing with the DEI on the species assemblages in open habitats adja-cent to woodlots or forests. The results reported in the present study show that the DEI in open habitats was more variable than that in the woodlots but was of the same order of magnitude (a few metres to a few dozens of metres). The fact that DEI on ground beetles was higher in the open habitat than in the wood-lot in three out of four sites reveals an asymmetrical effect of the boundary on both adjacent habitats in terms of width of the edges created in both adjacent habitats. The higher variability of the DEI in open habitats than in woodlots was probably linked to the fact that woodlots were quite homogeneous in the site despite their different sizes and adjacent habitats, whereas open habitats were much more heterogeneous as a result of the nature of vegetation cover and associated management practices.
Factors related to the DEI on the species assemblages of ground beetles
The presence of forest species in the open habitats was quite important and was more prominent in the sites showing a high DEI in the open habitat, revealing that variability of the
DEI in open habitats was related to the presence of forest species outside the woodlots near the boundary. The presence of ground beetles belonging to forest species at this location could be beneficial to agriculture because most of them are known to prey on pests such as slugs (Symondson et al., 2002). Conversely, open habitat species were much less abundant in woodlots than forest species were in open habitats, which is also the conclusion of a study dealing with forest-farmland edges (Koivula et al., 2004). In the present study, these open habitat species were more abundant in the woodlot that had the highest DEI (W1) than in the other woodlots, so that we can hypothesize that DEI in the woodlots was related to the penetration of open habitat species.
The score of the species assemblages on the gradient between the species assemblages of open habitat and those of woodlots was in most cases correlated with cover by litter, moss, the proportion of bare ground and/or light intensity. This is not unexpected because previous studies have demonstrated the influence of microhabitat for ground beetles, particularly at habitat edges (Lovei & Sunderland, 1996; Magura, 2002). On the basis of this result, we can hypothesize that woodlot edges with trees shading the open habitat could favour the presence of forest species in the open habitat and thus promote their beneficial effects for agriculture.
Pitfall traps give a measure of the activity–density of insects, meaning that the abundance of a species in a trap increases not only with its absolute density, but also with its activity (Thiele, 1977). The low abundance of open habitat species in edges and their confinement to a very narrow edge zone implies that individuals of these species are not numerous and/or are not fully active in the edge. However, predatory beetles, and in particular ground beetles, have been reported to use field margins, hedges and woodlands as overwintering sites (Sotherton, 1985; Kagawa & Maeto, 2009). The presence of the open habitat species that we found in woodlot edges may be linked to individuals moving to open habitats after emergence or returning to edges to lay their eggs, overwinter or protect themselves against disturbance. Accordingly, we can assume that woodlots with boundaries inducing higher DEI will shelter more of these predatory ground beetles. We consequently need to improve our knowledge of the properties determining higher DEI to be able to manage woodlot edges in a way that will make them more likely to shelter predatory arthropods and favour the biological control of crop pests.
In conclusion, we found short-range edge effects on the species assemblage of ground beetles in woodlots, meaning that even small woodlots can host assemblages of ground beetles that are typical of larger woodlots. Many studies dealing with forest fragmentation and edge effects on insects or other animals adopt a conservation point of view because they involve typical forest species present only in large fragments (Magura et al., 2001; Ewers & Didham, 2008; Gaublomme et al., 2008). In the present site, this did not appear to be the case because all woodlots hosted the same species assemblage, with a short-range edge effect. In this agro-forested landscape, the challenge is thus to identify the conditions that would favour the exchange of predatory arthropods between open habitats and woodlots in the context of biological control, namely the spreading of forest species in open habitats to feed on pests
and the movement of open habitat species into woodlot edges to protect themselves from disturbance or to overwinter.
Acknowledgements
We sincerely thank colleagues of UMR DYNAFOR and reviewers for their useful comments on the manuscript and D. Goodfellow for improving the English. We also gratefully acknowledge the farmland and woodlot owners who allowed us to install traps on their private land. This study was funded by the joint Midi-Pyrenees-Aquitaine Regions’ program ‘Forest Biodiversity Dynamics under Global Change’ and the ANR-Biodiversity ‘BiodivAgriM’ program. An Anthony Roume fellowship was granted by the French ministry of Research and Universities.
References
Baker, S.C., Barmuta, L.A., McQuillan, P.B. & Richardson, A.M.M. (2007) Estimating edge effects on ground-dwelling beetles at clearfelled non-riparian stand edges in Tasmanian wet eucalypt forest. Forest Ecology and Management, 239, 92–101.
Barbosa, O. & Marquet, P. (2002) Effects of forest fragmentation on the beetle assemblage at the relict forest of Fray Jorge, Chile. Oecologia, 132, 296–306.
Bedford, S.E. & Usher, M.B. (1994) Distribution of arthropod species across the margins of farm woodlands. Agriculture Ecosystems and Environment, 48, 295–305.
Cadenasso, M.L., Pickett, S.T.A., Weathers, K.C. & Jones, C.G. (2003) A framework for a theory of ecological boundaries. Bioscience, 53, 750–758.
Chen, J.Q., Franklin, J.F. & Spies, T.A. (1992) Vegetation responses to edge environments in old-growth douglas-fir forests. Ecological Applications, 2, 387–396.
Didham, R.K., Ghazoul, J., Stork, N.E. & Davis, A.J. (1996) Insects in fragmented forests: a functional approach. Trends in Ecology and Evolution, 11, 255–260.
Ewers, R.M. & Didham, R.K. (2008) Pervasive impact of large-scale edge effects on a beetle community. Proceedings of the National Academy of Sciences of the United States of America, 105, 5426–5429.
Fahrig, L. (2003) Effects of habitat fragmentation on biodiversity. Annual Review of Ecology Evolution and Systematics, 34, 487–515. Fauna Europaea (2010) Fauna Europaea, Version 2.3. Amsterdam, The
Netherlands. URL http://www.faunaeur.org
Fournier, E. & Loreau, M. (2001) Respective roles of recent hedges and forest patch remnants in the maintenance of ground-beetle (Coleoptera: Carabidae) diversity in an agricultural landscape. Landscape Ecology, 16, 17–32.
Gaublomme, E., Hendrickx, F., Dhuyvetter, H. & Desender, K. (2008) The effects of forest patch size and matrix type on changes in carabid beetle assemblages in an urbanized landscape. Biological Conservation, 141, 2585–2596.
Heli¨ol¨a, J., Koivula, M. & Niemel¨a, J. (2001) Distribution of carabid beetles (Coleoptera, Carabidae) across a boreal forest-clearcut ecotone. Conservation Biology, 15, 370–377.
Hunter, M.D. (2002) Landscape structure, habitat fragmentation, and the ecology of insects. Agricultural and Forest Entomology, 4, 159–166.
H`urka, K. (1996) Carabidae of the Czech and Slovak Republics. Kabourek, Czech Republic.
Jeannel, R. (1942) Col´eopt`eres carabiques, I and II. F´ed´eration Fran-c¸aise des Soci´et´es de Sciences Naturelles, France.
Kagawa, Y. & Maeto, K. (2009) Spatial population structure of the predatory ground beetle Carabus yaconicus (Coleoptera: Carabidae) in the mixed farmland-woodland satoyama landscape of Japan. European Journal of Entomology, 106, 385–391.
Koivula, M., Hyyryl¨ainen, V. & Soininen, E. (2004) Carabid beetles (Coleoptera: Carabidae) at forest-farmland edges in southern Finland. Journal of Insect Conservation, 8, 297–309.
Kotze, D.J. & Samways, M.J. (2001) No general edge effects for invertebrates at Afromontane forest/grassland ecotones. Biodiversity and Conservation, 10, 443–466.
Kromp, B. (1999) Carabid beetles in sustainable agriculture: a review on pest control efficacy, cultivation impacts and enhancement. Agriculture, Ecosystem, Environment, 74, 187–228.
Laurance, W.F. (2000) Do edge effects occur over large spatial scales? Trends in Ecology and Evolution, 15, 134–135.
Lindroth, C.H. (1945) Ground Beetles (Carabidae) of Fennoscandia, 1. Smithsonian Institution Libraries, Washington, District of Columbia. Lovei, G.L. & Sunderland, K.D. (1996) Ecology and behavior of ground beetles (Coleoptera: Carabidae). Annual Review of Entomol-ogy, 41, 231–256.
Magura, T. (2002) Carabids and forest edge: spatial pattern and edge effect. Forest Ecology and Management, 157, 23–37.
Magura, T., Tothmeresz, B. & Molnar, T. (2001) Forest edge and diversity: carabids along forest-grassland transects. Biodiversity and Conservation, 10, 287–300.
Matlack, G.R. (1993) Microenvironment variation within and among forest edge sites in the eastern United States. Biological Conserva-tion, 66, 185–194.
Millar, R.B. (2005) R Software for fitting nonlinear gradient to commu-nity data[WWW document]. URL http://www.stat.auckland.ac.nz/ %7Emillar/NCAP/NCAP.html [accessed in 2008].
Millar, R.B., Anderson, M.J. & Zunun, G. (2005) Fitting nonlinear environmental gradients to community data: a general distance-based approach. Ecology, 86, 2245–2251.
Molnar, T., Magura, T., Tothmeresz, B. & Elek, Z. (2001) Ground beetles (Carabidae) and edge effect in oak-hornbeam forest and grassland transects. European Journal of Soil Biology, 37, 297–300. Murcia, C. (1995) Edge effects in fragmented forests – implications for
conservation. Trends in Ecology and Evolution, 10, 58–62. Pizzolotto, R., Brandmayr, P. & Mazzei, A. (2005) Carabid beetles
in a mediterranean region: biogeographical and ecological features. 11th European Carabidologists’ Meeting (ed. by G. L. Lovei and S. Toft), pp. 244–254. Danish Institute of Agricultural Sciences, Denmark.
Prodon, R. & Lebreton, J.D. (1981) Breeding avifauna of a mediter-ranean succession: the holm oak and cork oak series in the eastern Pyrenees, 1. Analysis and modelling of the structure gradient. Oikos,
37, 21–38.
R Development Core Team (2008) R: A Language and Environment for Statistical Computing.R Foundation for Statistical Computing, Vienna, Austria.
Ribera, I., Foster, G.N., Downie, I.S., McCracken, D.I. & Abernethy, V.J. (1999) A comparative study of the morphology and life traits of Scottish ground beetles (Coleoptera, Carabidae). Annales Zoologici Fennici, 36, 21–37.
Ries, L., Fletcher, R.J., Battin, J. & Sisk, T.D. (2004) Ecological responses to habitat edges: mechanisms, models, and variability explained. Annual Review of Ecology, Evolution, and Systematics,
35, 491–522.
Sotherton, N. (1985) The distribution and abundance of predatory Coleoptera overwintering in field boundaries. Annals of Applied Biology, 106, 17–21.
Spence, J.R., Langor, D.W., Niemel¨a, J., Carcamo, H.A. & Cur-rie, C.R. (1996) Northern forestry and carabids: the case for concern about old-growth species. Annales Zoologici Fennici, 33, 173–184.
Symondson, W.O.C., Sunderland, K.D. & Greenstone, M.H. (2002) Can generalist predators be effective biocontrol agents? Annual Review of Entomology, 47, 561–594.
Taboada, A., Kotze, D.J. & Salgado, J.M. (2004) Carabid beetle occurrence at the edges of oak and beech forests in NW Spain. European Journal of Entomology, 101, 555–563.
Thiele, H.U. (1977) Carabid Beetles in their Environments. Springer-Verlag, Germany.
Thomas, C.F.G., Holland, J.M., & Brown, N.J. (2002) The spatial distribution of carabid beetles in agricultural landscapes. The Agroecology of Carabid Beetles(ed. by J.M. Holland), pp. 305–344. Intercept, U.K.
Warner, D.J., Allen-Williams, L.J., Warrington, S., Ferguson, A.W. & Williams, I.H. (2008) Implications for conservation biocontrol of spatio-temporal relationships between carabid beetles and coleopter-ous pests in winter oilseed rape. Agricultural and Forest Entomology,
10, 375–387.
Appendix List of trapped species with their total abundance, relative abundance in woodlot traps and known habitat
Species Total abundance Relative abundance in woodlots (%) Group
Abax (Abax) parallelepipedus Piller & Mitterpacher, 1783 388 98.7 Forest
Carabus (Tachypus) auratus Linnaeus, 1761 3119 88.9 Forest
Carabus (Archicarabus) nemoralis O.F. M ¨uller, 1764 340 81.8 Forest
Notiophilus quadripunctatus Dejean, 1826 14 78.6
Pterostichus (Steropus) madidus Fabricius, 1775 863 72.8 Forest
Asaphidion stierlini Heyden, 1880 6 50
Carabus (Tachypus) cancellatus Illiger, 1798 125 33.6 Open habitat
Carabus (Megodontus) violaceus purpurascens Fabricius, 1787 60 33.3 Generalist
Trechus (Trechus) quadristriatus Schrank, 1781 43 18.6 Generalist
Harpalus (Harpalus) dimidiatus P. Rossi, 1790 99 13.1 Open habitat
Nebria (Nebria) brevicollis Fabricius, 1792 45 11.1 Generalist
Anchomenus (Anchomenus) dorsalis Pontoppidan, 1763 401 9.7 Open habitat
Microlestes minutulus Goeze, 1777 22 4.5 Open habitat
Brachinus (Brachynidius) sclopeta Fabricius, 1792 806 1.2 Open habitat
Acupalpus meridianus Linnaeus, 1761 1 0 Open habitat
Amara (Amara) aenea De Geer, 1774 3 0 Open habitat
Amara (Amara) anthobia A. Villa & G.B. Villa, 1833 1 0 Open habitat
Amara (Amara) familiaris Duftschmid, 1812 1 0 Open habitat
Amara (Amara) ovata Fabricius, 1792 53 0 Open habitat
Brachinus (Brachynidius) explodens Duftschmid, 1812 35 0 Open habitat
Calathus (Calathus) fuscipes Goeze, 1777 51 0 Open habitat
Chlaenius (Trichochlaenius) chrysocephalus P. Rossi, 1790 55 0 Open habitat
Cicindela (Cicindela) campestris Linnaeus, 1758 1 0 Open habitat
Demetrias (Demetrias) atricapillus Linnaeus, 1758 1 0 Open habitat
Diachromus germanus Linnaeus, 1758 1 0 Open habitat
Dinodes (Dinodes) decipiens L. Dufour, 1820 5 0 Open habitat
Gynandromorphus etruscus Quensel in Sch ¨onherr, 1806 5 0 Open habitat
Harpalus (Harpalus) affinis Schrank, 1781 5 0 Open habitat
Harpalus (Harpalus) atratus Latreille, 1804 1 0 Open habitat
Harpalus (Harpalus) cupreus Dejean, 1829 9 0 Open habitat
Harpalus (Harpalus) distinguendus Duftschmid, 1812 4 0 Open habitat
Harpalus (Harpalus) oblitus Dejean, 1829 3 0 Open habitat
Metallina (Metallina) lampros Herbst, 1784 4 0 Open habitat
Microlestes luctuosus Holdhaus in Apfelbeck 1904 8 0 Open habitat
Ophonus (Hesperophonus) azureus Fabricius, 1775 2 0 Open habitat
Ophonus (Ophonus) diffinis Dejean, 1829 1 0
Parophonus (Parophonus) mendax P. Rossi, 1790 1 0 Generalist
Poecilus (Poecilus) cupreus Linnaeus, 1758 213 0 Open habitat
Pseudoophonus (Pseudoophonus) griseus Panzer, 1796 8 0 Open habitat
Pseudoophonus (Pseudoophonus) rufipes De Geer, 1774 265 0 Open habitat
Pterostichus (Adelosia) macer Marsham, 1802 9 0 Open habitat
Scybalicus oblongiusculus Dejean, 1829 19 0 Open habitat
Stomis (Stomis) pumicatus Panzer, 1796 3 0 Generalist
Syntomus impressus Dejean, 1825 1 0
Syntomus obscuroguttatus Duftschmid, 1812 7 0 Open habitat