HAL Id: insu-01729993
https://hal-insu.archives-ouvertes.fr/insu-01729993
Submitted on 7 Oct 2020
HAL is a multi-disciplinary open access
archive for the deposit and dissemination of
sci-entific research documents, whether they are
pub-lished or not. The documents may come from
teaching and research institutions in France or
abroad, or from public or private research centers.
L’archive ouverte pluridisciplinaire HAL, est
destinée au dépôt et à la diffusion de documents
scientifiques de niveau recherche, publiés ou non,
émanant des établissements d’enseignement et de
recherche français ou étrangers, des laboratoires
publics ou privés.
Distributed under a Creative Commons Attribution - NonCommercial| 4.0 International
License
Exploring the signature of polar lows in infrasound: the
19–20 November 2008 cases
Chantal Claud, Francis Dalaudier, Johan Kero, Alexis Le Pichon, Alain
Hauchecorne, Maxence Rojo, Elisabeth Blanc, Ludwik Liszka
To cite this version:
Chantal Claud, Francis Dalaudier, Johan Kero, Alexis Le Pichon, Alain Hauchecorne, et al.. Exploring
the signature of polar lows in infrasound: the 19–20 November 2008 cases. Tellus A, Co-Action
Publishing, 2017, 69 (1), �10.1080/16000870.2017.1338885�. �insu-01729993�
Full Terms & Conditions of access and use can be found at
https://www.tandfonline.com/action/journalInformation?journalCode=zela20
Tellus A: Dynamic Meteorology and Oceanography
ISSN: (Print) 1600-0870 (Online) Journal homepage: https://www.tandfonline.com/loi/zela20
Exploring the signature of polar lows in
infrasound: the 19–20 November 2008 cases
Chantal Claud, Francis Dalaudier, Johan Kero, Alexis Le Pichon, Alain
Hauchecorne, Maxence Rojo, Elisabeth Blanc & Ludwik Liszka
To cite this article:
Chantal Claud, Francis Dalaudier, Johan Kero, Alexis Le Pichon, Alain
Hauchecorne, Maxence Rojo, Elisabeth Blanc & Ludwik Liszka (2017) Exploring the signature of
polar lows in infrasound: the 19–20 November 2008 cases, Tellus A: Dynamic Meteorology and
Oceanography, 69:1, 1338885, DOI: 10.1080/16000870.2017.1338885
To link to this article: https://doi.org/10.1080/16000870.2017.1338885
© 2017 The Author(s). Published by Informa UK Limited, trading as Taylor & Francis Group
Published online: 03 Jul 2017.
Submit your article to this journal
Article views: 450
View related articles
Tellus
SERIES A DYNAMIC METEOROLOGY AND OCEANOGRAPHYPUBLISHED BY THE INTERNATIONAL METEOROLOGICAL INSTITUTE IN STOCKHOLM
Exploring the signature of polar lows in infrasound:
the 19–20 November 2008 cases
By
CHANTAL CLAUD
1*, FRANCIS DALAUDIER
2, JOHAN KERO
3,
ALEXIS LE PICHON
4,
ALAIN HAUCHECORNE
2, MAXENCE ROJO
2, ELISABETH BLANC
4and LUDWIK LISZKA
5,
1LMD/IPSL, CNRS UMR 8539, École Polytechnique, Université Paris Saclay, ENS, PSL Research University,
Sorbonne Universités, UPMC Univ Paris 06, CNRS, Palaiseau, France;
2LATMOS, CNRS UMR 8190, IPSL,
Université Versailles Saint-Quentin-en-Yvelines, Guyancourt, France;
3Swedish Institute of Space Physics (IRF),
Kiruna, Sweden;
4CEA, DAM, DIF, Arpajon, France;
5Swedish Institute of Space Physics (IRF), Teknikhuset, Umeå,
Sweden
(Manuscript received 7 January 2017; in final form 2 June 2017)
ABSTRACT
We report in this study the infrasound signal measured consistently at four stations in Fennoscandia, associated with the development of two intense cyclones, called polar lows, over the Norwegian Sea. When conditions of propagation are favourable, the infrasound signal comes from the direction of the polar lows, and it follows their track. The results thus, tend to confirm those of a previous study who claimed that an outbreak of three polar lows generated clear infrasound to distances up to 1000 km, according to measurements acquired in Northern Norway and on Svalbard. Because the conditions of propagation of infrasound depend on the state of the atmosphere between the sources and the receivers, signals may remain undetected, which limits the capability of a systematic early warning system, and also of a global monitoring of polar lows. However, the recorded signals might reflect on-going source processes, since convection associated with the polar lows is detected using microwave satellite observations in the areas from which the signals emanate. This suggests that at least part of the signal is due to turbulence induced by convection, in agreement with the earlier study. Nevertheless, more evidence of broadband infrasound measurements of polar low cases have to be examined in order to be able to fully assess the role of other possible sources (swell, surf, lightnings, …). The addition in Northern Norway in late 2013 of the IS37 infrasound station of the International Monitoring Network, developed for the verification of the Comprehensive nuclear-Test-ban Treaty, will provide new opportunities to further investigate this issue.
Keywords: polar lows, infrasound, convection
1. Introduction
Polar lows (PL) are intense high-latitude maritime cyclones, characterised by their small horizontal (200–600 km) and verti-cal (up to 5 km) sverti-cales, as well as a short lifetime of typiverti-cally one to two days (Rasmussen and Turner, 2003). They develop when very cold air is advected over relatively warmer water. Because they are associated with severe conditions (large amplitude ocean waves, near-zero visibility, heavy precipitation, thunder,e.g. Claud et al., 1993), they represent a real hazard for all maritime and coastal activities (fishing, oil drilling, navigation). They how-ever, remain difficult to forecast due to their suddenness and the rarity of conventional observations at these latitudes. In the past, it even happened that some polar lows went undetected until they
affected coastal regions. In the Northern hemisphere, although they may occur over other open sea areas, such as the Labrador Sea, the Japan Sea, the Gulf of Alaska, they are mainly observed over the Norwegian and Barents Sea. Over these seas, for the period 1999–2013, 14 PL events per winter occurred on average, with a strong inter-annual and intra-seasonal variability (Rojo et al., 2015). PL speeds of propagation range between 5 and 13 m/s, but are observed to be highly variable among cases and even during the lifespan of individual PLs. To a considerable extent, the direction of movement is controlled by the large-scale flow in the lowest atmospheric layer. A vast majority of PLs move southward or south-eastward, although a substantial number of PLs have westward and even northward tracks (Rojo et al., 2015).
A variety of mechanisms can play a role and be determinant for the development and maintenance of these systems, result-ing in a long controversy. It is now agreed that there is a large
Citation: Tellus A: 2017, 69, 1338885, http://dx.doi.org/10.1080/16000870.2017.1338885
1
*Corresponding author. e-mail: chclaud@lmd.polytechnique.frTellus A: 2017. © 2017 The Author(s). Published by Informa UK Limited, trading as Taylor & Francis Group.
This is an Open Access article distributed under the terms of the Creative Commons Attribution License (http://creativecommons.org/licenses/by/4.0/), which permits unrestricted use, distribution, and reproduction in any medium, provided the original work is properly cited.
2 C. CLAUD ET AL.
change exposes new ocean areas to extreme weather systems such as PL (e.g. Rojo et al., 2015). PL thus, stand as a perfect example, where infrasound measurements could aid in numeri-cal weather predictions of extreme weather, provided that their signature can be unambiguously extracted. In order to explore the potential of infrasound to monitor PL, a period of seven days in November 2008 has been considered, during which two PL developed over the Norwegian Sea.
The paper is organised as follows. Section 2 offers a brief description of the weather situation and the two PL considered in this study. In Section 3, the infrasound data and their processing are described. Infrasonic signatures recorded at the four stations of the Swedish-Finnish Infrasound Network are presented in Section 4. Finally, the results are summarised and discussed in Section 5.
2. Case studies
The period of interest was characterised by the formation of two intense PL that developed at the rear flank of a large-scale low, within a persisting cold air outbreak over the Norwegian Sea (Mallet et al., 2013). This large-scale low came from the Den-mark Strait, crossed the northern part of the Norwegian Sea head-ing towards Northern Norway and the coast of Troms County.
PL1, the first polar low, formed at around 19:00 UTC on 18 November 2008 close to the Northern coast of Norway at the boundary between the relatively calm inner part of the synoptic low and a much stronger north-easterly wind further west. At that time, the cloud signature was characterised by a ‘spectrum’ of polar lows (Turner et al., 1993) going from purely
baroclinic to purely convective systems, and including hybrid systems. It is even observed that some cases, mostly baroclinic in their incipient stage, can acquire a convective component, later in their development (e.g. Claud et al., 2004).
It is known that convective storms can be an efficient source of infrasound over a wide frequency range (e.g. Georges, 1973; Sindelarova et al. 2015), and potential sources have been exten-sively studied. A paper in 1995, indeed presented infrasound measurements of a PL outbreak in the Norwegian/Barents Sea by two stations in Norway and Svalbard (Orbaek and Naustvik,
1995). These authors considered an outbreak of three PL, which occurred during the period 23–27 March 1992. The infrasound measurements were obtained at Skibotn in Northern Norway and Hornsund on Svalbard and covered a frequency range of 0.2–13 Hz. The PL were shown to generate clear infrasound sig-nals at a frequency range of 2–8 Hz to distances up to 1000 km. Authors attributed the signal to turbulent convection. However, no further study followed this one. Now, progress in propaga-tion modelling in realistic middle and upper atmosphere model (e.g. Evers and Haak, 2010) specifications together with the development of other monitoring techniques like satellite observations, allow a revisit of this issue. An early signature of incipient PL would be of great value for their forecast. Indeed, while some cases seem predictable in numerical weath-er prediction models once the PL has formed, the predictabil-ity of PL is extremely variable among the cases (Kristjánsson et al., 2011). Yet, their impacts on society are highly signifi-cant, and retreating sea ice in the context of on-going climate
3 EXPLORING THE SIGNATURE OF POLAR LOWS IN INFRASOUND
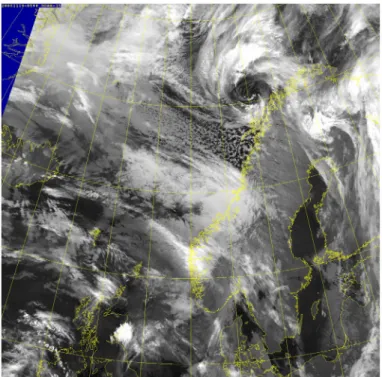
wave-like pattern radiating out along the spiral axis of the low, a good indicator of the strong winds, and from 01:38 UTC on 19 November, the cyclone rearranged into a distinct eye cloud-free pattern (Fig. 1). This experienced a strong development in the evening of 18 November and diminished shortly after 20:00 UTC on 19 November, in the Vesterålen area. During its 25-h life span, PL1 propagated slightly south-eastward in the direction of the Norwegian coast. It decayed half a day after making landfall. PL1 deepened down to 971 hPa and maximum surface wind speeds of 28 m/s surface winds were recorded.
The second polar low (PL2) developed a few hours after PL1 dissipated. From 01:38 UTC on 19 November, satellite imag-es reveal the development of a deep convective cloud mass at the interface between cold and warm air masses located along longitude 5°W and to the north of latitude 70°N. PL2 acquired a well-defined spiraliform structure from 09:43 UTC on 20 November. During its relatively short lifespan of about 19 h, PL2 propagated south-eastward with an average mean speed of 12 m/s and decayed upon reaching land at 21:30 UTC on 20 November. PL2 was characterised by a closed minimum in mean sea-level pressure (mslp) of 967 hPa and extremely strong surface wind speeds (38 m/s). The intensity of PL2 is further revealed by its structure patterns: a narrow eye (aver-aging 360 km on average) encircled by convective clouds (Fig.
2). It is interesting to note that the Norwegian Meteorological Institute issued an extreme weather warning on 20 November 2008, for Trondelag County: « Intensifying wind, reaching full storm 30 m/s at the coast North of the Trondheim Fjord. Strong winds and snowfall will give difficult driving conditions.
Significant wave heights of 10–12 m is expected along the coast this evening and maximum wave heights above 20 m. The strongest winds coincide with high tides » (Nordeng, 2009).
3. Data and methods
Data from four infrasound stations, namely Lycksele, Jämtön, Sodankylä and Kiruna (from south to north), have been con-sidered (available on http://www.umea.irf.se/). Each infrasound station consists of a tripartite array with three Lidström micro-phones separated by 75 m in the north–south and east–west direction, respectively. The system and the data have been described in detail by Liszka (2008). Here, we review some major features, which are important to consider when compar-ing the reported results with data from other infrasound sensors. Each microphone is located inside a wind barrier to reduce noise generated by the turbulence in the air flow. The usage of wind barriers means that air pressure fluctuations do not propagate through narrow pipes as in the spatial filters currently in use at IMS (International Monitoring System) array sites. Hedlin and Raspet (2003) have conducted an experimental comparison of wind barriers and spatial filters. They reported two major dif-ferences that may be of importance to keep in mind when com-paring the detectability (or non-detectability) of unconventional infrasound sources, such as PL. Firstly, for a sensor inside a wind barrier, both the ambient signal and the noise enter from free air and therefore, dispersion of broadband signals that is known to occur in the narrow pipes of spatial filters is not a
4 C. CLAUD ET AL.
4. Infrasound observations
4.1. Azimuth and amplitude of the signal
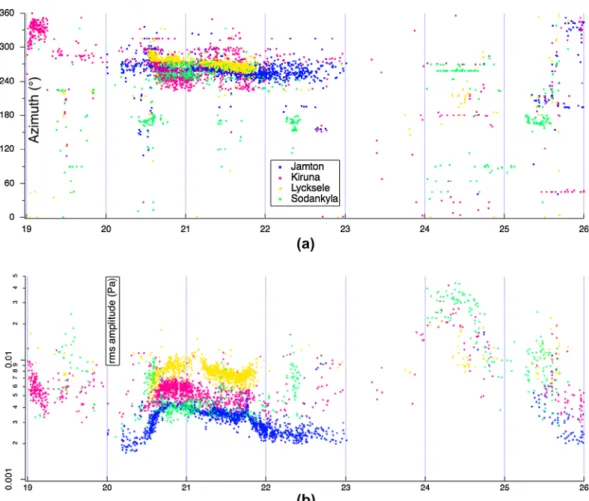
Fig. 3 displays the azimuth and the amplitude of the signals measured at the four stations for the period 19–25 November 2008. A coherent signal which corresponds to PL1 is observed early on 19 November only at Kiruna mostly in the range 320–350°; the signal becomes then less clear. From 20 Novem-ber onwards, the four stations show a consistent signal corre-sponding to PL2, which continues on 21 November and even on 22 November for Jamtön. Later on, only a sporadic signal can be observed. It might be that PL1 entered into the zone of silence. Alternatively, the amplitude suggests that the con-ditions of propagation became less favourable after 06:00 UTC on 19 November (significant decrease of the rms), which like-ly explains why no signal of PL1 is measured after this time, while they progressively become more favourable between 5 and 12:00 UTC on 20 November, depending on the stations. While, strictly speaking, PL 2 has decayed (no visible vortex concern. Secondly, the fact that signals and noise are received at
a single point inside the barrier presents a potentially significant advantage compared to spatial filters, which rely on the differ-ent coherence lengths of signal and noise. Another important feature is the frequency response of the infrasound sensors. The Lidström microphones covers a frequency range from 0.5 to 6.0 Hz, while microbarometers installed at IMS stations and elsewhere, in addition to this range, are sensitive to infrasound of frequency at least one order of magnitude lower (Ponceau and Bosca, 2010).
The Progressive Multi-Channel Correlation algorithm (PMCC; Cansi, 1995; Le Pichon et al., 2010) has been used to detect coherent energy. This algorithm is a time-domain corre-lation method in sliding time-windows and narrow frequency bands. The estimation of the wavefront characteristics (azi-muth, phase velocity, frequency) is performed in 10 adjacent filter bands between 0.5 and 4 Hz and window lengths of 10 s. Microbaroms, surf along coastlines, industrial explosions are dominant sources of signals, near-continuously detected in the Fennoscandia region (Gibbons et al., 2015).
5 EXPLORING THE SIGNATURE OF POLAR LOWS IN INFRASOUND
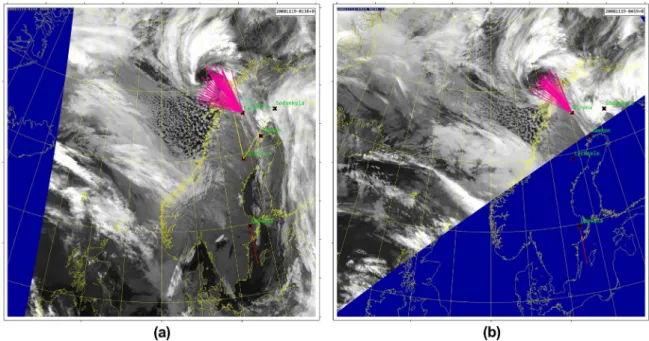
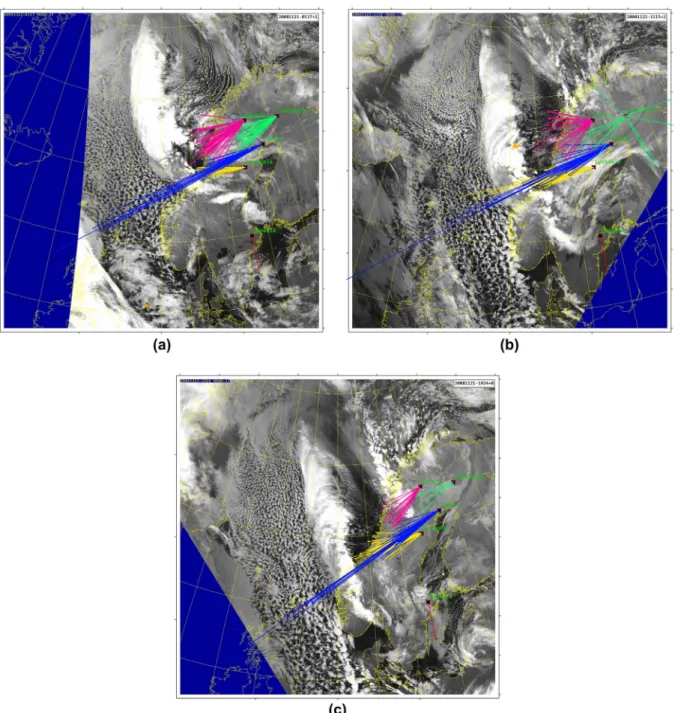
larger to the north-east. At 04:59 UTC (Fig. 4b), the azimuth has slightly narrowed, while PL1 has approached the coast. Lat-er in the day, thLat-ere is no signal detected, likely due to changes in propagation conditions or background noise.
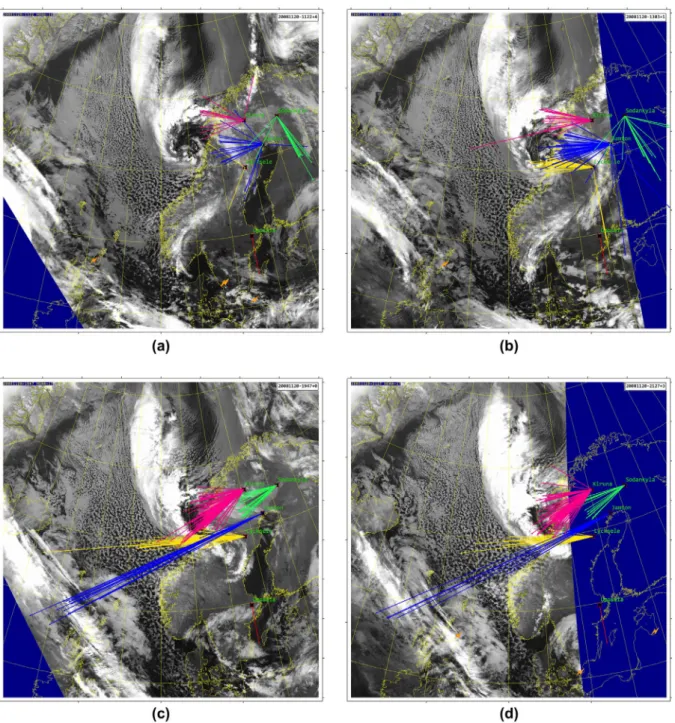
On 20 November, at 11:22 UTC (Fig. 5a), Kiruna and Jämtön record a signal consistent with the location of PL2. At 13:03 UTC (Fig. 5b), the signal is measured at all stations, except Sodanky-la,. Later on, at 19:47 UTC (Fig. 5c), there is a signal from cloud structures that formed PL2 for both Kiruna and Sodankyla, while Jämtön and Lycksele measure a longer- lasting signal which may originate from the coast. At Jämtön, the beam is narrower. The situation is rather similar at 21:27 UTC (Fig. 5d), with a slight southward shift, consistent with the southward displacement of the cloud structures of PL2. At that time, a cloud band north-west of the cyclone has practically merged with the PL clouds.
On 21 November, while PL2 has decayed, the strong residual convective band is probably at the origin of the signals, con-sistently measured at the four stations. At 01:17 UTC (Fig. 6a), only detections at Jämtön display a longer duration, lasting throughout the day. As time goes, the number of detections tends to decrease before the signal totally vanishes late in the day (Fig. 6b–c).
5. Discussion and conclusion
The term ‘infrasound’ refers to acoustic waves with frequencies that are below the lower limit of human hearing (20 Hz). There are several natural sources of infrasound, including volcanoes, on satellite imagery, and see also Section 2), a strong signal
persists throughout 21 November, and even on 22 November for Jamtön. We will see below that a strong convective band, a remnant of PL2, is very likely at the origin of this signal. From 23 November onward, propagation is probably inhibited, while after 24 November, a scattered signature is measured.
If the stations are sorted according to their relative signal strength, their internal order is Lycksele > Kiruna > Sodankylä and Jämtön. The order of the relative signal amplitudes roughly corresponds to the order of the distances from the stations to the polar low. Lycksele and Kiruna, which are located further to the west and closer to the Atlantic Ocean, received a stronger signal than Jämtön and Sodankylä located further east and away from the Atlantic Ocean. Note nevertheless that the propagation conditions are affected by the strength, presence or absence of atmospheric waveguides (Le Pichon et al., 2010).
4.2. Origin and duration of the signal
On Figs. 4–6, the direction of arrival of the infrasound detec-tions as well as the duration of the signal are superimposed on the satellite images. Detections in a time window of 100 min (+/−50 min) centred on the time of the satellite image are shown by an arrow at the position of the station. Each segment points to the estimated direction of arrival; the length of the arrow is scaled to the duration of the detection.
Early in the morning on 19 November (at around 01:38 UTC, Fig. 4a), the signal measured at Kiruna originates from PL1, and the duration is consistent among the detections, slightly
Fig. 4. AVHRR (Advanced Very High-Resolution Radiometer) imagery, plus direction of arrival of the infrasound detections and duration of the signal for 19 November 2008 at (a) 01:38 UTC; (b) 04:59 UTC. (Note that the arrow at Uppsala indicates the arbitrary scale of 100 s). The length of the arrows is scaled to the duration of the detection plus 100 s.
6 C. CLAUD ET AL.
strong detectable signals to distances up to 1000 km, according to measurements acquired in northern Norway and on Svalbard. It must be stressed at this point that the propagation conditions play an important role in the detection capability of infrasound sources (Le Pichon et al., 2012), which might limit the perfor-mance of an early warning system for monitoring PL. However, when detected, some characteristics of the signals might reflect on-going source processes, as will be discussed now.
There are different sources that may explain these signals. The swell associated to the PL is a possible source, but could not be investigated in this study due to the limited frequency ocean waves, but also severe weather. Indeed a number of
observational studies have shown that severe storms can emit strong infrasound in the 0.5–5-Hz frequency range (e.g. Bedard et al., 2004; Szoke et al., 2004; Bedard, 2005; Passner and Noble, 2006; Christie and Campus, 2010).
We report in this study signals measured consistently at four stations in northern Fennoscandia, associated with the devel-opment of two PL over the Norwegian Sea. The direction of arrival of the signals is consistent with the paths of the PL. This study thus, tends to confirm the results of Orbaek and Naustvik,
1995 who claimed that an outbreak of three PL generated
7 EXPLORING THE SIGNATURE OF POLAR LOWS IN INFRASOUND
stage, at a time when there is considerable uncertainty as to the nature of the cloud structures seen in the visible or infrared imagery. This detection is based on temperature depression due to scattering by hydrometeors, as confirmed by comparisons with radar data (Claud et al., 2009). These same channels will however, fail to unambiguously detect weakly convective and mainly baroclinic PL.
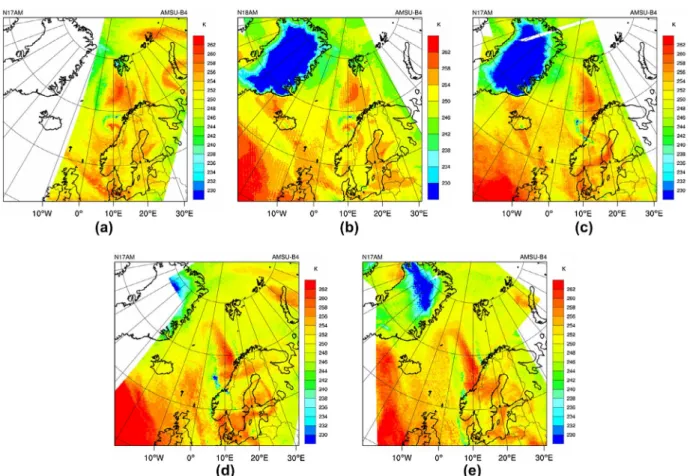
On Fig. 7, we present a sequence of microwave brightness temperatures for the channel of AMSU-B (Advanced Microwave Sounding Unit-B) covering 20–21 November. Over open sea, values of the order or below 240 K can be regarded as convective band of the available sensors (0.6–4.0 Hz). Signals produced
by large surf, both in open sea and at the coast, may have also contributed to the signature. This conclusion is reinforced by the fact that the results presented above suggest two different sources (both in terms of origin and duration), and this would require further investigation. The detected signals could also be associated to persistent emission from lightning flashes. Another possible source could be strong turbulence associated with convection. To further test this idea, we used passive microwave satellite observations at 183 GHz; those channels are indeed able to locate convective PL even in their incipient
8 C. CLAUD ET AL.
studies should also consider full-wave propagation mod-elling coupled with realistic station noise and atmospheric specifications.
Considering its ideal setting near the ocean, the low- background noise at the recording site and the broadband microbarometers used the installation of the IS37 IMS station in Northern Norway in late 2013 (Gibbons et al., 2015) will provide new opportunities for further investigations regarding the aid in numerical weather predictions of extreme weather such as PL. In addition to the new case studies it will permit, further work dealing both with the assimilation of infrasound measurements in atmospheric models and with a better under-standing on how atmospheric variability affects the ability of the infrasound network to detect atmospheric extreme events will be of primary importance for addressing this issue.
Acknowledgements
Authors thank Guo Quan for valuable discussions. AMSU data was obtained obtained through the French Mixed Service Unit project ICARE/Climserv/Aeris. The Swedish-Finnish Infra-sound Network is operated by the Swedish Institute of Space areas, while convection can be considered as particularly
in-tense when values drop below 234 K. PL2 (Fig. 7a–c) is mainly composed of convective clouds, with the most intense convec-tion found first in the north and gradually to the west; in addiconvec-tion it is clear that the cloud band which is a remnant of PL2 on 21 November (Fig. 7d–e), is still extremely convective, which ex-plains why there is still a clear signal measured at the infrasound stations. Convection intensity decreases with time during the day, but the convective band together with another one, practically par-allel but to the north, can still be seen at 18:00 UTC (Fig. 7e).
While, this exploratory study shows convincingly that PL leave an infrasound signature at a distance of hundreds of kilometres, more case studies using broader frequency in-struments have to be considered to draw firm conclusions on the source mechanism involved in the pressure wave generation from PL in high latitude regions. Today, current numerical modelling techniques provide a basis for a better understanding of the role of different factors describing the source and the atmosphere that affect propagation predic-tions (e.g. Norris et al., 2010). To better analyse the detected signals, assess and optimise the infrasound network perfor-mance at high-spatio-temporal resolution, continuing such
Fig. 7. AMSU-B channel 4 Brightness Temperature (in K) sequence for 20 November at around 09:00 UTC (a), 12:00 UTC (b), 18:00 UTC (c), and 21 November at 09:00 UTC (d), 18:00 UTC (e).
9 EXPLORING THE SIGNATURE OF POLAR LOWS IN INFRASOUND
Hedlin, M. A. H. and Raspet, R. 2003. Infrasonic wind-noise reduction by barriers and spatial filters. J. Acoust. Soc. Am. 114, 1379–1386. DOI: 10.1121/1.1598198.
Kristjánsson, J. E., Barstad, I., Aspelien, T., Føre, I., Godøy, Ø. A. and co-authors. 2011. The Norwegian IPY–THORPEX: polar lows and arctic fronts during the 2008 Andøya campaign. Bull. Am. Meteorol.
Soc. 92, 1443–1466. DOI: 10.1175/2011BAMS2901.1.
Le Pichon, A., Ceranna, L. and Vergoz, J. 2012. Incorporating numerical modeling into estimates of the detection capability of the IMS infrasound network. J. Geophys. Res. 117, D05121. DOI:
10.1029/2011JD016670.
Le Pichon, A., Le Pichon, A., Matoza, R. S., Brachet, N. and Cansi, Y. 2010. Recent enhancements of the PMCC infrasound signal detector, inframatics newsletter. Online at: http://www.inframatics. org/
Liszka, L. 2008. Infrasound – a summary of 35 years of infrasound research, IRF Scientific Report 291, January 2008, ISBN 978-91-977255-0-7, ISSN 0284-1703.
Mallet, P.-E., Claud, C., Cassou, C., Noer, G. and Kodera, K..
2013. Polar lows over the Nordic and Labrador Seas: synoptic circulation patterns and associations with North Atlantic winter weather regimes. J. Geophys. Res. 118, 2455–2472. DOI:
10.1029/2012JD018275.
Nordeng, T.-E. 2009. A polar low named Vera – dynamics and model performance, Norwegian Meteorological Institute report.
Norris, D., Gibson, R. and Bongiovanni, K. 2010. Numerical methods to model infrasonic propagation through realistic specifications of the atmosphere. In: Infrasound monitoring for atmospheric studies (eds. A. Le Pichon, E. Blanc and A. Hauchecorne). Springer, pp. 541–573.
Orbaek, J. B. and Naustvik, M. 1995. Infrasonic signatures of a polar low in the Norwegian and Barents Sea on 23–27 March 1992. Tellus 47A, 921–940. DOI: 10.1034/j.1600-0870.1995.00201.x.
Passner, J. E. and Noble, J. M. 2006. Acoustic energy measured in severe storms during a field study in June 2003. Army Research Laboratory Tech. Rep. ARL-TR-3749, 34 pp.
Ponceau, D. and Bosca, L. 2010. Low-noise broadband microbarometers. In: Infrasound monitoring for atmospheric studies (eds. A. Le Pichon, E. Blanc and A. Hauchecorne). Springer, pp. 119–140.
Rasmussen, E. A. and Turner, J. 2003. Polar lows: mesoscale weather systems in the polar regions, Cambridge University Press, 612 pp. Rojo, M., Claud, C., Mallet, P.-E., Noer, G., Carleton, A. M. and
co-authors 2015. Polar low tracks over the Nordic Seas: a 14 winter climatological Analysis. Tellus 67A, 660. DOI: 10.3402/tellusa. v67.24660.
Sindelarova, T., Chum, J., Skripnikova, K. and Base, J. 2015. Atmospheric infrasound observed during intense convective storms on 9–10 July 2011. J. Atmos. Solar-Terr. Phys. 122, 66–74. DOI:
10.1016/j.jastp.2014.10.014.
Szoke, E. J., Bedard, A. J., Thaler, E. and Glancy, R. 2004. A comparison of ISNet data with radar data for tornadic and potentially tornadic storms in northeast Colorado. In: Proceedings of 22nd Conference on Severe Local Storms, Hyannis, MA, 4–8 October. Amer. Meteorol. Soc, Boston, USA.
Turner, J., Lachlan-Cope, T. A. and Thomas, J. P. 1993. A comparison of Arctic and Antarctic mesoscale vortices. J. Geophys. Res. 98, 13019–13034. DOI: 10.1029/92JD02426.
Physics in collaboration with University of Oulu, Sodankylä Geophysical Observatory, Finland. We acknowledge NERC Satellite Receiving Station, Dundee (http://www.sat.dundee. ac.uk/) for AVHRR images.
Disclosure statement
No potential conflict of interest was reported by the authors.
Funding
This work was performed during the course of the ARISE design study (http://arise-project.eu) funded by the European Union’s 7th Framework Programme for Research and Technological Development [grant agreement number 284387]. ARISE is now funded by the European Union’s Horizon 2020 research and innovation programme [grant agreement number 653980].
References
Bedard, A. J. Jr. 2005. Low-frequency atmospheric acoustic energy associated with vortices produced by thunderstorms. Mon. Weather
Rev. 133, 241–263.
Bedard, A. J. Jr, Bartram, B. W., Keane, A. N., Welsh, D. C. and Nishiyama, R. T. 2004. The infrasound network (ISNet): background, design details, and display capability as a 88D adjunct tornado detection tool. Preprints, 22nd Conference on Severe Local Storms, Hyannis, MA, Amer. Meteor. Soc., 1.1.
Cansi, Y. 1995. An automatic seismic event processing for detection and location: the PMCC method. Geophys. Res. Lett. 22, 1021–1024. DOI: 10.1029/95GL00468.
Christie, D. R. and Campus, P. 2010. The IMS infrasound network: design and establishment of infrasound stations. In: Infrasound Monitoring for Atmospheric Studies (eds. A. Le Pichon, E. Blanc and A. Hauchecorne). Springer, pp. 29–75.
Claud, C., Funatsu, B. M., Noer, G. and Chaboureau, J.-P. 2009. Observation of polar lows by the advanced microwave sounding unit: potential and limitations. Tellus 61A, 264–277.
Claud, C., Heinemann, G., Raustein, E. and McMurdie, L. 2004. Polar low le cygne: satellite observations and numerical simulations. Q. J.
R. Meteorol. Soc. 130, 1075–1102.
Claud, C., Mognard, N. M., Katsaros, K. B., Chedin, A. and Scott, N. A.
1993. Satellite observations of a polar low over the Norwegian Sea by special sensor microwave imager, geosat, and TIROS-N operational vertical sounder. J. Geophys. Res. 98, 487–506.
Evers, L. G. and Haak, H. W. 2010. The characteristics of infrasound, its propagation and some early history. In: Infrasound Monitoring for Atmospheric Studies (eds. A. Le Pichon, E. Blanc and A. Hauchecorne). Springer, pp. 3–27.
Georges, T. M. 1973. Infrasound from convective storms: examining the evidence. Rev. Geophys. Space Phys. 11, 571–594. DOI: 10.1029/ RG011i003p00571.
Gibbons, S. J., Asming, V., Eliasson, L., Fedorov, A., Fyen, J and co-authors. 2015. The European Arctic: a laboratory for seismoacoustic studies. Seismol. Res. Lett. 86, 917–928. DOI: 10.1785/0220140230.
