ORIGINAL ARTICLE
Altered expression of CD44 and DKK1 in the progression
of Barrett
’s esophagus to esophageal adenocarcinoma
T. Darlavoix&W. Seelentag&P. Yan&A. Bachmann& F. T. Bosman
Received: 30 December 2008 / Revised: 26 March 2009 / Accepted: 30 March 2009 / Published online: 25 April 2009 # Springer-Verlag 2009
Abstract Barrett’s esophagus (BE) is an acquired condi-tion in which the normal lining of the esophagus is replaced by intestinal metaplastic epithelium. BE can evolve to esophageal adenocarcinoma (EAC) through low-grade dysplasia (LGD) and high-grade dysplasia (HGD). The only generally accepted marker for increased risk of EAC is the presence of HGD, diagnosed on endoscopic biopsies. More specific markers for the prediction of EAC risk are needed. A tissue microarray was constructed comprising tissue samples from BE, LGD, HGD, and EAC. Marker expression was studied by immunohistochemistry using antibodies against CD44, DKK1, CDX2, COX2, SOX9, OCT1, E-cadherin, and β-catenin. Immunostaining was evaluated semi-quantitatively. CD44 expression decreased in HGD and EAC relative to BE and LGD. DKK1 expression increased in HGD and EAC relative to BE and LDG. CDX2 expression increased in HGD but decreased in EAC. COX2 expression decreased in EAC, and SOX9 expression increased only in the upper crypt epithelial cells in HGD. E-cadherin expression decreased in EAC. Nuclear β-catenin was not significantly different between BE, LGD, and HGD. Loss of CD44 and gain of DKK1 expression characterizes progression from BE and
LGD to HGD and EAC, and their altered expression might indicate an increased risk for developing an EAC. This observation warrants inclusion of these immunohistochemi-cally detectable markers in a study with a long patient follow-up.
Keywords Barrett’s esophagus . Esophageal adenocarcinoma . Dysplasia
Introduction
Barrett’s esophagus (BE) is an acquired condition defined as the replacement of normal stratified squamous epithelium by metaplastic columnar epithelium in the distal esophagus [1–3]. BE is acquired due to prolonged gastro-esophageal reflux disease (GERD) which is increasing in incidence [4]. BE is a preneoplastic condition as it predisposes to the development of esophageal adenocarcinoma (EAC) via progression along low-grade dysplasia (LGD) and high-grade dysplasia (HGD). EAC is rapidly increasing in the western world; the incidence has increased over 70% in the last 20 years [5]. Almost without exception, EAC develops in BE [6] and, therefore, early recognition of this condition and endoscopic follow-up are potentially effective ways to prevent EAC.
BE evolves into EAC stepwise through increasing grades of dysplasia. As yet, the marker used for clinical decision making on eventual therapeutic intervention in a BE patient is the presence of HGD in endoscopic biopsies (during the follow-up of BE patients or a newly diagnosed GERD patient). In the presence of HGD, the patient runs a risk of over 40% to develop an EAC, and HGD is therefore an indication for an intervention, which used to be esophagectomy, but lately, more conservative approaches
T. Darlavoix
Academic Medical Center, University of Amsterdam, Amsterdam, The Netherlands
W. Seelentag
Unilabs Lausanne-Cypa, Laboratory of Cytology and Pathology, Lausanne, Switzerland
P. Yan
:
A. Bachmann:
F. T. Bosman (*)University Institute of Pathology, University of Lausanne, Rue du Bugnon 25,
1011 Lausanne, Switzerland e-mail: fred.bosman@chuv.ch
such as photodynamic therapy or mucosectomy have been developed [7,8]. An important problem, however, is that of all patients with BE, only about 0.5% per year will eventually develop an adenocarcinoma [9]. A large number of patients are therefore kept under surveillance for the detection of a relatively small number of cancers. Conse-quently, markers are needed for the prediction of cancer risk in BE patients before HGD has developed.
Various attempts have been made to identify markers that can predict whether or not a BE patient will develop an EAC. Approaches chosen have included morphometry, cell adhesion molecule expression, DNA ploidy analysis, loss of heterozygosity at the chromosomal level, p53 mutations and immunohistochemical overexpression, proliferative activity (through immunohistochemical staining of the Ki-67 antigen), p16 anomalies (including promoter meth-ylation, mutations, and loss of heterozygosity), activation of the Wnt pathway (through adenomatous polyposis coli mutations,β-catenin mutations, or one of the other players in Wnt signaling), analysis of patterns of promoter methylation, and more [10–16]. Although a voluminous literature exists on this subject, as yet, the only clinically used biomarker with a high predictive value is the presence of HGD [10].
In this study, we addressed this problem by examining the expression of genes involved in the Wnt pathway, Wnt downstream genes and key homeobox signaling pathway genes in the normal esophagus, BE with and without dysplasia, and EAC. The genes included in the study were selected based on their involvement in directing differenti-ation, including tissue architecture, in the gastrointestinal tract. The importance of these genes in gastrointestinal cancer has been repeatedly stipulated but almost never in BE or in EAC [13,17–23]. Their expression was studied in retrospectively collected tissue samples selected from surgical resection specimens. The potentially predictive markers must subsequently be validated in a study on Barrett patients with long-term follow-up.
Materials and methods
Selection of cases
The cases selected concerned a consecutive series of esophagectomy specimens received by the University Institute of Pathology in Lausanne, diagnosed as EAC between 1995 and 2007 (52 cases). Cases with insufficient tissue available (either having been used in previous studies or used in the diagnostic work-up) were excluded. In all, 44 cases were available for study. After re-assessment of the diagnosis by two experienced pathologists (WS and FB), 31 cases were retained based upon the following criteria:
presence of at least one or more areas of adenocarcinoma and/or HGD and/or LGD and/or intestinal metaplasia. The use of human tissues in this study was according to the criteria for the use of archival specimens as established by the local ethics review board.
Tissue microarray creation
Tissue samples to be included in the tissue microarray (TMA), notably with EAC, HGD, LGD, and BE, were identified on H&E stained tissue sections. From the 31 cases, 122 different tissue samples were included. Control tissue samples included in each TMA block comprised samples randomly selected from surgical resection specimens (normal ileum, normal duodenum, normal colon, normal esophagus, adenocarcinoma of the colon, and diffuse type and intestinal type adenocarcinoma of the stomach).
The TMAs were created in paraffin-embedded blocks of 2% agarose (Sigma A5093) mounted on a cassette using a manual TMA maker (Beecher Instruments Inc., Sun Prairie, WI, USA), as described previously [24]. Each TMA consisted of a 6×7 grid of 2 mm cores, allowing up to 41 tissue cores per TMA (one varying position was left empty for TMA recognition and proper orientation). Overall, four TMA blocks were constructed including 158 cores (64 EAC, 17 HGD, 19 LGD, and 22 BE samples and 36 control tissue samples). Sections (4μ) were cut, stretched on a 56°C water bath, and mounted on SuperFrost Plus microscope slides (Menzel GmbH & Co KG, Braunschweig, Germany). On one H&E stained section, a final reference diagnosis was made for each tissue core (WS and FTB); this diagnosis was used in the study.
Selection of antibodies
Our selection of the target proteins was based upon the hypothesis that Wnt signaling and Wnt downstream genes play a key role in EAC development, in analogy to gastric and colorectal cancer. A first selection was made on the involvement of Wnt target genes in human gastrointestinal carcinogenesis as mentioned on the Wnt homepage (http:// www.stanford.edu/~rnusse/wntwindow.html). A final selec-tion was made based upon the published literature supporting potential involvement of the various proteins in gastrointes-tinal mucosa differentiation or in intesgastrointes-tinal carcinogenesis [13,18,19,25–31] and on the available antibodies applicable to routinely processed tissue specimens. As a readout protein for Wnt pathway activation, nuclear localization ofβ-catenin was used. As Wnt downstream proteins, we chose CD44, COX2, E-cadherin, CDX2, DKK1, and SOX9. Two homeo-box proteins (CDX2 and OCT1) were included in the study, based on earlier reports indicating involvement of these proteins in intestinal metaplasia/dysplasia [21,25,30,31].
Immunohistochemistry
Immunohistochemistry (IHC) was performed either manu-ally or using an automated system (as indicated in Table1). The choice of using one system or the other was based upon the quality of the staining obtained, some antibodies requiring a specially adapted protocol not easily adaptable to the staining machine.
Manual immunoperoxidase staining was performed, after dewaxing, quenching of endogenous peroxidase activity (by incubation with 3% hydrogen peroxide in demineralized water for 5 min), and antigen retrieval (2 min in a pressure cooker in ethylenediaminetetraacetic acid (EDTA) buffer, pH 9.0), using Envision+ (DAKO, Glostrup, Denmark) as detection system [24]. Exposure to primary antibodies, diluted as indicated in Table 1, was 2 h at room temperature. Visualization was performed with diaminobenzidine tetrachloride as chromogen. Sections were counterstained with hematoxylin.
Automated IHC was performed using the Bond IHC stainer (Vision BioSystems, Mount Waverley, Australia) with as secondary reagent, anti-goat Histofine max polymer (Nichirei Biosciences, Tokyo, Japan). Key program sequences were antigen retrieval (with EDTA buffer pH 9.0 for 20 min at 95°C or citrate buffer pH 9.0 for 20 min at 100°C), primary antibody incubation for 30 min, and incubation with the polymer kit for 15 min. In all experiments, negative control incubations (omission of the primary antibody) and positive control tissues were included.
Assessment of immunoreactivity
The immunoreactivity was microscopically evaluated inde-pendently by two observers (WS and PY) in terms of the percentage of cells stained (in deciles). Given the zonal architecture of BE mucosa, the percentage of positive cells was noted separately for the upper crypt half and the lower crypt half in BE, LGD, and HGD but only as a percentage
of all cells in EAC. No major discrepancies occurred between the two assessors; the mean of the two assessments was used for statistical calculations.
Data was entered in SPSS version 15.0 for Windows (SPSS Inc., Chicago, IL, USA), and descriptive analysis was undertaken, together with a one-way ANOVA test to assess statistical significance between the values obtained for localization and diagnostic category. For comparison between BE, LGD, and HGD, upper and lower crypt half were considered separately. For comparisons with EAC, the highest (either upper of lower) crypt value was used. Differences between diagnostic categories were analyzed using Tukey’s honestly significant difference post hoc test, graphically visualized by box-plot graphs. In the graphs, for the sake of clarity, outliers have been indicated separately (with the symbols white circle or filled star in the figures, the numbers referring to the outlying sample number), but the data points were included in the statistical calculations. The number of samples available precluded the use of validated statistical approaches (receiver operating charac-teristic (ROC) analysis) to determine eventual cut-points. To explore potential diagnostic use of these markers, we arbitrarily chose 30% loss of CD44 (absence of membranous immunos-taining in at least 30% of the cells) and 30% gain of DKK1 (cytoplasmic staining of at least 30% of cells) as cut-points.
Results
The results obtained by scoring of the immunostained TMAs are illustrated in the figures and summarized in Table2. We will briefly describe immunoreactivity patterns per studied antigen.
CD44 and DKK1
In general, CD44 immunoreactivity was found on the plasma membrane of epithelial cells. A minority of the
Table 1 Antibodies used with their dilution, antigen retrieval method, and immunohistochemistry method
Antigen Source Clone Species Concentration IHC method
ß-catenin Novocastra 17C2 Mouse 1:100 A
CD44 CHUV Wild-type PCA Mouse 1:50 A
COX2 Cayman synth pept Mouse 1:1,000 B
DKK1 Lifespan PCA Rabbit 1:100 B
E-cadherin DAKO NCH-3.8 Mouse 1:40 A
CDX2 Novocastra AMT28 Mouse 1:50 A
OCT1 LabVision PCA Rabbit 1:50 A
SOX9 Chemicon PCA Rabbit 1:400 A
A: manual Envision system (DAKO, Glostrup, Denmark), heat-induced epitope retrieval: pressure cooker 2 min EDTA pH 9.0 B: bond automated IHC system (Vision BioSystems, Mount Waverley, Australia), heat-induced epitope retrieval in EDTA pH 9.0 PCA polyclonal antibody
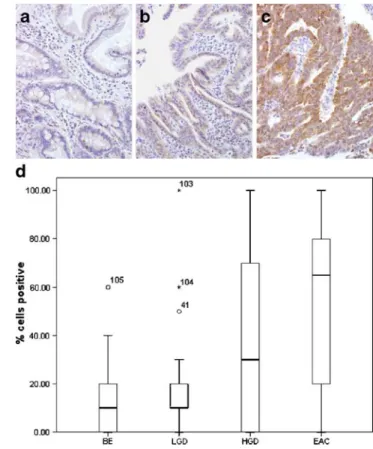
epithelial cells expressed CD44 circumferentially; the vast majority showed focal membrane expression. Stromal cells also stained strongly but were not included in the cell count. Significant loss of CD44 staining of crypt epithelial cells was found in HGD in comparison with BE and LGD (Fig.1a–c).
This was also found for CD44 staining in HGD and EAC vs BE and LGD, as graphically illustrated in Fig.1d.
DKK1 stained the cytoplasm with appreciable differ-ences in intensity between samples. EAC showed more intense immunoreactivity (Fig. 2a–c). More lower crypt
cells expressed DKK1 in HGD than in BE and LGD. In EAC, strong diffuse cytoplasmic immunoreactivity was noted. Overall, DKK1 expression was significantly higher in HGD and EAC than in BE and LGD (Fig.2d; Table2). Given the consistent differences in CD44 and DKK1 expression notably between LGD and HGD, we chose as arbitrary cut-points 30% loss of CD44 and 30% gain of DKK1 expression. With these parameters, the combination of loss of CD44 and gain of DKK1 was only found in HGD samples but with low (29%) sensitivity for HGD (Table3).
Altered expression of at least one marker attained high specificity and sensitivity (94% and 80%, respectively).
CDX2
CDX2 was only expressed in the nuclei of epithelial cells. EAC often stained diffusely. CDX2 expression was significantly higher in upper crypt epithelium in HGD than in upper crypt epithelium in BE (Fig. 3a–c; Table 2). Overall, CDX2 expression was significantly lower in EAC than in HGD (Fig. 3d; Table2).
SOX9
SOX9 showed a nuclear staining pattern with limited variation between tissue samples. In some HGD cases, strong SOX9 staining was noted in upper crypt epithelium (Fig. 4a, b). SOX9 expression was not strikingly increased in each HGD case but, overall, significantly higher in HGD than in BE or LGD (Fig.4c).
Table 2 Semiquantitative results of immunohistochemical staining
Antibody BE LGD HGD EAC p value Significant between diagnoses
Mean SD Mean SD Mean SD Mean SD
CD44 Crypt 86 18 85 13 53 30 <0.001 BE and LGD vs HGD
Upper 44 33 46 36 40 36 0.843
Total 86 18 85 13 47 36 48 37 <0.001 BE and LGD vs HGD and EAC
DKK1 Crypt 19 12 21 20 49 28 0.001 BE and LGD vs HGD
Upper 11 13 19 26 29 33 0.084
Total 16 15 21 25 35 37 51 35 <0.001 BE and LGD vs EAC
CDX2 Crypt 50 27 59 23 61 26 0.264 Upper 32 25 43 33 63 23 0.005 BE vs HGD Total 48 28 48 33 66 23 33 34 0.002 HGD vs EAC OCT1 Crypt 33 26 42 28 47 27 0.320 Upper 20 23 26 28 32 30 0.349 Total 28 29 35 31 41 32 29 30 0.446 SOX9 Crypt 95 4 94 2 95 5 0.720 Upper 81 11 79 21 93 5 0.010 BE and LGD vs HGD Total 95 4 89 22 96 4 89 15 0.100 COX2 Crypt 93 15 93 21 94 12 0.982 Upper 91 14 90 23 96 10 0.582
Total 95 8 93 21 96 10 73 24 <0.001 BE, LGD, and HGD vs EAC
E-cadherin Crypt 100 1 100 0 100 0 0.480
Upper 100 1 100 0 100 0 0.490
Total 100 1 100 0 100 0 79 31 <0.001 BE, LGD, and HGD vs EAC
β-catenin Cytoplasm 97 11 96 18 72 33 63 34 <0.001 BE and LGD vs EAC
Nuclear 0 0 1 3 1 3 6 14 0.150
Results of descriptive and statistical analysis for obtaining p values using ANOVA test. A Tukey’s honestly significant difference post hoc test was performed for assessing the significance of the differences between diagnoses. As statistically significant, we considered p<0.05. Mean and SD values are noted in percentages
COX2
COX2 showed strong immunoreactivity in the cytoplasm of epithelial cells (Fig. 5a, b). In EAC, expression was lower (Fig.5c). In BE, LGD, and HGD, COX2 expression was significantly higher than in EAC (Fig.5d). COX2 was also expressed in inflammatory cells, notably macro-phages, but this was not taken into account in scoring the results.
OCT1
OCT1 was expressed in nuclei of epithelial and stromal cells. In BE, crypt cell nuclei were most intensely stained. Significant differences were not noted between LGD and HGD or EAC (data not shown).
E-cadherin
E-cadherin was strongly immunostained with a membra-nous pattern in all samples with the exception of EAC. In EAC, staining was decreased and very heterogeneous (data
not shown), some areas retaining E-cadherin expression and others with complete loss. In the invasion front in EAC, individual invasive cells did not show membranous staining but occasionally cytoplasmic staining.
Fig. 2 DKK1 expression in BE (a), HGD (b), and EAC (c). Cytoplasmic DKK1 expression was focal and weak in BE, more widespread in HGD, and strong in EAC. d Box plot of percentage of cells expressing DKK1 per diagnostic category (BE and LGD vs EAC, p<0.001)
Fig. 1 CD44 staining in BE (a), HGD (b), and EAC (c). Crypt cells in BE show strong membranous staining, which is lost in HGD and EAC. Note that stromal cells also show CD44 immunoreactivity. d Box plot of the percentage of CD44 positive cells per diagnostic category (BE and LGD vs HGD and EAC, p<0.001)
Table 3 Sensitivity and specificity of CD44 loss and DKK1 gain for the differentiation between LGD and HGD
Marker expression Histology
HGD LGD Total
CD44L/DKK1G 5 0 5
CD44L/DKK1N or CD44N/DKK1G 11 4 15
CD44N/DKK1N 1 15 16
Total 17 19 36
CD44L=CD44 loss (more than 30% of cells) CD44N=normal pattern of CD44 expression
DKK1G=gain in DKK1 expression (more than 30% of the cells) DKK1N=less than 30% DKK1 expression
Specificity of CD44L/DKK1G for HGD 5/5=100% Sensitivity of CD44L/DKK1G for HGD 5/17=29%
Specificity of at least one aberrant marker for HGD 16/17=94% Sensitivity of at least one aberrant marker for HGD 16/20=80% Specificity of CD44N/DKK1N for LGD 15/19=79%
β-catenin
In BE and LGD, strong membranous staining was found. BE and LGD showed a higher percentage of β-catenin positive cells than EAC. Nuclear staining was found almost exclusively in EAC (Fig.6). Statistical analysis indicated a significant decrease in membranousβ-catenin expression in EAC (Table2).
Discussion
The aim of this study was to identify proteins that show altered expression during the progression of BE to EAC, with as final goal the definition of markers that will allow the identification of BE patients with a high risk for EAC development. Gene expression profiling studies with this aim have been published [32] but, as yet, have not resulted in significant progress.
In the design of the study, several elements merit brief consideration. Firstly, the choice of the material studied: we conducted the study on a limited number of tissue samples (122) from 31 patients. We do not consider the small
number of patients an important limitation in our study, as the intention was to identify promising markers rather than validating them in a long-term follow-up case control approach. Therefore, the endpoint we used was not patient outcome but histological diagnosis per sample. Further studies would have to include BE and LGD samples from patients who did not develop HGD or EAC.
A second consideration is our choice to score immuno-reactivity in BE, LGD, and HGD separately in the lower and the upper crypt. This division is somewhat arbitrary and could be subject to inter-observer variation. We attempted to improve the reproducibility of the scoring results through implication of two independent observers. These obtained very similar results, confirming the reliability of our observations. A further consideration is the way we compared BE, LGD, and HGD with EAC. As in EAC, mucosal architecture is completely lost, rendering lower and upper crypt scores without meaning; we compared scores in EAC with the highest score (either upper crypt or lower crypt) in LGD and HGD for our statistical evaluations. We
Fig. 4 Nuclear SOX9 expression was observed in BE mainly in the lower crypt region (a) but in HGD, extended all the way to the surface (b). c Box plot of the percentage SOX9 positive cells per diagnostic category (BE and LGD vs HGD and EAC, p=0.01)
Fig. 3 CDX2 expression in BE (a), HGD (b), and EAC (c).Nuclear expression was observed in BE in the crypt epithelium, extending to upper crypt epithelium all the way to the surface in HGD. CDX2 expression was decreased in EAC. d Box plots of the percentage of CDX2 positive cells per diagnostic category (BE vs HGD, p=0.005; HGD vs EAC, p=0.002)
deem this justified as no important differences were noted when the mean of the two values was used.
Finally, we scored immunoreactivity as a continuous variable rather than in terms of positive or negative, as cut-points could not be established using validated statistical approaches (e.g., ROC analysis). Using this experimental design, we found the expression of several of the studied markers to differ significantly between BE, LGD, HGD, and EAC. Taking as an arbitrary cut-point 30% loss of CD44 and 30% gain of DKK1 expression, the combination of these two markers seems promising.
CD44 and DKK1
CD44 has been extensively studied in colorectal cancer [33] and, also, in BE where decreased expression of wild-type CD44 in glandular epithelium was reported [34,35] with a shift from focal in BE to more diffuse in BE with dysplasia. We found wild-type CD44 expression to have significantly decreased in the crypt base epithelium only in HGD, which
is in contrast to the findings of Menges et al. [35,36]. Also, in EAC, we noted a decreased level.
Dickkopf-1 (DKK1) is a Wnt antagonist protein that specifically inhibits Wnt canonical signaling by interacting with the co-receptor Lrp-5/6 and, thus, prevents Wnt and Frizzled from forming a ternary complex with Lrp-5/6 [37]. Expression of members of the DKK1 family has been studied before in colorectal cancer, showing a differential expression pattern between normal colon epithelium and colorectal cancer [29]. However, epigenetic silencing of DKK1 has been reported in colorectal cancer [38, 39]. DKK1 has been studied before in reflux esophagitis and in BE but not in EAC [40]. We found DKK1 expression to have increased significantly in HGD and EAC in compar-ison with BE and LGD. This result is counterintuitive, as silencing of its repressor conceptually should to go along with activated Wnt signaling. Overexpression of a repressor could, however, also signify activation downstream of its site of action, sustained expression being the result of a defective feedback loop. It has in addition been reported that DDK1 may inhibit tumorigenesis through Wnt path-way independent mechanisms.
In all, loss of CD44 and gain of DKK1 expression might be taken as indicators of the progression from LGD to HGD. This is a novel finding and warrants detailed study, including confirmation by western blotting and reverse transcription polymerase chain reaction, as a marker for progression of BE to EAC.
CDX2, OCT1, SOX9, and COX2
The caudal-related homeobox gene CDX2 encodes an intestine-specific transcription factor crucial for the regulation of differentiation of intestinal cells [21]. Immunostaining of CDX2 has been proposed as a useful marker for the identification of intestinal metaplasia in BE [15, 25, 31,
41]. Overall, we observed increased CDX2 expression in
Fig. 6 β-catenin expression shows a strong membranous immunos-taining pattern in BE (a) but a nuclear simmunos-taining pattern in EAC (b) Fig. 5 Diffuse cytoplasmic COX2 expression was found in BE (a),
LGD, and HGD. The percentage of COX2 positive cells was decreased in EAC (b). c Box plot of the percentage of COX2 positive cells per diagnostic category (BE, LGD and HGD vs EAC, p<0.001)
HGD relative to BE and LGD, which then decreases in EAC. The widely varying values in individual cases preclude the use of CDX2 for the diagnosis of HGD. Our observations match those of Villanacci et al. [25]. It has been reported that CDX2 expression is modulated by OCT1, but we did not find OCT1 expression to differ significantly between the diagnostic categories, suggesting that the changes in CDX2 expression we observed are not due to concomitant changes in OCT1 expression, as previous research suggests [21]. How CDX2 and OCT1 interact remains largely unclear, and more research on this subject has to be conducted.
SOX genes constitute a family of transcription factors, belonging to a super-family known as the high mobility group box and play an important role in, among others, the development of the intestinal tract [42]. SOX9 has been reported to be regulated by the Wnt pathway, and it represses CDX2 expression in intestinal crypts [43].
We found SOX9 expression to have slightly but significantly increased in upper crypt epithelium in HGD. For SOX9 and CDX2 to both show increased expression in the upper crypt epithelium in HGD was an unexpected result, given the repressive influence of SOX9 on CDX2 expression [43]. In the regulation of CDX2 expression, evidently, other factors than only SOX9 are involved. The wide variation in expression of SOX9 in individual cases precludes its use for diagnostic purposes.
COX2 was shown to be functionally active in BE since treatment with COX2 inhibitors reduced proliferative activity of BE cells in culture as well as of EAC cells [2]. COX2 polymorphisms have been reported to be associated with increased risk for EAC [44]. An effect of the polymorphism studied (the 8473 C allele) on the immuno-histochemical expression level was, however, not reported. We found the percentage of COX2 expressing cells were signifi-cantly reduced in EAC, relative to the other disease categories. This matches the results obtained by Villanacci et al. [25], who attributed the lower expression of COX2 to the poor differentiation grade of the EAC in their series. In our group of EAC, the number of poorly differentiated EACs was also high. Our data, notably the absence of any difference in COX2 expression between BE, LGD, and HGD, imply that COX2 is not a potential marker for progression of BE towards EAC.
E-cadherin andβ-catenin
E-Cadherin belongs to the family of the cadherin trans-membrane proteins, which play an important role in cell adhesion notably in the formation of adherence junctions through homotypic interactions. Earlier studies on the involvement of E-cadherin in the development of EAC suggest that there is decreased expression with progressive degrees of dysplasia [26,45]. Although we were unable to
reproduce the differences between LGD and HGD, we did find a significant decrease in EAC relative to HGD. E-cadherin is more likely related to the development of invasive activity and, as such, a marker of EAC. A role in the discrimination between BE and LGD on one hand and HGD on the other is unlikely.
Nuclear β-catenin is an indicator of canonical Wnt activation. When accumulating in the nucleus, β-catenin forms a complex with lymphoid enhancer factor (LEF1), T-cell factor (TCF4), and other transcription factors [13]. Unlike in many other carcinomas, mutations in theβ-catenin gene do not play a role in EAC [46], the mechanisms involved in Wnt activation having been incompletely resolved to date. The key regulators of the Wnt pathway in EAC are probably different from those in other carcinomas as is stated by Clement et al. [12]. We found no statistically significant differences in β-catenin expression between BE and LGD or HGD. The Wnt pathway is likely to be involved in the development of EAC [12,13] but in EAC invasion rather than in the progression from BE to dysplasia.
In conclusion, our data indicate that loss of CD44 and gain of DKK1 expression characterizes the transition from LGD to HGD, which might go along with an increased risk for developing an EAC. This observation warrants their inclusion into a follow-up study. The first goal of this study would be to confirm our findings in a larger series of cases. Ultimately, when these findings are confirmed, these markers should be included in a prospective clinicopatho-logical study with long-term patient follow-up to confirm their significance as indicators for an increased risk for the development of EAC from BE.
Conflict of interest We declare that we have no conflict of interest.
References
1. Flejou JF (2000) Barrett’s oesophagus: from metaplasia to dysplasia and cancer. Gut 54(Suppl 1):i6–i12
2. Koppert LB, Wijnhoven BP, van Dekken H et al (2005) The molecular biology of esophageal adenocarcinoma. J Surg Oncol 92:169–190
3. Playford RJ (2006) New British society of gastroenterology (BSG) guidelines for the diagnosis and management of Barrett’s oesophagus. Gut 55:442
4. el-Serag HB, Sonnenberg A (1998) Opposing time trends of peptic ulcer and reflux disease. Gut 43:327–333
5. Blot WJ, McLaughlin JK (1999) The changing epidemiology of esophageal cancer. Semin Oncol 26(5 Suppl 15):2–8
6. Farrow DC, Vaughan TL (1996) Determinants of survival following the diagnosis of esophageal adenocarcinoma (United States). Cancer Causes Control 7:322–327
7. Falk GW, Rice TW, Goldblum JR et al (1999) Jumbo biopsy forceps protocol still misses unsuspected cancer in Barrett’s esophagus with high-grade dysplasia. Gastrointest Endosc 49:170–176
8. Heitmiller RF, Redmond M, Hamilton SR (1996) Barrett’s esophagus with high-grade dysplasia. An indication for prophy-lactic esophagectomy. Ann Surg 224:66–71
9. Shaheen NJ, Crosby MA, Bozymski EM et al (2000) Is there publication bias in the reporting of cancer risk in Barrett’s esophagus? Gastroenterology 119:333–338
10. Flejou JF, Svrcek M (2007) Barrett’s oesophagus—a pathologist’s view. Histopathology 50:3–14
11. Morales CP, Souza RF, Spechler SJ (2002) Hallmarks of cancer progression in Barrett’s oesophagus. Lancet 360:1587–1589 12. Clement G, Braunschweig R, Pasquier N et al (2006) Alterations
of the Wnt signaling pathway during the neoplastic progression of Barrett’s esophagus. Oncogene 25:3084–3092
13. Doucas H, Garcea G, Neal CP et al (2005) Changes in the Wnt signalling pathway in gastrointestinal cancers and their prognostic significance. Eur J Cancer 41:365–379
14. Shi XY, Bhagwandeen B, Leong AS (2008) p16, Cyclin D1, Ki-67, and AMACR as markers for dysplasia in Barrett esophagus. Appl Immunohistochem Mol Morphol 16:447–452
15. Shi XY, Bhagwandeen B, Leong AS (2008) CDX2 and villin are useful markers of intestinal metaplasia in the diagnosis of Barrett esophagus. Am J Clin Pathol 129:571–577
16. Nair KS, Naidoo R, Chetty R (2005) Expression of cell adhesion molecules in oesophageal carcinoma and its prognostic value. J Clin Pathol 58:343–351
17. Taketo MM (2006) Wnt signaling and gastrointestinal tumorigenesis in mouse models. Oncogene 25:7522–7530
18. Okamoto R, Watanabe M (2004) Molecular and clinical basis for the regeneration of human gastrointestinal epithelia. J Gastro-enterol 39:1–6
19. Johnson ML, Rajamannan N (2006) Diseases of Wnt signaling. Rev Endocr Metab Disord 7:41–49
20. van Es JH, van Gijn ME, Riccio O et al (2005) Notch/gamma-secretase inhibition turns proliferative cells in intestinal crypts and adenomas into goblet cells. Nature 435:959–963
21. Almeida R, Almeida J, Shoshkes M et al (2005) OCT-1 is over-expressed in intestinal metaplasia and intestinal gastric carcinomas and binds to, but does not transactivate, CDX2 in gastric cells. J Pathol 207:396–401
22. Bian YS, Osterheld MC, Fontolliet C et al (2002) p16 inactivation by methylation of the CDKN2A promoter occurs early during neoplastic progression in Barrett’s esophagus. Gastroenterology 122:1113–1121
23. Brantjes H, Barker N, van Es J et al (2002) TCF: lady justice casting the final verdict on the outcome of Wnt signalling. Biol Chem 383:255–261
24. Yan P, Seelentag W, Bachmann A et al (2007) An agarose matrix facilitates sectioning of tissue microarray blocks. J Histochem Cytochem 55:21–24
25. Villanacci V, Rossi E, Zambelli C et al (2007) COX-2, CDX2, and CDC2 immunohistochemical assessment for dysplasia-carcinoma progression in Barrett’s esophagus. Dig Liver Dis 39:305–311 26. Bailey T, Biddlestone L, Shepherd N et al (1998) Altered cadherin
and catenin complexes in the Barrett’s esophagus-dysplasia-adenocarcinoma sequence: correlation with disease progression and dedifferentiation. Am J Pathol 152:135–144
27. Pinto D, Clevers H (2005) Wnt, stem cells and cancer in the intestine. Biol Cell 97:185–196
28. Clevers H, Batlle E (2006) EphB/EphrinB receptors and Wnt signaling in colorectal cancer. Cancer Res 66:2–5
29. Gregorieff A, Pinto D, Begthel H et al (2005) Expression pattern of Wnt signaling components in the adult intestine. Gastroenterology 129:626–638
30. Mutoh H, Sakamoto H, Hayakawa H et al (2006) The intestine-specific homeobox gene Cdx2 induces expression of the basic helix-loop-helix transcription factor Math1. Differentiation 74:313–321
31. Liu T, Zhang X, So CK et al (2007) Regulation of Cdx2 expression by promoter methylation, and effects of Cdx2 transfection on morphology and gene expression of human esophageal epithelial cells. Carcinogenesis 28:488–496
32. Greenawalt DM, Duong C, Smyth GK et al (2007) Gene expression profiling of esophageal cancer: comparative analysis of Barrett’s esophagus, adenocarcinoma, and squamous cell carcinoma. Int J Cancer 120:1914–1921
33. Ngan CY, Yamamoto H, Seshimo I et al (1996) Expression of CD44H and CD44v3 in normal oesophagus, Barrett mucosa and oesophageal carcinoma. J Clin Pathol 49:489–492
34. Lagorce-Pages C, Paraf F et al (1998) Expression of CD44 in premalignant and malignant Barrett’s oesophagus. Histopathology 32:7–14
35. Menges M, Goebel R, Pueschel W et al (2002) Expression of CD44v5 and -v6 in Barrett’s carcinoma is not increased compared to that in nondysplastic Barrett’s mucosa. Exp Mol Pathol 72:207–212 36. Niehrs C (2006) Function and biological roles of the Dickkopf
family of Wnt modulators. Oncogene 25:7469–7481
37. Sato H, Suzuki H, Toyota M et al (2007) Frequent epigenetic inactivation of DICKKOPF family genes in human gastrointestinal tumors. Carcinogenesis 28:2459–2466
38. Aguilera O, Fraga MF, Ballestar E et al (2006) Epigenetic inactivation of the Wnt antagonist DICKKOPF-1 (DKK-1) gene in human colorectal cancer. Oncogene 25:4116–4121
39. Ali I, Rafiee P, Hogan WJ et al (2006) Dickkopf homologs in squamous mucosa of esophagitis patients are overexpressed compared with Barrett’s patients and healthy controls. Am J Gastroenterol 101:1437–1448
40. Van Baal JW, Bozikas A, Pronk R et al (2008) Cytokeratin and CDX-2 expression in Barrett’s esophagus. Scand J Gastroenterol 43:132–140
41. Wegner M (1999) From head to toes: the multiple facets of Sox proteins. Nucleic Acids Res 27:1409–1420
42. Blache P, van de Wetering M, Duluc I et al (2004) SOX9 is an intestine crypt transcription factor, is regulated by the Wnt pathway, and represses the CDX2 and MUC2 genes. J Cell Biol 166:37–47
43. Ferguson HR, Wild CP, Anderson LA et al (2008) Cyclooxygenase-2 and inducible nitric oxide synthase gene polymorphisms and risk of reflux esophagitis, Barrett’s esophagus, and esophageal adenocarcinoma. Cancer Epidemiol Biomarkers Prev 17:727–731
44. Feith M, Stein HJ, Mueller J et al (2004) Malignant degeneration of Barrett’s esophagus: the role of the Ki-67 proliferation fraction, expression of E-cadherin and p53. Dis Esophagus 17:322–327 45. Wijnhoven BP, Nollet F, De Both NJ et al (2000) Genetic
alterations involving exon 3 of the beta-catenin gene do not play a role in adenocarcinomas of the esophagus. Int J Cancer 86:533– 537
46. Williams LJ, Guernsey DL, Casson AG (2006) Biomarkers in the molecular pathogenesis of esophageal (Barrett) adenocarcinoma. Curr Oncol 13:33–43