ORIGINAL PAPER
Simultaneous sampling of volatile and non-volatile analytes
in beer for fast fingerprinting by extractive electrospray
ionization mass spectrometry
Liang Zhu&Zhong Hu&Gerardo Gamez&Wai Siang Law&HuanWen Chen&
ShuiPing Yang&Konstantin Chingin&Roman M. Balabin&Rui Wang&
TingTing Zhang&Renato Zenobi
Received: 6 April 2010 / Revised: 4 June 2010 / Accepted: 20 June 2010 / Published online: 20 July 2010 # Springer-Verlag 2010
Abstract By gently bubbling nitrogen gas through beer, an effervescent beverage, both volatile and non-volatile com-pounds can be simultaneously sampled in the form of aerosol. This allows for fast (within seconds) fingerprinting by extractive electrospray ionization mass spectrometry (EESI-MS) in both negative and positive ion mode, without the need for any sample pre-treatment such as degassing and dilution. Trace analytes such as volatile esters (e.g., ethyl acetate and isoamyl acetate), free fatty acids (e.g., caproic acid, caprylic acid, and capric acid), semi/non-volatile organic/inorganic acids (e.g., lactic acid), and various amino acids, commonly present in beer at the low parts per million or at sub-ppm levels, were detected and identified based on tandem MS data. Furthermore, the appearance of solvent cluster ions in the mass spectra gives insight into the sampling and ionization mechanisms:
aerosol droplets containing semi/non-volatile substances are thought to be generated via bubble bursting at the surface of the liquid; these neutral aerosol droplets then collide with the charged primary electrospray ionization droplets, followed by analyte extraction, desolvation, ionization, and MS detection. With principal component analysis, several beer samples were successfully differenti-ated. Therefore, the present study successfully extends the applicability of EESI-MS to the direct analysis of complex liquid samples with high gas content.
Keywords Extractive electrospray ionization . Beer analysis . EESI mechanism
Introduction
Beer, an effervescent beverage, is the world's oldest and most widely consumed alcoholic beverage and the third most popular drink overall after water and tea (http://en. wikipedia.org/wiki/Beer). Beer, produced from various raw materials, is an extremely complex mixture of more than 800 chemical compounds, widely varying depending on the production procedures and environment. Many of the organic contents in beer not only contribute to its flavor characteristics and nutrition but also are critical for evaluating beer quality. For examples, volatile esters and free fatty acids are common trace compounds in beer but are extremely important for its flavor profile: they are desirable at low concentrations but undesirable at high concentrations [1]. The presence of free amino acids in beer contributes to the fullness and nutritional value of beer [2]. Specific amino acids may serve as indicators for adultera-tion and transformaadultera-tion occurring during processing and
Electronic supplementary material The online version of this article (doi:10.1007/s00216-010-3945-8) contains supplementary material, which is available to authorized users.
L. Zhu
:
G. Gamez:
W. S. Law:
K. Chingin:
R. M. Balabin:
R. Wang:
R. Zenobi (*)Department of Chemistry and Applied Biosciences, ETH Zurich, 8093 Zurich, Switzerland
e-mail: [email protected] Z. Hu
:
H. Chen (*):
S. Yang:
T. Zhang Applied Chemistry Department, East China Institute of Technology, Fuzhou, Jiangxi 344000, China e-mail: [email protected] Present Address:G. Gamez
Laboratory for Mechanics of Materials and Nanostructures, EMPA,
3603 Thun, Switzerland DOI 10.1007/s00216-010-3945-8
storage [3]. Furthermore, the pH value and taste of beer are greatly influenced by its organic/inorganic acid content [4]. Until now, there is no full understanding of the various processes involved in brewing beer, despite extensive research efforts and developments of advanced analytical methods. Thus, beer analysis has become an important practical need in terms of organoleptic characteristics, quality, nutrition, and food safety, but still challenges modern analytical techniques in many aspects, such as throughput, sensitivity, and selectivity, due to the complex composition of beer. For example, because of the require-ment for degassing before analyzing beer, important volatile flavor-contributing substances might get depleted. Thus, simultaneous characterization and evaluation of volatile esters, free fatty acids, as well as non-volatile amino acids, and organic/inorganic acids in beer are critical to acquire comprehensive chemical information, not only to assess the nutritional levels but also for on-site quality control during beer brewing and for quality assessment of commercial beer products.
Traditionally, chemical analysis of liquids with a high gas content, such as beer, is performed by high performance liquid chromatography (HPLC) [5–7]. Chemical derivati-zation of amino acids that lack intrinsic UV absorption and fluorescence properties has to be done to allow their detection by HPLC-UV [8]. Capillary electrophoresis after chemical derivatization is a possible alternative to HPLC [9–11]. Additionally, the combination of HPLC and tandem mass spectrometry (MS) has been developed to analyze some specific compounds in beer samples [12, 13]. Inductively coupled plasma atomic emission spectroscopy has been used to directly determine trace amounts of metal ions in beer, after removing CO2from the sample [14,15]. The requirements for derivatization and degassing are normally laborious and time-consuming.
MS is known for providing molecular information with high sensitivity and selectivity, and has been utilized widely for characterization of alcoholic beverages [16, 17]. For example, electrospray ionization (ESI)-MS has been exten-sively utilized for characterization of beer [18,19] and sake [20], and for authentication of whisky [21], using direct infusion of suitably prepared samples. Furthermore, the extremely high mass resolution provided by Fourier-transform (FT)-MS gives high confidence when identifying compounds in complex sample matrices [22]. Matrix-assisted laser desorption/ionization, another soft ionization technique, has been used to qualitatively and quantitatively detect α-dicarbonyl compounds in beer samples using 9-(3,4-diaminophenyl)acridine as a reactive matrix [23]. Overall, however, the desire to circumvent sample pre-treatment steps (such as degassing, dilution, and pH adjustment) required by the above-mentioned techniques calls for alternative MS methods suitable for high
through-put analysis and specific identification of chemical species in beer. For instance, even a simple degassing step using an ultrasonic bath would take at least 10 min, which compromises high throughput capabilities and might cause problems due to degradation of analytes caused by high internal temperatures due to the sonication process [24]. The traditional inert gas substitution method takes about 1 h. Thus, techniques capable of analyzing beer without any sample pre-treatment such as degassing, allowing simulta-neous acquisition of molecular information of both volatile and non-volatile compounds, are needed.
The newly developed ambient mass spectrometric techniques, such as desorption ESI [25–28], desorption atmospheric pressure chemical ionization [29–31], direct analysis in real time [32–35], electrospray-assisted laser desorption/ionization [36,37], atmospheric pressure solids analysis probe [38,39], easy ambient sonic-spray ionization [40,41], atmospheric pressure glow discharge [42–44], and low-temperature plasma probe [45–47], have been widely utilized for fast detection of analytes on solid surfaces, normally with minimal sample pre-treatment. Liquid sam-ples, on the other hand, sometimes require sample preparation before they can be analyzed with the above-mentioned techniques. Recently, extractive electrospray ionization (EESI)-MS has been demonstrated to allow the direct and rapid detection of both volatile and non-volatile analytes in the gas phase, in solution, or in aerosol samples, without any sample pre-treatment [48–56]. With the aid of neutral desorption [51, 57–61], analytes such as metabo-lites, active drug components, explosives, and chemical pollutants can be liberated from virtually any type of surface or liquid for subsequent EESI analysis.
In this study, we report the fast analysis of beer, by coupling a simple and gentle sampling method with EESI-MS, which eliminates the need for sample preparation, such as degassing. By introducing a gentle gas flow into beer, aerosol droplets are generated via bubble bursting and then sampled for subsequent EESI-MS analysis. Volatile esters, free fatty acids, non-volatile amino acids, and organic/ inorganic acid signals were simultaneously detected and identified based on their MS/MS data. Additionally, different beer samples can also be discriminated using principle component analysis.
Experimental section
By introducing a pulsed nitrogen gas flow (the gas flow at 50 L/h was on for ~45–50 s and off for a half-minute interval) through one neck of a 100-mL three-neck flask with the middle neck capped, the aerosol droplets emerging from gas bubbles bursting at the surface of the bulk liquid were sampled at regular intervals through the third neck (as
shown in Fig. 1). Aerosols generated in this fashion were transported through a 30-cm long piece of Teflon tubing (6 mm, i.d.) which was heated to 80 °C. By taking into account the dead volume of the transport line and the flow rate of the N2 gas, it can be deduced that the aerosol droplets can be intercepted by the charging electrospray within 1 s. In positive ion mode, the measurements were performed on a quadrupole time-of-flight (Q-TOF) mass spectrometer (Q-TOF UltimaTM, Micromass Waters, Man-chester, UK) with the ESI voltage set to +3.6 kV and the cone voltage to 40 V. A solvent mixture (methanol/water/ acetic acid 40%/40%/20%) was electrosprayed at a flow rate of 5 μL/min infused with a syringe pump (Harvard Apparatus, Holiston, MA, USA).
A linear ion trap mass spectrometer (LTQ-XL, Finnigan, San Jose, CA, USA) was utilized for measurements and analyte identification in negative ion mode. The ESI solvent in this case was a mixture of methanol and water (1:1), infused with a flow rate of 5μL/min. The ESI voltage was −3.5 kV, and the temperature of the introduction capillary was 180 °C. The spectra were continuously recorded and integrated for 30 s while the carrier gas was on, followed by background subtraction. The mass spectra were recorded over the m/z 50– 500 range, which covers most of the interesting chemical composition in beer. Collision-induced dissociation was performed with 10–25 units of collision energy. The raw mass spectra were exported manually as .txt files and then imported into the Matlab software (MathWorks, Inc., Natick, MA, USA) for principal component analysis (PCA) evaluation.
All chemical reagents, such as methanol and acetic acid, were bought with the highest purity available for direct use without any further purification. Deionized water was available from an ultrapure water system (Barnstead Nano-pure Diamond, analytic D11901, Basel, Switzerland). The
beer samples were purchased from local supermarkets. For PCA evaluations, we used two individual samples of the same brand and from the same batch for each type of beer (pale Pilsner, wheat/white beer, and lager).
Results and discussions
The concept of bubble extraction (bubble fractionation) has been used for extracting dissolved gases (such as methane) in water samples [62] and for on-site enrichment of surface-active inorganic compounds and proteins on the solution surface [63, 64]. In the current study, dissolved analytes were directly sampled from beer for mass spectrometric analysis based on bubble extraction. However, rather than using this process for pre-concentration, aerosol droplets containing semi/non-volatile compounds were sampled in real time and then guided by the carrier gas into the EESI ionization interface for direct analysis. This combination renders the presented technique quite useful, allowing fast mass spectrometric characterization of liquid samples even with high gas content.
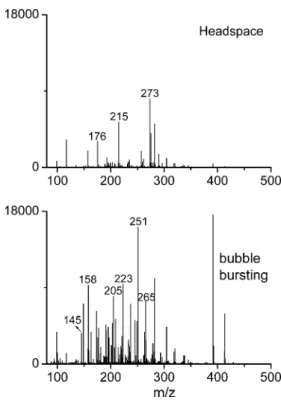
Aerosolization via bubble bursting vs headspace measurements To demonstrate the advantage and necessity of sampling via bubble bursting over headspace measurements [52], mass spectra of a fresh beer sample in the flask were measured with the same gas flow using these two sampling modes, in positive ion mode (Fig. 2). It can be clearly observed that the absolute intensities of most peaks were greatly elevated with bubble bursting sampling, especially those below m/z 300. This can probably be attributed to the extraction [62] of dissolved volatile analytes during bubble bursting. In addition, various peaks (such as glucose, m/z 181) were only present in the mass spectrum recorded via bubble bursting. The reason for this is the greater sampling efficiency of semi/non-volatile analytes in the form of aerosols through bubble bursting, as discussed below in the sampling mechanism section. The above-mentioned results clearly indicate that the use of sampling via bubble bursting is an essential and necessary improvement, thus allowing a more comprehensive chem-ical analysis of beer. The chemchem-ical identification of major peaks and characteristic substances is described below and in Table1.
Performance optimization for EESI To render the measure-ments more repeatable, the beer samples (volume of 50 mL) were poured into the flask carefully to prevent thick foam from covering the liquid surface. A layer of foam would reduce the possibility of formation of aerosol droplets of larger diameter [65], but it is not easy to control the thickness of the foam layer each time when pouring
Fig. 1 Schematic illustration of the concept of sampling via bubble bursting combined with extractive electrospray ionization mass spectrometry setup
beer into the flask, and great care needs to be taken when carrying out this step.
The flow rate of the desorption gas introduced into the liquid is a critical parameter for optimizing performance. A low flow rate gives very weak signals, while a high gas flow (>80 L/h) would“boil” the liquid and fill the transport line full with foam. Also, a higher flow rate reduces the ionization efficiency, due to a shorter residence time of the desorbed neutral aerosol droplets inside the primary ionizing ESI plume. The optimum flow rate chosen in this study was as high as possible, almost at the critical point where a stable thin foam layer on the liquid surface would form while the gas is on. The flow rate chosen (50 L/h) was the same for every measurement. It is noteworthy that the optimum flow rate depends on the inner diameter of the tube introducing the gas into the liquid. In this study, this tube had an inner diameter of 5 mm.
The abundances of specific ions were almost the same for five consecutive measurements in ~6 min, demonstrat-ing the repeatability of our technique. A good repeatability suggests the absence of possible carry-over effects during measurements. Furthermore, in order to prevent carry-over effects as much as possible, clean flasks were taken for individual beer samples. Single ion monitoring of amino acid ion signals showed that their peak intensities dropped to the baseline level within 1 s after the gas flow was turned off (see Fig. S1 in Electronic Supplementary Material).
Table 1 Chemical identification of peaks in the extractive electrospray ionization mass spectra of beer samples in both negative and positive ion mode m/z Products ions (m/z) Neutral losses in MS/MS Chemical identification 89 (−) 43, 45, 71 HCOOH, CO2, H2O [lactic acid–H]−
97 (−) 79 H2O [phosphoric acid–H]−
119 (−) 59, 75 CH3COOH, CO2 [2acetic acid–H]−
115 (−) 71 CO2 [caproic acid–H]−
143 (−) 99, 85, 71 CO2, [CO2, CH2], [CO2, C2H4] [caprylic acid–H]−
171 (−) 127, 143 CO2, C2H4 [capric acid–H]−
203 (−) 159, 157, 175 CO2, HCOOH, CO a deprotonated carboxylic acida
132 (−) 115, 114, 88, 86 NH3, H2O, CO2, HCOOH [aspartic acid–H]−
104 (−) 74, 60 CH2O, CO2 [serine–H]−
114 (−) 86, 96, 70, 68 CO, H2O, CO2, HCOOH [proline–H]−
88 (−) 60, 44, 42 CO, CO2, HCOOH [alanine–H]−
118 (−) 74, 100, 90 CH3CHO, H2O, CO [threonine–H]−
89 (+) 61 C2H4 [ethyl acetate+H]+
131 (+) 71 CH3COOH [isoamyl acetate+H]+
181 (+) 145, 164, 149 2H2O, H2O, CH4O [glucose+H]+
191 (+) 145, 99 C2H5OH, [C2H5OH, C2H5OH] [99+2ethanol]+
205 (+) 159, 99 C2H5OH, [C2H5OH, CH3COOH] [99+ethanol+acetic acid]+
251 (+) 205, 159, 99 C2H5OH, [C2H5OH, C2H5OH], [C2H5OH, C2H5OH, CH3COOH] [99+2ethanol+acetic acid]+
265 (+) 219, 159, 99 C2H5OH, [C2H5OH, CH3COOH], [C2H5OH, 2CH3COOH [99+ethanol+2acetic acid]+ aNot tryptophan, since there was no characteristic loss of NH
3in the MS/MS spectrum of the ion at m/z 203
Fig. 2 Positive ion mode extractive electrospray ionization mass spectra of a fresh beer sample recorded with both headspace sampling and sampling via bubble bursting, using the same instrumental parameters
However, gradual signal loss is an issue, especially for volatile compounds, when beer samples had been contin-uously sampled via bubbling for more than half an hour. The extraction of volatile analytes to the headspace after a long sampling period is definitely one major factor. Furthermore, gradually eliminating the inherent efferves-cence (CO2) of beer samples could be another reason for signal decay (as described in the sampling mechanisms section below). The loss of inherent effervescence, which stems from CO2 produced from the carbonic acid, will change the pH value of the beer sample. Thus, beer from a freshly opened bottle was deemed the best choice for measurements. It was shown that several measurements done within a few minutes after opening the beer bottles were repeatable and well representative for the bulk solution samples. In fact, sampling via bubble bursting for a relatively long time is similar to the traditional degassing procedure, such as the inert gas substitution method (normally using helium or nitrogen). In other words, like in traditional degassing, some important flavor-contributing volatile analytes would be lost. In contrast, direct sampling of the fresh beer and simultaneously analyzing both volatile and non-volatile compounds are feasible using the bubbling EESI method.
Fast fingerprinting of beer samples using EESI-MS combined with sampling via bubble bursting Beer contains a complex mixture of inorganic and organic acids (e.g., acetic acid, lactic acid, and fatty acids) with different volatility. Monitoring the levels of these acids, and thereby controlling the pH value during beer brewing, is important for the quality of the final product and for its stability and taste. To characterize these acids with high sensitivity, sampling via bubble bursting followed by EESI was performed in front of an LTQ-XL mass spectrometer operated in negative ion mode. Figure3a shows an EESI (−) mass spectrum of a fresh lager beer. It exhibits strong signals at m/z 59 and 119, which can be identified as the deprotonated monomer and dimer of acetic acid, respec-tively. Note that there was no acetic acid in the ESI spray solvents during negative ion mode experiments. The ions at m/z 87 and 89 can be identified as deprotonated butyric acid and lactic acid, respectively. Indeed, acetic acid and lactic acid are representative organic acids produced during beer brewing. Furthermore, the determination of free fatty acids with medium chain length, including caproic acid, caprylic acid, capric acid, and lauric acid in beer, is useful for monitoring the progress of maturation [66]. Since their concentration in beer is fairly low and these fatty acids are normally unstable, esterification is usually preformed before samples are subjected to gas chromatography measurements. However, using bubbling EESI-MS, caproic acid, caprylic acid, capric acid, and lauric acid can be
detected directly and distinctly as deprotonated molecules at m/z 115, 143, 171, and 199, respectively (Fig.3a). This underscores the gentle yet efficient nature of the neutral sampling and of the EESI ionization processes. When zooming into the mass spectra, more peaks can be discerned; however, for practical reasons, only identifica-tion of abundant peaks and some interesting compounds (such as amino acids, as shown below) was performed.
To demonstrate the universality of our method with different MS instruments, the EESI ionization source was subsequently coupled to a Q-TOF mass spectrometer for positive ion mode measurements. As shown in one typical measurement (Fig. 3b), various protonated molecules appeared, distributed between m/z 50 to 500. Some volatile esters contribute heavily to the overall beer flavor. Two major representative esters in beer, ethyl acetate (MW 88 Da) and isoamyl acetate (MW 130 Da), can be directly detected at m/z 89 and 131 in the mass spectrum using bubbling EESI-MS (Fig. 3b). White/wheat beer is famous for its fruity aroma, which is reflected in a high content of esters, and a much stronger intensity of both m/z 89 and 131 in the EESI mass spectrum (comparison with other two types of beer shown in Fig. S2inElectronic Supplementary Material). Moreover, considering the complex nature of beer, specific ions at certain m/z could be assigned to be a mixture of compounds with very close composition. For example, the ion at m/z 145 could be a sum of caprylic acid, ethyl hexanoate, and ethyl 4-methylpentanoate, while m/z 173 corresponds to a mixture of capric acid, ethyl
Fig. 3 Mass spectral fingerprints of fresh beer samples using sampling via bubble bursting extractive electrospray ionization mass spectrometry in both negative (a) and positive (b) ion mode
octanoate, and octyl acetate [67]. Due to their important influence on beer flavor, monitoring the content of various volatile esters during the brewing procedures is a major criterion. It is demonstrated here this is easily done by EESI-MS presented herein.
Furthermore, based on their MS/MS spectra (Fig.4and Table1), m/z 191, 205, 223, 251, 265, and 391 shown in Fig. 3a can be assigned to protonated clusters of ethanol (MW 46 Da), acetic acid (MW 60 Da), methanol (MW 32 Da), and water (MW 18 Da) based on the same nucleus (m/z 99). The peak at m/z 99 in the positive mode spectrum probably correlates with the peak at m/z 97 in Fig.3b. It was tentatively assigned to be phosphoric acid (H3PO4, MW 98 Da), which is rationalized because of the generation of inorganic phosphates at high concentration during beer brewing. Also, the three hydroxyl moieties in phosphoric acid are the likely sites for the attachment of other solvent molecules to form big clusters via hydrogen bonding. The above-mentioned ions started to dissociate at very low collision energies (<10 arbitrary units), indicating the non-covalent nature of these clusters. Taking the fragment pattern of the ions at m/z 223 as an example, this parent ion generated three major fragment ions, which correspond to a neutral loss of H2O (18), CH3OH (32), and C2H5OH (46), respectively (Fig. 4). Other fragments are generated via different sequences of losses of the above three molecules. Although it is known that protonated solvent clusters can be dissociated by adjusting experimen-tal parameters such as the cone voltage, the temperature of the transport line, and the collision energies, their presence was desired in the current study to provide information on the sampling/ionization mechanism and also for discrimi-nating different beer types, as discussed below. Note that there are few solvent cluster ions present in the negative mode mass spectra, presumably due to the higher temper-ature (180 °C) of the ion introduction capillary of the LTQ instrument.
Identification of amino acids in negative ion mode The detection of free amino acids in beer is of great importance in terms of food quality and safety. Since most amino acids
are easily deprotonated, the following measurements were performed in negative ion mode. Signals of interest detected from beer samples can be assigned using the MSn capabilities of the LTQ mass spectrometer. As a demonstration, the dominating fragment generated from the ion at m/z 180 (tentatively assigned as [Tyr–H]−, MW 181 Da) is the one at m/z 163, corresponding to the loss of molecular ammonia (rather than a hydroxyl radical loss, see Fig. S3). Decarboxylation of the ions of the m/z 163 in a consecutive fragmentation process yields the deprotonated styrene at m/z 119, which undergoes a further loss of acetylene to generate m/z 93 [68]. The consecutive losses of NH3and CO2were also found in the MS/MS spectra of the ions at m/z 154 (tentatively assigned to [His–H]−, MW of His=155 Da) and m/z 164 (tentatively assigned to [Phe– H]−, MW of Phe=165 Da). Furthermore, as shown in Fig. S3, both deprotonated tyrosine and phenylalanine mole-cules generated a fragment ion at m/z 72, which can be rationalized in terms of an elimination mechanism driven by abstraction of a proton from the amine by the carboxylate anion [68]. All these results lead to a confident identification of m/z 180, 154, and m/z 164 as deprotonated tyrosine, histidine, and phenylalanine, respectively. Identi-fication of more amino acids from beer can be found in the
Electronic Supplementary Material.
The successful direct detection and identification of various amino acids from beer, combined with the fact that most amino acids are non-volatile, render bubbling EESI-MS a potentially useful analytical tool for the purpose of rapid quality monitoring of beer in breweries. As show in Table 2, histidine is only present in some of beers, which may depend on individual brewing techni-ques [11]. Histidine is known to be a possible precursor for histamine, which could generate symptoms of intoxi-cation, underscoring the importance of knowing the presence of histidine in beer products. Furthermore, specific amino acids (such as aspartic acid) may serve as an indication for adulteration or transformation occurring during processing and storage. In this study, at least ten amino acids could be quickly detected in beer samples, as shown in Table2.
Fig. 4 MS/MS spectra of the ions at m/z 223 and 251 from a measurement of a fresh lager beer sample, in positive ion mode. Collision-induced disso-ciation happened already at low collision energies
Possible mechanisms of sampling and EESI ionization A stream of inert gas was introduced into the beer, which induces bubbling under the surface of the liquid. Due to the pressure difference, the bubbles eventually burst at the bulk liquid/air interface, generating aerosol droplets via rupture of the bubble skin and formation of a jet of liquid bubbles [65, 69], in addition to direct extraction of dissolved volatile substances from the solution. The size of the resulting aerosol droplets can vary from sub-micrometer to many micrometers, depending on the underlying mecha-nisms and conditions [65,69]. The aerosol droplets, which contain both volatile and non-volatile analytes from the bulk solution, are then carried by the gas flow to the EESI ionization source for further analysis. Our working hypoth-esis for the EESI ionization mechanism is that neutral aerosol droplets first collide with the charged primary droplets in the ESI plume, and analytes are then extracted into the charged ESI droplets. These undergo further desolvation steps, finally yielding gaseous ions in a normal ESI process.
The successful detection of non-volatile analytes, such as amino acids, lactic acid, and glucose in beer samples is consistent with the proposed mechanism. Moreover, the observation of the solvent cluster ions (Fig.4) supports the notion that aerosol droplets are generated via a bubble bursting process. Such solvent cluster ions were not observed in the mass spectra obtained when electro-spraying pure ESI solvent but are uniquely present in the bubbling EESI spectra of beer samples. Furthermore, measurement of some of the beer samples using ultrasound-assisted nebulization for EESI [53] did not generate such cluster ions. Aerosol droplets formed by bubble bursting in beer samples may be so large [65, 69] that solvent desolvation is incomplete, thus giving a high population of solvent clusters; in contrast, ultrasonic nebulization of beer is believed to be much more efficient in generating very small droplets or even free molecules.
The presence of protonated clusters (m/z 223) com-posed of solvents from both the ESI spray (e.g., methanol) and from the beer sample (e.g., ethanol) experimentally confirms for the first time that droplet–droplet collisions must have occurred before ionization (Fig.4). It would be much less likely to form such solvent cluster ions via
collisions of molecules in the gas phase. In other studies, multiply charged ions of peptides and proteins were clearly observed after these were desorbed in neutral form either with an ultrasonic transducer [53] or an RF source [70], and then post-ionized with a primary ESI plume. The formation of multiply charged macromolecular ions is known to follow the so-called “charged residue model” [71], i.e., it is unlikely to form these multiply charged macromolecular ions only from interaction of gaseous peptide/protein molecules and gas-phase ions from the charging spray. The extent of the droplet–droplet colli-sions, however, is still unclear and needs to be investigated further. It is also known that some volatile compounds are extracted in gaseous form from the solution. Gaseous analytes can be ionized via direct interaction with charged species in the ESI plume, but it is even imaginable that gaseous sample molecules are first extracted into a charged ESI droplet.
Discriminating beers using PCA Although intensity pat-terns of major MS peaks can be utilized to discriminate different types of beers (pale Pilsner, wheat/white beer, and lager), chemometric analysis is a more professional way of displaying the data. As discussed previously, a number of solvent cluster ions dominate in the mass spectra acquired the positive ion mode using current setup. In order to acquire PCA analysis mainly based on the chemical differences arising from the inherent organic compounds, major representative peak of solvents clusters (such as m/z 191, 205, 223, 251, 265, and 391) was manually removed from the mass spectra before PCA evaluation. After processing, two principal components (PC) were extracted from the PCA data. The 2D graph of the PCA scores confirmed the successful separation of beer types in the direction of principal components 1 (51.1%) and 2 (34.6%), as shown in red symbols in Fig. 5. All samples (two individual samples for each type of beer) correctly fell into three groups according to their types, also demonstrating the repeatability of measurements. None of the groups over-lapped along the PC1 axis. Analysis of loading plots allows choosing the variables that are most useful for sample classification. By reviewing the analysis of corresponding loading plots, it is m/z 158, 173, 145, 135, and 89, mainly
Table 2 Screening of the presence of various free amino acids in three types of beer
Ser Thr Pro Asp Cys Asn Phe Tyr His Ala Trp
Beer 1 √ √ × √ × √ √ √ × √ ×
Beer 2 √ √ √ √ √ √ √ √ √ × ×
Beer 3 √ √ √ √ √ √ √ √ √ × ×
Ser serine; Thr threonine; Pro proline; Asp aspartic acid; Cys cysteine; Asn asparagine; Phe phenylalanine; Tyr tyrosine; His histidine; Ala alanine; Trp tryptophan
volatile substances, which now contributed heavily to the differentiation of beer samples. The above results demon-strate the successful discrimination of beer types based on their chemical differences upon PCA analysis.
After performing PCA evaluation of raw mass spectra (with cluster ion peaks), much better discrimination of beer types was achieved (see black symbols in Fig. 5). In the loadings of PC1, the peaks at m/z 251 and 391 (assigned to be cluster of solvents) had the maximum intensity, i.e., they contributed most to PC1. The different intensities of these cluster ions may be due to the different mean diameters of the aerosol droplets generated during bubble bursting. As bubbles rise in beer, they gather a coating of complex, surface-active organic compounds. The nature of these compounds reflects the strength and longevity of beer foam. For example, the concentration of high molecular weight hydrophobic proteins [72], isohumulone, glycerol [73], fatty acids [66], and other constituents [74] tend to influence the viscosity of the beer itself, and probably affect the size of aerosol droplets in the bubble bursting process. Thus, the higher intensity of the peaks at m/z 251 and 391 in the mass spectra (see Fig. S2) of pale Pilsner correlates with the fact that with Pilsner beers one expects a very stable, copious foam due to its high viscosity, and probably a larger size of the aerosol droplets formed via the bubble bursting processes. The above-mentioned data suggest that using the simple analytical technique introduced here, information not only on the chemical properties but also on certain physical properties of beer can be acquired
indirectly, which can be used for additional discrimination between beer samples.
PCA evaluation of beer measurements under negative ion mode is not performed since it is clear that the beer can be already differentiated by screening common amino acids in beer products, as shown in Table2.
Conclusions
In this article, the application of EESI-MS was successfully extended to the fast analysis of beer, one representative effervescent beverage, combined with a simple sampling via bubble bursting method. Besides bubble extraction of volatile substances into headspace, semi/non-volatile com-pounds were directly sampled via aerosolization for subse-quent analysis. Mass spectral fingerprints for different beer samples were obtained within 1 s via aerosols released from the samples, in either positive or negative ion mode, without any sample pretreatments. Different beer types can be well discriminated based on EESI-MS data, coupled with PCA. The presence of clusters composed of ESI solvents and beer components suggests that collisions between ESI primary droplets and aerosol droplets generated via bubble bursting actually take place, giving more insight into the EESI ionization mechanism. Various organic acids, as well as non-volatile amino acids that are commonly present at low parts per million levels in beer, were successfully detected and identified with tandem MS. Monitoring the level of such analytes could improve the brewing processes.
This new method has many practical advantages, such as a simple setup, no need for sample preparations, a gentle nature of sampling and ionization, high sensitivity and specificity, and the ability to monitor beer in a flask or even at the production site. Both volatile and semi/non-volatile compounds responsible for product flavor, nutrition, and safety can be detected under ambient conditions. In short, sampling via bubble bursting combined with EESI-MS is an easy, sensitive analytical tool to perform real-time, on-line monitoring of beer in breweries.
Acknowledgements Renato Zenobi and HuanWen Chen acknowl-edge financial support from the Sino-Swiss Science and Technology Cooperation (project no. IZL CZ2_123987).
References
1. Verstrepen KJ, Derdelinckx G, Dufour JP, Winderickx J, Thevelein JM, Pretorius IS, Delvaux FR (2003) J Biosci Bioeng 96:110–118 2. Nagao Y, Kodama H, Yamaguchi T, Yonezawa T, Taguchi A,
Fujino S, Morimoto K, Fushiki T (1999) Biosci Biotechnol Biochem 63:468–473
3. Basarova G, Janousek J (2000) Kvasny Prumysl 46:314–318 Fig. 5 Score plot of principal component analysis of the mass spectra
obtained from three beer types in positive ion mode (circles, pale Pilsner; diamonds, white/wheat beer; inverted triangles, lager). The two colors of each symbol represent principal component analysis analyses without (red symbols) and with (black symbols) the solvent cluster peaks. Open and closed symbols stand for two individual samples of the same brand taken for each type of beer
4. De Stefano A, Montanari L (1996) Alcologia 8:43–45 5. Dewaele C, Verzele M (1980) J Chromatogr 197:189–197 6. Degelmann P, Becker M, Herderich M, Humpf HU (1999)
Chromatographia 49:543–546
7. Kutlan D, Molnar-Perl I (2002) Elsevier Science Bv, Montreal, Canada, pp 311–322
8. Toriba A, Adzuma K, Santa T, Imai K (2000) Anal Chem 72:732–739 9. Cortacero-Ramirez S, de Castro MHB, Segura-Carretero A, Cruces-Blanco C, Fernandez-Gutierrez A (2003) TrAC, Trends Anal Chem 22:440–455
10. Engstrom A, Andersson PE, Josefsson B, Pfeffer WD (1995) Anal Chem 67:3018–3022
11. Klampfl CWJ (1999) Agric Food Chem 47:987–990
12. Stevens JF, Taylor AW, Deinzer ML (1999) J Chromatogr A 832:97–107
13. Rong H, Zhao Y, Lazou K, De Keukeleire D, Milligan SR, Sandra P (2000) Chromatographia 51:545–552
14. Alcazar A, Pablos F, Martin MJ, Gonzalez AG (2002) Talanta 57:45–52
15. Asfaw A, Wibetoe G (2005) Microchim Acta 152:61–68 16. Flamini R, Panighel A (2006) Mass Spectrom Rev 25:741–774 17. Flamini R (2003) Mass Spectrom Rev 22:218–250
18. Araujo AS, da Rocha LL, Tomazela DM, Sawaya A, Almeida RR, Catharino RR, Eberlin MN (2005) Analyst 130:884–889 19. Mauri P, Minoggio M, Simonetti P, Gardana C, Pietta P (2002)
Rapid Commun Mass Spectrom 16:743–748
20. Moriwaki H, Hagiwara A, Takasaki M, Izumi F, Watanabe A, Shimizu R, Kuribayashi N, Totani Y, Suzuki Y (2010) Anal Sci 26:379–382
21. Moller JKS, Catharino RR, Eberlin MN (2005) Analyst 130:890–897 22. Cooper HJ, Marshall AG (2001) J Agric Food Chem 49:5710–5718 23. Mugo SM, Bottaro CS (2008) Rapid Commun Mass Spectrom
22:1087–1093
24. Suslick KS (1990) Science 247:1439–1445
25. Takats Z, Wiseman JM, Gologan B, Cooks RG (2004) Science 306:471–473
26. Chen HW, Talaty NN, Takats Z, Cooks RG (2005) Anal Chem 77:6915–6927
27. Venter A, Nefliu M, Cooks RG (2008) Trac-Trend Anal Chem 27:284–290
28. Ifa DR, Jackson AU, Paglia G, Cooks RG (2009) Anal Bioanal Chem 394:1995–2008
29. Yang SP, Ding JH, Zheng J, Hu B, Li JQ, Chen HW, Zhou ZQ, Qiao XL (2009) Anal Chem 81:2426–2436
30. Chen HW, Zheng J, Zhang X, Luo MB, Wang ZC, Qiao XL (2007) J Mass Spectrom 42:1045–1056
31. Chen HW, Liang HZ, Ding JH, Lai JH, Huan YF, Qiao XL (2007) J Agric Food Chem 55:10093–10100
32. Cody RB, Laramee JA, Durst HD (2005) Anal Chem 77:2297–2302 33. Williams JP, Patel VJ, Holland R, Scrivens JH (2006) Rapid
Commun Mass Spectrom 20:1447–1456
34. Moffat AC, Cody RB, Jee RD, O'Neil AJ (2007) J Pharm Pharmacol 59:A26–A26
35. Kpegba K, Spadaro T, Cody RB, Nesnas N, Olson JA (2007) Anal Chem 79:5479–5483
36. Shiea J, Huang MZ, Hsu HJ, Lee CY, Yuan CH, Beech I, Sunner J (2005) Rapid Commun Mass Spectrom 19:3701–3704
37. Cheng CY, Yuan CH, Cheng SC, Huang MZ, Chang HC, Cheng TL, Yeh CS, Shiea J (2008) Anal Chem 80:7699–7705
38. McEwen C, Gutteridge S (2007) J Am Soc Mass Spectrom 18:1274–1278
39. McEwen CN, McKay RG, Larsen BS (2005) Anal Chem 77:7826–7831
40. Eberlin LS, Abdelnur PV, Passero A, de Sa GF, Daroda RJ, de Souza V, Eberlin MN (2009) Analyst 134:1652–1657
41. Haddad R, Sparrapan R, Kotiaho T, Eberlin MN (2008) Anal Chem 80:898–903
42. Jecklin MC, Gamez G, Touboul D, Zenobi R (2008) Rapid Commun Mass Spectrom 22:2791–2798
43. Andrade FJ, Shelley JT, Wetzel WC, Webb MR, Gamez G, Ray SJ, Hieftje GM (2008) Anal Chem 80:2646–2653
44. Andrade FJ, Shelley JT, Wetzel WC, Webb MR, Gamez G, Ray SJ, Hieftje GM (2008) Anal Chem 80:2654–2663
45. Harper JD, Charipar NA, Mulligan CC, Zhang XR, Cooks RG, Ouyang Z (2008) Anal Chem 80:9097–9104
46. Huang GM, Zheng OY, Cooks RG (2009) Chem Commun 5:556–558 47. Zhang Y, Ma XX, Zhang SC, Yang CD, Ouyang Z, Zhang XR
(2009) Analyst 134:176–181
48. Chen HW, Venter A, Cooks RG (2006) Chem Commun 19:2042– 2044
49. Gu HW, Chen HW, Pan ZZ, Jackson AU, Talaty N, Xi BW, Kissinger C, Duda C, Mann D, Raftery D, Cooks RG (2007) Anal Chem 79:89–97
50. Chen HW, Wortmann A, Zhang WH, Zenobi R (2007) Angew Chem Int Ed 46:580–583
51. Chen H, Yang S, Wortmann A, Zenobi R (2007) Angew Chem Int Ed 46:7591–7594
52. Zhu L, Gamez G, Chen HW, Huang HX, Chingin K, Zenobi R (2008) Rapid Commun Mass Spectrom 22:2993–2998
53. Zhu L, Gamez G, Chen HW, Chingin K, Zenobi R (2009) Chem Commun 5:559–561
54. Chingin K, Gamez G, Chen HW, Zhu L, Zenobi R (2008) Rapid Commun Mass Spectrom 22:2009–2014
55. Jackson AU, Werner SR, Talaty N, Song Y, Campbell K, Cooks RG, Morgan JA (2008) Anal Biochem 375:272–281
56. Ding JH, Yang SP, Liang DP, Chen HW, Wu ZZ, Zhang LL, Ren YL (2009) Analyst 134:2040–2050
57. Chen HW, Zenobi R (2008) Nat Protoc 3:1467–1475
58. Chingin K, Chen H, Gamez G, Zhu L, Zenobi R (2009) Anal Chem 81:123–129
59. Chen HW, Hu B, Hu Y, Huan YF, Zhou JG, Qiao XL (2008) J Am Soc Mass Spectrom 20:719–722
60. Chen HW, Wortmann A, Zenobi R (2007) J Mass Spectrom 42:1123–1135
61. Law WS, Chen HW, Ding JH, Yang SP, Zhu L, Gamez G, Chingin K, Ren YL, Zenobi R (2009) Angew Chem Int Ed 48:8277–8280
62. Walsh KP, McLaughlan RG (1999) Water Air Soil Pollut 115:525–534
63. Sbrana E, Spinetti M, Secco F, Raspi G (2002) Polyhedron 21:1475–1479
64. Vallebona G, Banchini G, Borraccini A, Raspi G (1988) Fresenius Z Anal Chem 331:584–587
65. Kuo YM, Wang CS (1999) J Aerosol Sci 30:1171–1179 66. Horak T, Culik J, Jurkova M, Cejka P, Kellner V, Bruges (2008)
Elsevier Science Bv, Belgium, pp 96–99
67. Cajka T, Riddellova K, Tomaniova M, Hajslova J (2010) J Chromatogr A 1217:4195–4203
68. Couldwell AM, Thomas MC, Mitchell TW, Hulbert AJ, Blanksby SJ (2005) Rapid Commun Mass Spectrom 19:2295–2304 69. Newitt DM, Dombrowski N, Knelan FH (1954) Trans Inst Chem
Eng 32:244–261
70. Dixon RB, Sampson JS, Muddiman DC (2009) J Am Soc Mass Spectrom 20:597–600
71. Kebarle P (2000) J Mass Spectrom 35:804–817
72. Onishi A, Proudlove MO (1994) J Sci Food Agric 65:233–240 73. Evans DE, Sheehan MC, Stewart DC (1999) J Inst Brew
105:171–177
74. Depraetere SA, Delvaux F, Coghe S, Delvaux FR (2004) J Inst Brew 110:200–206