ORIGINAL PAPER
Use of the dried blood spot sampling process coupled
with fast gas chromatography and negative-ion chemical
ionization tandem mass spectrometry: application
to fluoxetine, norfluoxetine, reboxetine,
and paroxetine analysis
Julien Déglon&Estelle Lauer&Aurélien Thomas&
Patrice Mangin&Christian Staub
Received: 21 September 2009 / Revised: 14 December 2009 / Accepted: 15 December 2009 / Published online: 10 January 2010
# Springer-Verlag 2010
Abstract The objective of this work was to combine the advantages of the dried blood spot (DBS) sampling process with the highly sensitive and selective negative-ion chemical ionization tandem mass spectrometry (NICI-MS-MS) to analyze for recent antidepressants including fluoxetine, nor-fluoxetine, reboxetine, and paroxetine from micro whole blood samples (i.e., 10μL). Before analysis, DBS samples were punched out, and antidepressants were simultaneously extracted and derivatized in a single step by use of pentafluoropropionic acid anhydride and 0.02% triethylamine in butyl chloride for 30 min at 60 °C under ultrasonication. Derivatives were then separated on a gas chromatograph coupled with a triple-quadrupole mass spectrometer operating in negative selected reaction monitoring mode for a total run time of 5 min. To establish the validity of the method, trueness, precision, and selectivity were determined on the basis of the guidelines of the “Société Française des Sciences et des Techniques Pharmaceutiques” (SFSTP). The assay was found to be linear in the concentration ranges 1 to 500 ng mL−1for fluoxetine and norfluoxetine and 20 to 500 ng mL−1 for reboxetine and paroxetine. Despite the small sampling
volume, the limit of detection was estimated at 20 pg mL−1 for all the analytes. The stability of DBS was also evaluated at −20 °C, 4 °C, 25 °C, and 40 °C for up to 30 days. Furthermore, the method was successfully applied to a pharmacokinetic investigation performed on a healthy vol-unteer after oral administration of a single 40-mg dose of fluoxetine. Thus, this validated DBS method combines an extractive—derivative single step with a fast and sensitive GC-NICI-MS-MS technique. Using microliter blood samples, this procedure offers a patient-friendly tool in many biomed-ical fields such as checking treatment adherence, therapeutic drug monitoring, toxicological analyses, or pharmacokinetic studies.
Keywords DBS . Fast GC . NICI-MS-MS . Antidepressants . Pharmacokinetics
Introduction
Until 1980, the first line of depression treatment was tricyclic antidepressants and monoamine oxidase inhibitors. Their pharmacological action was attributed to increasing the synaptic concentration of the noradrenergic and serotonergic neurotransmitters. However, these compounds present many side effects due to binding to multiple receptors, cardio-toxicity and diverse drug-drug interactions that may lead to severe intoxication [1,2].
In 1980, an important new class of antidepressants was introduced, the selective serotonin reuptake inhibitors (SSRIs), including fluoxetine and paroxetine. This class has become a mainstay of antidepressant treatment due to
J. Déglon
:
E. Lauer:
A. Thomas:
P. Mangin:
C. Staub (*) Unit of Toxicology, University Center of Legal Medicine, 1 rue Michel-Servet,1211 Geneva 4, Switzerland e-mail: Christian.staub@hcuge.ch
J. Déglon
:
E. Lauer:
A. Thomas:
C. Staub Swiss Center of Applied Human Toxicology, University of Geneva,35 rue des Bains, 1205 Geneva, Switzerland DOI 10.1007/s00216-009-3412-6
its better safety and tolerability [1]. More recently, newer antidepressants have been developed, including noradrenergic reuptake inhibitors (NaRIs) such as reboxetine.
However, even if these new compounds have fewer undesirable effects, they are frequently used in deliberate self-poisoning and can lead to major intoxication [3–5]. Furthermore, some depressed patients do not respond to their treatment, because of non-compliance or co-medication with inducers of their enzymes [6, 7]. Thus, analysis of antidepressants is required in many fields such as therapeutic drug monitoring or forensic toxicology.
Traditionally, clinical and/or toxicological analyses are performed using plasma obtained by venipuncture [8, 9]; however, this sampling form requires a hospital infrastruc-ture and can be hazardous for the patient population where venous collection is problematic [10]. Among alternative sampling procedures, use of filter paper as a support for blood collection seems to be a powerful and patient-friendly tool.
Referred to as dried blood spot (DBS), this alternative procedure was successfully introduced by Guthrie et al. in 1963 for collecting newborns’ capillary blood for the neonatal screening of phenylketonurea. Since then, the filter paper 903S&S produced by Whatman has been introduced for multiple neonatal metabolic disorder screening programs worldwide [11].
The DBS procedure offers the advantages, compared with venipuncture, of being less invasive and more cost-effective in terms of sample collection, shipment, and storage [12,13]. Indeed, blood samples are collected from a small finger prick with an automatic lancet, enabling non-hospital based sampling, so that patients can even perform the sampling themselves at home [14,15]. Furthermore, the DBS sampling process does not require the use of anticoagulant or plasma separation and ensures better stability of the compounds during shipment and storage without using a refrigeration device [16–18]. Security is also improved by the deactivation of potential pathogens, for example HIV virus, on the filter paper [15,19,20].
Because of these advantages, DBS was recently applied to the monitoring of therapeutic agents including antimalarials, antiepileptics, antiretrovirals, antidiabetics, and antibiotics [8,21–27].
An important analytical aspect to take in consideration with the DBS procedure is the limited sample volume, which may be problematic in terms of sensitivity, especially at lower therapeutic concentration levels. This lack has to be compensated by the use of highly sensitive detectors such as triple-stage mass spectrometers operating in the selected reaction monitoring (SRM) mode [28]. Although the use of tandem mass spectrometry (MS-MS) with atmospheric-pressure ionization (API) coupled to liquid chromatography is known to be the gold standard for
quantification of pharmaceutical compounds [29, 30], negative-ion chemical ionisation (NICI) combined with gas chromatography (GC) is an interesting alternative. Indeed, NICI has been demonstrated to be a very highly sensitive and selective ionization mode [31–33], and has been successfully applied to different classes of pharmaceutical compounds, for example antidepressants, benzodiazepines, opioids, and cannabinoids [34–39].
Nevertheless, NICI generally requires a derivatization step to improve the electro-affinity of the analytes. This step is often tedious and time-consuming. An important part of this work was focused on optimization of the derivatization step to decrease the sample preparation time. Thus, derivatization of the antidepressants was combined in a single step with extraction of the DBS.
This article describes a new efficient method for quantitative monitoring of three antidepressants and one phase I metabolite in whole blood by combining the DBS sampling procedure with accelerated GC separation coupled to NICI-MS-MS detection. Because of its high sensitivity and selectivity, this approach is particularly interesting for clinical and toxicological analyses because only 10 μL blood is required.
Experimental
Chemicals and reagents
Fluoxetine, fluoxetine d6, norfluoxetine, and norfluoxetine
d6 at 1000 μg mL−1 or 100 μg mL−1 in methanol were
purchased from Cambridge Isotope Laboratory (Andover, USA). Reboxetine, paroxetine, and paroxetine d6 were
purchased from Sigma-Aldrich (Steinheim, Germany). Reboxetine d5 was obtained from Toronto Research
Chemicals (North York, Canada).
Working standard solutions were prepared by dilution of stock solutions with methanol to reach concentrations of interest ranging from 1 to 10 μg mL−1, except for deuterated compounds, used as internal standards (IS), which were prepared in a vial by dilution with methanol to reach concentrations of 250 ng mL−1for fluoxetine d6and
norfluoxetine d6and 500 ng mL−1 for both reboxetine d5
and paroxetine d6. After use, stock and working solutions
were stored at −20 °C.
Pentafluoropropionic anhydride (PFPA) 99% and trie-thylamine 99% were obtained from Sigma-Aldrich (Bellefonte, USA). All solvents used, for example hexane, methanol, and butyl chloride, were of high-performance chromato-graphic grade from Merck (Darmstadt, Germany) and Romil (Obergoesgen, Switzerland). Human blood was supplied by the Geneva University Hospitals (Geneva, Switzerland); EDTA was used as anti-coagulant.
DBS sample processing
Preparation of calibration standards and quality control samples
Calibration standards (Cal) were prepared one day before analysis. After evaporation of appropriate working standard solutions previously added to Eppendorf tubes, antidepressant-free EDTA—whole blood was added to reach a calibration range of 1 to 500 ng mL−1 for both fluoxetine and norfluoxetine and 20 to 500 ng mL−1for both paroxetine and reboxetine.
Quality controls (QC) were simultaneously and indepen-dently prepared in the same way in our laboratory. Four QC samples at concentrations of 1, 20, 250, and 500 ng mL−1 for both fluoxetine and norfluoxetine and 20, 40, 250, and 500 ng mL−1 for both paroxetine and reboxetine were prepared one day before analysis, similarly to the calibration standards.
Blood spotting
Real or spiked whole blood (10μL) was spotted on a filter paper card, item no. 105355097 from Whatman, Schleicher and Schuell (Dassel, Germany), using a volumetric micro-pipette (Eppendorf, Hamburg, Germany). The blood spots were allowed to dry at room temperature for 2 h and then packed in a sealable plastic bag containing a desiccant pad until analysis. They were stored in the dark at ambient temperature except for short-term stability experiments, in which different temperatures were tested.
DBS sample preparation
Before analysis, DBS were punched out, and 5μL IS was added directly on to the disc. Extraction and derivatization were performed simultaneously in a single step by adding 500μL 0.02% triethylamine in butyl chloride and 100 μL PFPA, followed by ultrasonication for 30 min at 60 °C. The organic phase was then transferred into a conical vial and evaporated to dryness under a stream of nitrogen. Finally, the fluorinated derivatives were reconstituted with 50 μL hexane, and 2 μL was injected into the GC-MS system.
GC-NICI-MS-MS analysis
Analyses were performed on a Varian (Walnut Creek, CA, USA) CP 3800 gas chromatograph in combination with a CTC Combi-PAL autosampler (Zwingen, Switzerland) and a Varian 1200 L MS-MS triple-quadrupole mass spectrometer. Data acquisition and analysis were performed using Varian MS Workstation software (6.8).
Chromatographic conditions
Substances were separated using a fused-silica capillary column (DB-5MS, 15 m×0.25 mm i.d., film thickness 0.25 μm), and high-purity helium (99.999%) was used as the carrier gas with a constant flow of 1 mL min−1. For all of the analyses, the injector temperature was set at 300 °C, and splitless injection was used, with the injection purge valve remaining closed for 1 min.
Under fast GC-MS-MS conditions, the initial column temperature was set at 105 °C for 1 min, increased to 300 °C at 70° min−1, and held for 1.22 min for a total analysis time of 5 min.
Mass spectrometric detection
Methane (purity of 99.9995 %) was used as reagent gas for NICI analyses at a pressure between 8 and 8.5 Torr. Transfer line, manifold, and ion source were operated at 275, 40, and 150 °C, respectively. The mass spectrometer was operated in the negative SRM mode with MS-MS experiments based on collisionally induced dissociation (CID) occurring in the collision cell (quadrupole 2), with an argon collision gas pressure of 1.3 mTorr.
All MS-MS conditions are shown in Table 1. The transitions chosen for each compound were based on criteria of abundance and selectivity. The different NICI-MS-MS conditions (reagent gas pressure, CID pressure, collisional energy) were optimized with the use of antidepressant standard solutions (data not presented here). In fast GC mode, the duty cycle was set at 0.15 s to obtain a sufficient number of work points to meet quantitative needs (between 9 and 12 points).
Validation procedure
A full validation procedure for human dried blood spots was conducted according to the guidelines of the“Société Française des Sciences et des Techniques Pharmaceutiques” (SFSTP) [40].
On each of three non-consecutive days, DBS Cal were prepared in duplicate (n=2) at five concentration levels (k=5; Cal=1, 20, 50, 150, and 500 ng mL−1 for both fluoxetine and norfluoxetine, and Cal=20, 50, 150, 300, and 500 ng mL−1 for reboxetine and paroxetine) for determining the response function. Furthermore, DBS QC were prepared independently in the same way in quadruplicate (n=4) at four concentration levels (k=4; QC=1, 20, 250, and 500 ng mL−1for both fluoxetine and norfluoxetine, and QC= 20, 40, 250, and 500 ng mL−1for reboxetine and paroxetine), representing the entire range of concentrations.
Validation enabled determination of specific criteria such as trueness, precision, linearity, limit of quantification
(LOQ), and limit of detection (LOD), which will be discussed later.
Recovery and matrix effects
The efficiency of the procedure was evaluated by comparing the absolute analyte peak area from DBS spiked with all antidepressants at the concentration of 250 ng mL−11, with the corresponding methanolic solutions spiked directly into the extraction tube containing 2, or not 3, antidepressant-free DBS specimen. Recovery and matrix effects were obtained by using the 1/3 and the 2/3 ratios respectively [41]. For each experiment, analyses were performed in triplicate.
Stability of DBS
To test the short-term stability of the antidepressants on filter paper, three batches of antidepressant-free whole blood were spiked with all the analytes at 250 ng mL−1. DBS samples were prepared using the same procedure described in the section“Blood spotting” and subsequently stored at different temperatures (−20 °C, 4 °C, 21 °C, and 40 °C). Stability study was carried out over one month with time points of 1, 3, 5, 15, and 30 days. For each time point, DBS samples were analyzed in triplicate with a waiting period of 12 h at ambient temperature before the analysis.
Pharmacokinetic investigation
The described procedure was applied to the monitoring of fluoxetine and its main phase I metabolite norfluoxetine after oral administration of a single 40-mg dose of fluoxetine (two capsules of 20 mg Fluctine, Eli Lilly, Geneva, Switzerland) to a healthy male volunteer (68 kg, 180 cm).
Capillary whole blood was collected at different time points over one month using the DBS sampling process.
Except for the first day, all DBS samples were performed at home by the volunteer himself after a finger prick made on the top of the finger with a disposable lancet. At each time point, five spots of 10μL of capillary blood were collected and stored on filter paper card using the procedure described in the section“Blood spotting”. Last, filter paper cards were sent to our laboratory by mail in a sealable plastic bag containing a desiccant pad.
Because norfluoxetine is known to contribute to the overall therapeutic and/or toxic effect [7,31,42,43], both the parent drug and the active metabolite were quantified from DBS in duplicate for each time point. In addition, pharmacokinetic parameters were estimated for these analytes by a non-compartmental method using WinNonlin version 4.1 (Pharsight, Mountainview, California, USA). Pharmacokinetic parameters such as Cmax, Tmax, and t1/2
were calculated from standard equations using WinNonlin, and AUC0-∞was calculated using the trapezoidal rule.
Results and discussion
DBS sample preparation
Use of the DBS sampling process requires an extractive step before analysis. The challenge is to remove the compounds of interest from the filter paper and to retain blood components. Generally, a mixture of water and organic solvents, for example acetonitrile or methanol, is employed [8, 15, 44, 45]. However, protic solvents are unsuitable with the simultaneous use of acylation agents such as fluorinated agents. Therefore, a large part of the method development was focusing on the combination of extraction solvent with fluorinated agent (i.e., PFPA) to ensure an efficient and simple preparation step. In this way, different aprotic solvents including butyl chloride, ethyl
Table 1 MS-MS conditions for antidepressants
Antidepressant Molecular mass compound/derivative (gmol−1) Q1→ Q3 (m/z) Collision energy (eV) Retention time (min)
Norfluoxetine d6 301/447 472→ 265 5 3.4 Norfluoxetine 295/441 421→ 161 15 3.4 421→ 259 10 Fluoxetine d6 315/461 441→ 161 5 3.5 Fluoxetine 309/455 435→ 161 5 3.5 435→ 306 15 Reboxetine d5 318/464 424→ 404 5 4.1 Reboxetine 313/459 419→ 109 10 4.1 419→ 137 15 Paroxetine d6 335/481 441→ 109 15 4.7 Paroxetine 329/475 435→ 109 15 4.7 435→ 137 15
acetate, and hexane were tested for their extraction capabilities. Under our selected conditions, butyl chloride showed better results in terms of sensitivity (highest signal-to-noise ratios) and selectivity. Additionally, the sonication time and the temperature applied during the extraction-derivatization single step were optimized. Thus, thirty minutes of sonication at 60 °C represents the best compromise in our case. Although the use of butyl chloride resulted in poorer extraction recovery compared with water or methanol for DBS application (data not shown), this aprotic organic solvent enabled the simultaneous use of PFPA, thus combining derivatization and extraction in a single step.
Fast GC-NICI-MS-MS
In the past several years, the development of a high-throughput analytical method has become a laboratory standard. Numerous studies have been published regarding theoretical approaches to optimization of GC speed [46]. Depending on the resolution required, it is possible to trade resolution for time [47]. In this way, an attractive approach is to use a faster programming temperature, which enables use of a narrow-bore column (i.e., 0.25 mm), offering better robustness compared to a microbore column when repeated injections of biological matrices are carried out [32]. In our study, application of a 70° min−1 gradient enabled rapid and good separation, because the total analysis time was 5 min, and the full widths at half-maximum (FWHM) were about 0.6 s for each compound, which is in agreement with fast GC requirements [47].
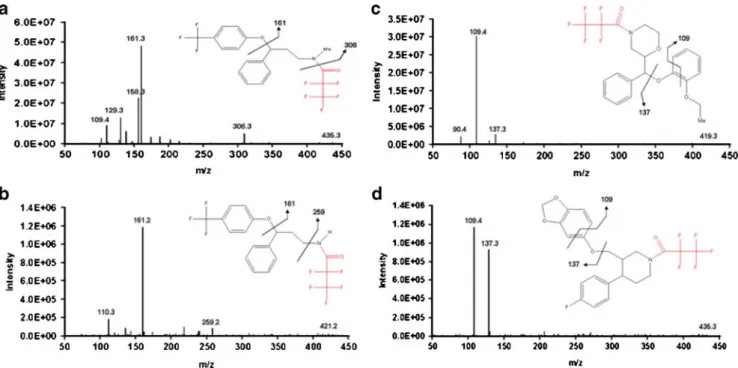
NICI is a highly selective and sensitive ionization mode for compounds with a high electron affinity [32, 48]. Although any molecule is able to capture an electron, only those with a positive electro-affinity will be stable enough to be detected. Thus, the derivatization is an important step in increasing the electro-affinity of the molecule and improving sensitivity and selectivity. Moreover, the high pressure of NICI contributes to thermalize the formed ion owing to the multiple low-energy collisions. This aspect is interesting when tandem mass spectrometry is used, because precursor ions will have a lower internal energy compared with other ionization modes such as electronic impact. Figure1shows the product ion spectra obtained for the antidepressants, which present few fragment ions and consequently better sensitivity. This weak fragmentation is interesting for these compounds, which have a low molecular mass, although it provides at least two transitions required for toxicological analysis (i.e., quantitation and identification).
In this work, the use of PFPA as fluorinated agents with the NICI-MS-MS enables observation of a very intense signal for our compounds of interest, although only 10μL of blood was used without any preconcentration step, in contrast with the conventional procedure (see Fig.2and the section“Selectivity, LOQ, and LOD”).
Validation
Response function
Response functions were determined by use of several regression models [49,50]. The best results were obtained for weighted linear regression with a weight factor of 1/x2 for each compound.
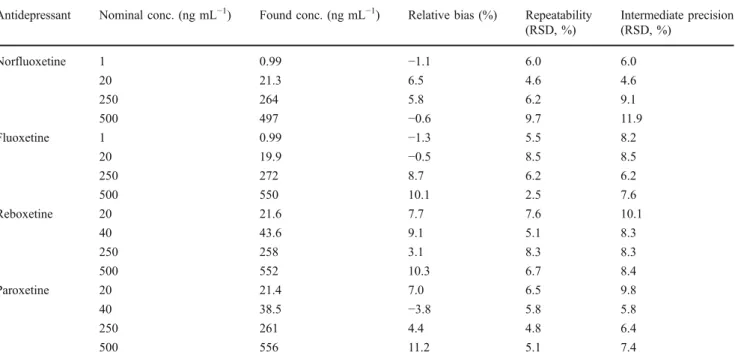
Trueness and precision
The trueness and the precision of the method were determined with independent QC DBS samples at each concentration level. Hence, the trueness was determined by calculating the percentage difference between experimental and theoretical concentration values, indicating systematic error. Precision which indicates random errors, was assessed by computing the relative standard deviation for the repeatability (RR.S.D.) and the between day variability,
expressed as the intermediate precision (IPR.S.D.) [49–51].
Repeatability represents the given precision under conditions of repeatability (the same operator, the same samples, the same reagents, etc.). The intermediate precision represents the precision resulting from repetitions performed in a laboratory on the same sample but under different conditions (here, different days and reagents). As presented in Table2, relative bias, RR.S.D. and IPR.S.D. values were below 12% in
agreement with the SFSTP validation criteria.
Linearity and accuracy profiles
The linearity of an analytical method is its capacity to provide results directly proportional to the concentration of the sample within a certain concentration range [51]. Linearity was calculated by fitting the back-calculated concentrations of the QCs as a function of the introduced concentrations and by applying the linear regression model based on the least-squares method [50]. With coefficients of determination (r2) above 0.9986 and slope values between 0.998 and 1.114, the method was linear for the four antidepressants.
Figure 3 illustrates the relative accuracy profiles of the four antidepressants. These profiles, built using total error (bias and precision), provide an estimation of the uncer-tainty measurement of the entire linearity range. A relative error of 30% was selected as the acceptance threshold where the expected proportion of measures (95%) was within the acceptance limits. As depicted, all of the accuracy profiles are between ±30%, demonstrating that the method is suitable for performing clinical and toxicological analyses. For this purpose, other antidepressants such as fluvoxamine, maproti-line, and sertraline were tested with the described procedure and preliminary results were satisfactory in terms of sensitiv-ity and selectivsensitiv-ity (data not shown). However, the lack of
corresponding internal standard did not permit the inclusion of these compounds in this study.
Selectivity, LOD, and LOQ
In order to test the selectivity of the method, six different human blank DBSs were checked for interferences. Figure2B shows a typical total ion current chromatogram of one blank DBS, demonstrating that no interfering peaks were present at the retention times of the compounds of interest. Carry-over was also investigated by injecting a blank solution (hexane) after injection of twice the highest calibration point. The results showed that no carry-over was observed with our procedure (lower than 0.01%).
The sensitivity encountered was largely better than therapeutic requirements, which enabled safe quantification of the compounds with LOQ of 1 ng mL−1 for fluoxetine and norfluoxetine and 20 ng mL−1 for reboxetine and
paroxetine (Figs.2C–F), whereas the LODs were 20 pg mL−1 for each compound. LOQ was determined as the lowest QC with trueness and precision under 15%, whereas LOD was estimated as three times the signal-to-noise ratio (S/N).
Recovery and matrix effects
The results of the recovery and matrix effects investigations are summarized in Table 3. As depicted, recoveries obtained were acceptable for all compounds, even if extraction and derivatization were combined into a single step. Furthermore, no matrix effect was observed, which is in agreement with the use of NICI [34].
Stability of DBS
Numerous methods have shown that DBS offered high stability properties for many classes of compounds [15]. To
Fig. 1 Product-ion spectra of derivatives of the antidepressants after NICI ionization of: fluoxetine at a collision energy of 5 eV (a), norfluoxetine at 15 eV (b), reboxetine at 10 eV (c), and paroxetine at 15 eV (d). Fragmentation pathways are proposed for each compound
Fig. 2 Total ion current chromatograms of a blank filter paper (a) and human whole blood DBS (b), and selected reaction monitoring chromatograms of DBS containing norfluoxetine at 1 ng mL−1(c), fluoxetine at 1 ng mL−1(d), reboxetine at 20 ng mL−1(e), and paroxetine at 20 ng mL−1(f)
Table 2 Validation data
Antidepressant Nominal conc. (ng mL−1) Found conc. (ng mL−1) Relative bias (%) Repeatability (RSD, %) Intermediate precision (RSD, %) Norfluoxetine 1 0.99 −1.1 6.0 6.0 20 21.3 6.5 4.6 4.6 250 264 5.8 6.2 9.1 500 497 −0.6 9.7 11.9 Fluoxetine 1 0.99 −1.3 5.5 8.2 20 19.9 −0.5 8.5 8.5 250 272 8.7 6.2 6.2 500 550 10.1 2.5 7.6 Reboxetine 20 21.6 7.7 7.6 10.1 40 43.6 9.1 5.1 8.3 250 258 3.1 8.3 8.3 500 552 10.3 6.7 8.4 Paroxetine 20 21.4 7.0 6.5 9.8 40 38.5 −3.8 5.8 5.8 250 261 4.4 4.8 6.4 500 556 11.2 5.1 7.4
Fig. 3 Relative accuracy profiles of fluoxetine (a), norfluoxetine (b), reboxetine (c), and paroxetine (d) with 1/x2 weight factor. The continuous line represents the trueness, the dashed lines are the upper
and lower accuracy limits in relative values, and the dotted lines are the upper and lower 30% tolerance limits
the best of our knowledge, antidepressant stability has never been investigated on filter paper.
Figure4shows good stability of fluoxetine, norfluoxetine, reboxetine, and paroxetine in dried blood spots over 30 days, as all tested DBS showed concentrations were between 85 and 115% of the initial concentration. Interestingly, no significant difference was observed between the four investigated temperatures, confirming that DBS can be stored at ambient temperature for a relatively long time period. With these
Table 3 Recovery and matrix effects for the four antidepressants at 250 ng mL−1(n=3)
Antidepressant Matrix effect (%) Recovery/RSD (%)
Norfluoxetine +1.7 81.6/3.8
Fluoxetine +4.1 73.2/3.0
Reboxetine −1.5 60.8/3.2
Paroxetine −3.0 89.6/2.2
Fig. 4 Stability of fluoxetine (a), norfluoxetine (b), reboxetine (c), and paroxetine (d) spiked at 250 ng mL−1in DBS stored at−20 °C (crosses), 4 °C (squares), 20 °C (triangles), and 40 °C (circles)
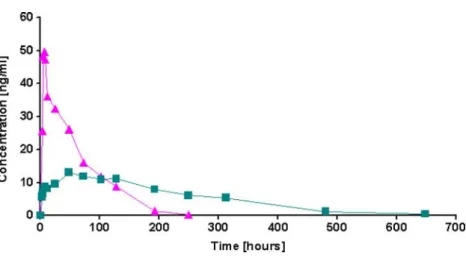
Fig. 5 Concentration vs. time profiles for fluoxetine (triangles) and norfluoxetine (squares) detected in DBS samples collected from a volunteer after oral
administration of a single 40-mg dose of fluoxetine
considerations, the DBS sampling process provides a powerful tool in terms of storage and shipment of antidepressants because sampling can be performed in a non-hospital based environment, where refrigeration is problematic, or in other resource-limited settings.
After the extraction-derivatization step, autosampler stabil-ity of reconstituted samples was verified by re-injection of QCs after a waiting period of 12 h at ambient temperature. No statistical difference of analyte peak area was observed.
Pharmacokinetic investigation
Figure5 shows representative concentration—time curves
of fluoxetine and norfluoxetine after oral administration of fluoxetine. Because of to its high sensitivity, the outlined method enabled the quantification of fluoxetine and norfluoxetine up to 250 and 650 h, respectively, from only 10μL blood samples.
The data processing estimated Cmax at 49.5 and
13.0 ng mL−1, Tmax at 6.0 and 48.0 h, t1/2 at 40.5 and
106 h, and AUC0-∞ at 1906 and 3170 h ng mL−1 for
fluoxetine and norfluoxetine, respectively. The values obtained were close to those usually found in literature based on venous sampling [52,53]. Although the investigation was carried out on a single volunteer, the DBS sampling process seems to be as suitable for performing pharmacokinetic studies as classic venipuncture. However, further investiga-tions are necessary to valuably compare results obtained from capillary blood and DBS, and from plasma and capillary specimens.
Conclusion
The objective of the work discussed in this article was to perform quantitative analyses of antidepressants from 10μL whole blood using the DBS sampling procedure. Because of its high sensitivity and selectivity, the use of NICI-MS-MS enabled detection of compounds of interest up to 20 pg mL−1 without preconcentration. Optimization of the extraction step by use of an appropriate solvent enabled combination of derivatization and extraction in a single step, reducing the sample-preparation time. Moreover, the use of fast GC conditions makes this assay suitable for high-throughput analysis. The method offered accurate quantification in terms of trueness and precision of the four antidepressants tested over their therapeutic concentration range.
DBS sampling coupled with GC-NICI-MS-MS was successfully applied to a pharmacokinetic investigation of fluoxetine and its active phase I metabolite on a healthy volunteer. As the stability of the antidepressants in DBS was shown to be unaffected by temperature, the pharmacokinetic samples were shipped by mail without a refrigeration device
after collection by the volunteer himself at home. This simplified procedure is particularly advantageous when multiple samples are required.
Combining the numerous advantages of DBS sampling with a sensitive and efficient GC-NICI-MS-MS technique, this validated assay represents an interesting alternative for microanalysis to traditional methods used in therapeutic drug monitoring and pharmacokinetic studies.
Acknowledgments The authors would like to thank Dr Youssef Daali from the Division of Clinical Pharmacology and Toxicology, Geneva University Hospitals (Switzerland) for his help.
References
1. Kent JM (2000) Lancet 355:911–918
2. Wille SMR, Maudens KE, Van Peteghem CH, Lambert WEE (2005) J Chromatogr A 1098:19–29
3. Azaz-Lishits T, Hershko A, Ben-Chetrit E (2002) Pharmacopsychiatry 35:112–115
4. Adson DE, Erickson-Birkedahl S, Kotlyar M (2001) Ann Pharmacother 35:1375–1377
5. Kelly CA, Laing WJ, Strachan FE, Good AM, Bateman DN (2004) J Toxicol Clin Toxicol 42:67–71
6. Vaswani M, Linda FK, Ramesh S (2003) Prog Neuropsychopharmacol Biol Psychiatry 27:85–102
7. Mandrioli R, Forti GC, Raggi MA (2006) Curr Drug Metab 7:127– 133
8. ter Heine R, Rosing H, van Gorp ECM, Mulder JW, van der Steeg WA, Beijnen JH, Huitema ADR (2008) J Chromatogr B 867:205– 212
9. Damen CWN, Rosing H, Schellens JHM, Beijnen JH (2009) Anal Bioanal Chem 394:1171–1182
10. Boy RG, Henseler J, Mattern R, Skopp G (2008) Ther Drug Monit 30:733–739
11. Zytkovicz TH, Fitzgerlad EF, Marsden D, Larson CA, Shih VE, Johnson DM, Strauss AW, Comeau AM, Eaton RB, Grady GF (2001) Clin Chem 47:1945–1955
12. Mcdade TW, Williams S, Snodgrass JJ (2007) Demography 44:899– 925
13. Mei JV, Alexander JR, Adam BW, Hannon WH (2001) J Nutr 131:1631–1636
14. Cheung CY, van der Heijden J, Hoogtanders K, Christiaans M, Liu YL, Chan YH, Choi KS, van de Plas A, Shek CC, Chau KF, Li CS, van Hooff J, Stolk L (2008) Transpl Int 21:140–145 15. Edelbroek PM, van der Heijden J, Stlok LML (2009) Ther Drug
Monit 31:327–336
16. Barfield M, Spooner N, Lad R, Parry S, Fowles S (2008) J Chromatogr B 870:32–37
17. Blessborn D, Römsing S, Annerberg A, Sundquist D, Björkman A, Lindegardh N, Bergqvist Y (2007) J Pharm Biomed Anal 45:282–287 18. Mwaba P, Cassol S, Pilon R, Chintu C, Janes M, Nunn A, Zumla
A (2003) Lancet 362:1459–1460
19. Koal T, Burhenne H, Römling R, Svoboda M, Resch K, Kaever V (2005) Rapid Commun Mass Spectrom 19:2995–3001
20. Guidelines for the shipment of dried blood spot specimens (1995) Center for Diseases Control and Prevention, Atlanta, GA, USA;http:// www.cdc.gov/od/ohs/biosfty/driblood.htm. Accessed 20 December 2009
21. Lejeune D, Souletie I, Houzé S, Le Bricon T, Le bras J, Gourmel B, Houzé P (2007) J Pharm Biomed Anal 43:1106–1115
22. Ntale M, Mahindi M, Ogwal-Okeng JW, Gustafsson LL, Beck O (2007) J Chromatogr B 859:137–140
23. la Marca G, Malvagia S, Filippi L, Fiorini P, Innocenti M, Luceri F, Pieraccini G, Moneti G, Francese S, Dani FR, Guerrini R (2008) J Pharm Biomed Anal 48:1392–1396
24. Coombes EJ, Gamlen TR, Batstone GF, Leigh PN (1984) Ann Clin Biochem 21(Pt 6):519–522
25. AbuRuz S, Millership J, McElnay J (2006) J Chromatogr B 832:202–207
26. Fujimoto T, Tsuda Y, Tawa R, Hirose S (1989) Clin Chem 35:867– 869
27. Allanson AL, Cotton MM, Tettey JNA, Boyter AC (2007) J Pharm Biomed Anal 44:963–969
28. van der Heijden J, de Beer Y, Hoogtanders K, Christiaans M, de Jong GJ, Neef C, Stolk L (2009) J Pharm Biomed Anal 50:664–670 29. Saint-Marcoux F, Sauvage FL, Marquet P (2007) Anal Bioanal
Chem 388:1327–1349
30. Mauriala T, Chauret N, Oballa R, Nicoll-Griffith DA, Bateman KP (2005) Rapid Commun Mass Spectrom 19:1984–1992 31. Wille SMR, Van Hee P, Neels HM, Van Peteghem CH, Lambert
WE (2007) J Chromatogr A 1176:236–245
32. Thomas A, Widmer C, Hopfgartner G, Staub C (2007) J Pharm Biomed Anal 45:495–503
33. Maurer HH (2002) Ther Drug Monit 24:247–254
34. Gunnar T, Ariniemi K, Lillsunde P (2006) J Mass Spectrom 41:741–754
35. Cirimele V, Kintz P, Ludes B (1997) J Chromatogr B 700:119–129 36. Kintz P, Tracqui A, Mangin P (1996) J Forensic Sci 41:851–854 37. Kuhlman JJ Jr, Magluilo J Jr, Cone E, Levine B (1996) J Anal
Toxicol 20:229–235
38. Watson DG, Su Q, Midgley JM, Doyle E, Morton NS (1995) J Pharm Biomed Anal 13:27–32
39. Wilkins D, Haughey H, Cone E, Huestis M, Foltz R, Rollins D (1995) J Anal Toxicol 19:483–491
40. Boulanger B, Chiap P, Dewé W, Crommen J, Hubert P (2003) J Pharm Biomed Anal 32:753–765
41. Matuszewski BK, Constanzer ML, Chavez-Eng CM (2003) Anal Chem 75:3019–3030
42. Qu Y, Aluisio L, Lord B, Boggs J, Hoey K, Mazur C, Lovenberg T (2009) Pharmacol Biochem Behav 92:469–473
43. Vlase L, Imre S, Leucuta S (2005) Talanta 66:659–663
44. Hoogtanders K, van der Heijden J, Christiaans M, Edelbroek P, van Hooff JP, Stolk LML (2007) J Pharm Biomed Anal 44:658– 664
45. Kulik W, van Lenthe H, Stet FS, Houtkooper RH, Kemp H, Stone JE, Steward CG, Wanders RJ, Vaz FM (2008) Clin Chem 54:371– 378
46. Cramers CA, Leclercq PA (1999) J Chromatogr A 842:3–13 47. Mastovska K, Lehotay SJ (2003) J Chromatogr A 1000:153–180 48. Harrison AG (1986) Chemical ionization mass spectrometry. CRC
Press, Boca Raton, Florida
49. Shah VP, Midha K, Dighe S, McGilveray LJ, Skelly JP, Yacobi A, Layloff T, Viswanathan CT, Cook CE, McDowall RD, Pittman KA, Spector S (1992) J Pharm Sci 81:309–312
50. Hubert P, Chiap P, Crommen J, Boulanger B, Chapuzet E, Mercier N, Bervoas-Martin S, Chevalier P, Grandjean D, Lagorce P, Lallier M, Laparra MC, Laurentie M, Nivet JC (1999) Anal Chim Acta 391:135–148
51. Hubert P, Nguyen-Huu JJ, Boulanger B, Chapuzet E, Chiap P, Cohen N, Compagnon NA, Dewé W, Feinberg M, Lallier M, Laurentie M, Mercier N, Muzard G, Nivet C, Valat L (2004) J Pharm Biomed Anal 36:579–586
52. Keller T, Cambon N, Genevray M, Crivelli F, Crivelli M, Dal BL, Mazzuchelli P, Ismaili S, Marzo A (2005) Arzneimittelforschung 55:491–497
53. Najib NM, Idkaidek N, Beshtawi M, Mohammed B, Admour I, Alam SM, Dham R, Qumaruzaman (2005) Biopharm Drug Dispos 26:243–247