HAL Id: hal-03024741
https://hal.laas.fr/hal-03024741
Submitted on 9 Dec 2020
HAL is a multi-disciplinary open access
archive for the deposit and dissemination of sci-entific research documents, whether they are pub-lished or not. The documents may come from teaching and research institutions in France or abroad, or from public or private research centers.
L’archive ouverte pluridisciplinaire HAL, est destinée au dépôt et à la diffusion de documents scientifiques de niveau recherche, publiés ou non, émanant des établissements d’enseignement et de recherche français ou étrangers, des laboratoires publics ou privés.
Characterization and minimization of band broadening
in DNA electrohydrodynamic migration for enhanced
size separation
Jeffrey Teillet, Quentin Martinez, Inga Tijunelyte, Bayan Chami, Aurélien
Bancaud
To cite this version:
Jeffrey Teillet, Quentin Martinez, Inga Tijunelyte, Bayan Chami, Aurélien Bancaud. Characterization and minimization of band broadening in DNA electrohydrodynamic migration for enhanced size sepa-ration. Soft Matter, Royal Society of Chemistry, 2020, 16 (24), pp.5640-5649. �10.1039/D0SM00475H�. �hal-03024741�
1
Characterization of band broadening for the optimization of
DNA electrohydrodynamic separation
Jeffrey Teillet
1, Quentin Martinez
1, Inga Tijunelyte
1, Bayan Chami
1, Aurélien Bancaud
1AFFILIATION
1
CNRS, LAAS, 7 avenue du colonel Roche, F-31400, Toulouse, France.
ABSTRACT
The combination of hydrodynamic actuation with an opposing electrophoretic force in viscoelastic liquids enables the separation, concentration, or purification of DNA. Yet, because this technology uses hydrodynamic flow fields, which are associated to dramatic band broadening due to Taylor dispersion, the attainment of good analytical performances remains to be clarified. Here, we aim to study the mechanism of band broadening in electrohydrodynamic migration, and to minimize its amplitude for DNA separation enhancement. Using an automated microfluidic platform to monitor the migration of a 600 bp DNA band, we conclude that diffusion in the electrohydrodynamic regime is controlled predominantly by the electric field and marginally by the hydrodynamic flow velocity. This response is explained by an analytical model of diffusion based on Taylor dispersion arguments. Furthermore, we establish strategies to modulate the electric field over time and reduce the breadth of a DNA band in the context of optimized separation experiments. Altogether, our report is a leap towards to the development of high-performance analytical technologies based on electrohydrodynamic actuation.
2
INTRODUCTION
The technologies to perform DNA separation by size can be coarsely cast intro three main classes, namely electrophoresis through polymer matrices, transport through artificial micro/nano-fabricated matrices, and matrix-free DNA separation. The mechanism of DNA migration in the first two classes has been the subject of intense research 1–6, which aimed at elucidating the size dependence of the migration and the sources of band broadening, as reviewed in refs. 7,8. These mechanistic studies were coupled to tremendous experimental efforts to optimize separation matrices9,10, which have synergistically contributed to enhance DNA separations. The base resolution is now routinely achieved for sequencing applications 11.
Interest for matrix-free separation technologies is more recent 12 with fewer studies on the separation mechanism despite key advantages in terms of reusability and simplicity of implementation. Matrix-free separation has been achieved with one force field, either hydrodynamic
13,14
or electrophoretic 15. In both cases the degree of confinement appeared to be critical given that experiments were carried out in microchannels of ~1 µm in thickness. The combination of electric and hydrodynamic actuation acting in opposite directions has been exploited to perform size separation in larger channels of 2 to 50 µm using Newtonian 16–18 or viscoelastic 19,20 fluids. The separation mechanism relies on transverse size-dependent forces oriented toward the channel walls, which have been studied analytically or numerically in Newtonian for DNA 21 and viscoelastic fluids for DNA and particles 20,22. Some predictions of models have been tested experimentally and validated 20,23,24. Furthermore, dual actuation aroused attention because it enabled the concentration of DNA in microchannels with a funnel geometry 18,19,25–27. The operations of DNA concentration and separation could be performed on-line with the so-called µLAS (µ-Laboratory for DNA Analysis and Separation) technology to produce high sensitivity DNA profiles with a limit of detection of 10 fg/µL 28,29.
Whereas the physics of DNA separation in viscoelastic electrohydrodynamic migration has been studied experimentally 20,23, the mechanism of band broadening remains more elusive. In this report, we designed a microfluidic chip together with an experimental workbench to perform a systematic investigation of DNA dispersion in the pressure-electric field parameter space. Our study starts with the derivation of a model of band broadening based on Taylor-type arguments. We then motivate our research based on the evidence that the optimal separation of two bands corresponds to a minimum for band broadening. We thus focus on the diffusion coefficient of one single DNA band of 600 bp in three actuation schemes, namely electrohydrodynamic, hydrodynamic and electrophoretic. Our results show that the electrohydrodynamic diffusion coefficient is bonded by the electrophoretic and hydrodynamic responses and can be modulated finely in this parameter space. Furthermore, the diffusion coefficient appears to be mainly controlled by the electric field and marginally by the flow velocity, in excellent agreement with our model. Given that the voltage is a versatile actuation
3
parameter, we finally investigate whether the temporal modulation of the electric field enables the minimization of band broadening, and clarify how to optimize separation experiments by the temporal control over the electric field. Altogether, our study represents a step forward towards the development of high performance analytical technologies for matrix-free DNA separation.
MATERIALS AND METHODS
Chemicals and Biological material
The viscoelastic polymer solutions contained polyvinylpyrrolidone 5% (PVP) of molecular weight (MW) 360 KDa purchased from Sigma Aldrich.
The viscosity
of the solution was 25
mPa.s and the fluid viscoelastic relaxation time
was 0.6 ms, according to the method
developed in ref.
30.
Dissolution of the polymer powders in 1X-TAE buffer (Tris-Acetate-EDTA 31) was performed during 1 day before filtration at 0.2 µm pore size. One or two bands of dsDNA of 600 or 1000 bp (Thermo- Scientific) were then added at a concentration of 0.3 µM together with the intercalating dye YOYO-1 (Thermo-Scientific) at a dye to base pair ratio of 1:8. The channels were initially filled with 70% ethanol to prevent the formation of bubbles, briefly rinsed with deionized water (18.2 MΩcm), and then flushed with the buffer solution containing DNA.Chip fabrication
The glass-silicon microfluidic chips were processed in clean room using photolithography and plasma etching, as described in ref. 32. Briefly, two steps of silicon etching were carried out on a silicon 4-inch wafer, first engraving a shallow channel of 2 μm in depth with a constriction shape (see layout in Fig. 1A) and then a thicker channel of 16 μm away from the constriction to limit the hydraulic resistance of the microfluidic channel. Note that etch depth are defined with 10% reproducibility. The maximal and minimal channel widths were 800 and 5 μm, respectively. Inlets and outlets were then drilled by sand blasting, and the silicon was insulated with a layer of 300 nm of thermally-grown oxide. The devices were eventually sealed by anodic bonding with an AF32 glass wafer for microscopy observation.
Experimental settings for the study of band broadening
We designed an experimental bench to monitor the dynamics of a DNA band throughout its migration in the microchannel. The microfluidic channel consisted of a DNA concentration module based on funnel-shape geometry followed by a linear separation channel of 1.6 mm in length. The length of the separation channel typically matched the field of view of a microscopy platform
4
comprising a 10X objective (Numerical Aperture=0.5, Olympus) and an sCMOS camera (Hamamatsu, ORCA Flash 4.0 lt+) with 2048 pixels of 6.5 µm (yellow dashed rectangle in Fig. 1A). Videos were mostly recorded at inter-frame intervals of 10 ms, but larger intervals were also chosen in the case of slow dynamics. Experiments were run in batch by synchronizing video acquisition and electro-hydrodynamic actuation through a home-made software developed in LabVIEW. The pressure controller (MFCS, Fluigent) operated in the range of 1 to 5 bar, and the voltage generator consisted of a 0-10 V supply (USB acquisition card from National Instruments), which is used with a 100X multiplier to obtain an output in the range of 0 to 200 V.
Data post-treatment consisted in extracting the band profile with a Gaussian fit (Igor Pro) to measure its full width at half maximum (FWHM) and position at time t. The diffusion coefficient was finally estimated between the times and and using the expression:
(1)
We also used two metrics to assess the quality of separation experiments. Knowing the passage time and of band 1 and 2 in front of the detector and their respective widths and , we expressed the resolution as:
(2)
The theoretical plate number per meter 33 was evaluated to assess the sharpness of DNA bands after 1.3 mm of migration:
(3)
MODEL OF TRANSPORT AND DISPERSION
Equation of transport:
We model the evolution of the concentration (x,t) with the Fick diffusion-advection equation, defining the migration velocity and the diffusion coefficient .
(4)
The solution of equation (4) is a Gaussian function in the form:
5
In the following paragraphs, we express and in the context of electrophoretic, hydrodynamic, and electrohydrodynamic migration. In electrophoresis, the DNA velocity is proportional to the electric field with and is the electrophoretic mobility. In the limit of vanishing electric field, band broadening is dictated by Brownian fluctuations7, so that the electrophoretic diffusion coefficient is equal to the bulk diffusion coefficient . The situation is more complex for oriented molecules 2,34 with a linear dependence of the normalized diffusion coefficient with the electrophoretic mobility (see ref. 7, for review).
Hydrodynamic migration is described by the Taylor-Aris model35,36. For molecules smaller than the channel cross-dimension, the migration velocity is equal to the average speed of the flow and the diffusion coefficient is enhanced due to the coupling of longitudinal advection with diffusion transverse to the flow direction. The diffusion process reaches a steady-state once the time scale of flow advection (with the position of the detector along the channel) is greater than the diffusion time across the channel height . For a slit-like channel, the normalized diffusion coefficient is:
(6)
Physics of µLAS and prediction for the diffusion coefficient
In electrohydrodynamic migration, DNA transport in a hydrodynamic flow with an opposing electrophoretic force characterized by the velocity is associated to a transverse force
oriented toward the channel upper and lower walls19. Close to the wall, can be modeled by an
elastic spring, which stiffness increases linearly with and 4,5:
(7)
with the size of the chain, the height of the channel, and the distance from the walls. The use of Boltzmann statistics allows one to deduce DNA average position from the wall 20,23:
(8)
Close to the wall and neglecting hydrodynamic interactions, the Poiseuille flow can be linearized and the DNA velocity therefore reads:
(9)
Boltzmann statistics also enables us to compute the variance of the DNA vertical position, which is on the order of 20,23. We then assume that DNA migration occurs in a space domain
6
delimited by vertical boundaries comprised between =0 and . The diffusion coefficient can then be estimated using Taylor-type arguments 37:
(10)
Note that without confinement, i.e. for , this expression is equal to Eq. (6). In the presence of the transverse viscoelastic force, the leading order term is that on the right, allowing one to estimate the diffusion coefficient by plugging Eq. (8) in Eq. (10):
(11)
In electrohydrodynamic actuation,
the diffusion
coefficient therefore depends on but not on.
This counter-intuitive prediction comes from the fact that the hydrodynamic mixing takes place in a volume set byand
.
RESULTS AND DISCUSSION
Optimal DNA separation is associated to minimal dispersion
In order to evaluate the impact of band broadening on the separations with electrohydrodynamic actuation, we performed series of experiments with on-line concentration and separation in a microfluidic chip with a funnel shape geometry (Fig. 1A, see Methods for fabrication details). The µLAS operation 28,29 consisted of a first phase of concentration during 10 s using a high electric field (red curve in Fig. 1B), which allowed us to stop and accumulate molecules in the funnel, i.e. ahead of the separation channel. At time t0, the electric field was decreased either linearly over time or abruptly
to a second plateau (Fig. 1B), and the DNA band started to migrate in the separation channel, as shown in the time lapse of Fig. 1C. After the full passage of the DNA band, the electric field was turned off to flush the chip and start another experiment. The bands could be characterized either in temporal or in spatial mode. The temporal mode consisted in recording the variation of the intensity signal with a ROI of 20x20 µm2 at 1.3 mm from the funnel. The spatial mode used the entire width of the camera sensor to determine the profile of the band in the course of its migration (Fig. 1D).
7
Figure 1: Experimental workbench for band broadening characterization. (A) Micrograph of the microfluidic chip with green and red arrows to depict the hydrodynamic and electrophoretic velocities, respectively. The yellow rectangle is the
field of view of the camera. (B) The graph sketches the temporal sequence of our experiments with a first phase of concentration at high pressure and high voltage. At time t0, video recording starts and the electric field is modulated to
start the separation phase. (C) The three fluorescence micrographs represent the dynamics of a single band as it migrates through the separation channel. (D) The graph represents the spatial intensity profile of one DNA band for eight
consecutive time points separated by 500 ms. The solid lines correspond to Gaussian fits.
In a first round of 36 DNA separation experiments, we used two bands of 600 and 1000 bp, and modulated the hydrodynamic pressure in the range of 2 to 5 bar, corresponding to average hydrodynamic velocities spanning 2.4 to 6 mm/s, while applying linear ramps in electric field starting from a maximum tension of 80 V, equivalently , down to 0 V (green curve of Fig. 2A). Fluorescence intensity was recorded in the temporal mode (blue dataset in Fig. 2A), and the peaks were automatically fitted with a Gaussian function (black curves in Fig. 2A). We used the resolution 38, which is the ratio of the distance between two consecutive peaks divided by their breadth (see Eq. (2)), to gauge the quality of the separations. The maximum resolution of 4.1 was obtained for a pressure of 3 bar and a slope of -7 V/s (Fig. 2B). The complete analytical process, which is reported in the plot of Fig. 2A, took 23 s including 10 s of pre-concentration in the funnel. Interestingly, the maximum resolution also corresponded to a sharp peak of the theoretical plate number for the 1000 bp band of 1.5 106 plates/m (Eq. (3) and Fig. 2C). This result therefore showed
8
that band broadening should be minimized for optimal DNA separation, and in turn motivated our study on dispersion in electrohydrodynamic migration.
Figure 2: µLAS separation of 600 and 1000 bp bands. (A) The plot reports DNA electrohydrodynamic separation using a constant pressure drop of 3 bar and an electric field that decreases linearly over time starting from 80 V (green line). The blue dataset represents fluorescence intensity, as measured after 1.3 mm of migration in the separation channel. The two bands are fitted with Gaussian functions (solid black line). (B) The contour plot shows the resolution of the separation as a function of pressure drop and absolute value of the voltage slope. (C) The theoretical plate number for the 1000 bp band is
reported as a function of pressure drop and absolute value of the voltage slope.
Diffusion in the electrophoretic and hydrodynamic regimes
As a starting point, we assayed the diffusion coefficient in the reference regime of free diffusion using the 600 bp DNA as probe. These experiments started with a phase of concentration using a pressure of 2 bar and a tension of 150 V during 10 s, which enabled us to form a band of FWHM ~55 µm in the funnel region (Supplementary Fig. S1). Electrohydrodynamic actuation was then turned off, and the dispersion of the band was monitored during 60 s. The band profile was fitted with a Gaussian function in order to extract its width and then determine the diffusion coefficient of µm2
/s using Eq. (1). This estimate appeared to be slightly larger, yet comparable to the prediction of Stokes-Einstein’s law of 0.04 µm2/s taking 200 nm for DNA hydrodynamic diameter (i.e., two Kuhn segments).
We then focused on diffusion with hydrodynamic actuation in the Taylor dispersion regime (Fig. 3A). We measured the breadth of the band for three different pressure drops of 2, 3, and 4 bar, which corresponded to average migration velocities of 1.7, 2.7, and 3.4 mm/s (not shown). increased with the flow velocity, and its amplitude of ~106 indicated that mixing was enhanced by hydrodynamics. The increase of the diffusion coefficient in the course of the migration showed that the steady state for the Taylor dispersion regime was not reached. This observation was in fact expected because the diffusion time in the vertical direction of tens of seconds was greater than
9
the migration time of ~1 s. Conversely, the Taylor dispersion would require an even distribution of molecules across the channel section, as obtained for a transverse diffusion time much shorter than the advection time. Nevertheless, we noted that the amplitude of the normalized dispersion coefficient predicted by the Taylor model (Eq. (6)) of ~107 for a flow velocity of 2 mm/s was consistent and slightly larger than our measurements.
Figure 3: Diffusion in hydrodynamics and electrophoresis. The normalized diffusion coefficient of a 600 bp DNA band is plotted as a function its position along the separation channel for three different pressure settings (A) or voltage settings
(B).
We then performed the same experiment using electrophoretic actuation setting the tension to 25, 50 and 100 V, which corresponded to migration velocities of 0.12, 0.25 and 0.60 mm/s (not shown). We noted that (i) the normalized electrophoretic dispersion coefficient was much greater than 1 and in the range of 3,000 to 40,000, and (ii) increased with DNA electrophoretic velocity (Fig. 3B). This onset in dispersion was qualitatively consistent with the process of band broadening in gel electrophoresis, which is characterized by a power-law variation of the diffusion coefficient with the electric field associated to an exponent of 1.5 at high electric field 2,34. Indeed, using the plateau value of the normalized diffusion coefficient in Fig. 3, we measured a power-law scaling exponent of 1.47 for the diffusion vs. electric field response (Supplementary Fig. S2). Additional mechanisms, including e.g. Joule heating, may be invoked to account for electrophoretic band broadening, but they are not the scope of the current study. Rather, our comparison of band broadening in electrophoresis, hydrodynamics, and free-diffusion showed a diffusion coefficient that spanned more than six decades, suggesting the existence of a broad parameter space domain for diffusion in electrohydrodynamic migration.
10 Diffusion with constant electro-hydrodynamic actuation
Figure 4: Electrohydrodynamic diffusion with constant actuation settings. (A) The plot in the left shows the diffusion coefficient normalized to as a function of the position of the band along the channel. The three graphs in the right correspond to raw datasets of the spatial intensity distribution of one DNA band imaged at two consecutive time points separated by 200 ms. Note that peak intensity increases with the pressure because the mass of DNA accumulated during the concentration phase builds up with the flow rate 19. (B) Same dataset as in (A) with a constant pressure and different settings for the voltage, as indicated in the legend. For the raw intensity distribution plots in the right, we use the same
time interval of 200 ms for the two graphs at the top, but change it to 1 s for the lower one.
We then focused on electro-hydrodynamic migration and monitored the breadth of the 600 bp band after ~600 µm of migration in the separation channel. We first performed a set of experiments at a constant electric field associated to a voltage of 20 V (equivalently ) after a concentration phase of 10 s at 150 V. The pressure was modulated in the range of 1, 2 and 3 bar, equivalently the average migration velocity was 0.8, 1.7, and 2.7 mm/s (Fig. 4A). We first
11
measured that the speed of the DNA band of 0.36, 0.66 to 1.04 mm/s for the three pressure
settings, and noticed that the ratio decreased from 0.45 to 0.38 as the flow rate increased. This result was explained by the onset of the viscoelastic transverse force with (Eq. (7)), which enhanced the degree of confinement of the molecules near the walls. On the contrary, the normalized diffusion coefficient appeared to be roughly constant and equal to 105 for the three pressure settings. This value was bounded between our electrophoretic and hydrodynamic measurements of 103 and 106, respectively. Furthermore, the constant value of the diffusion coefficient was in excellent agreement with the prediction of our model of electrohydrodynamic migration (Eq. (11)), in which band spreading is predominantly piloted by the electric field. Notably, in contrast to our measurements with hydrodynamic actuation (Fig. 3A), we measured a constant diffusion coefficient in space. This result implied that despite the use of hydrodynamic flow, the diffusive process was at steady-state. This result could be explained by the confinement of the molecules near the walls, which set valid conditions for the Taylor dispersion regime. Indeed, the migration time was on the order of 1 s for =1 mm and . The time scale of transverse diffusion is much shorter than with hydrodynamic actuation, because molecules are confined in a spatial region delimited between z=0 and (see definition in Eq. (8)). Taking the values of , , and at 2 bar and 20 V of 1.7,
0.7 and 0.1 mm/s, respectively, we deduced that was ~0.2 µm from Eq. (9), and that the transverse diffusion time was on the order of tens of ms. We thus concluded the time scale of transverse fluctuation was much shorter than the migration time, and confirmed that Taylor dispersion regime was relevant to this study.
We finally measured the normalized diffusion coefficient at a constant pressure of 1 bar and using three different settings for the electric field associated to voltages of 10, 20, and 50 V (Fig. 4B). We again noted that the band velocity of 0.55, 0.36, and 0.15 mm/s decreased more than the mere subtraction of of 0.65, 0.6, and 0.45 mm/s, respectively, due to the build-up in transverse viscoelastic force with the electrophoretic actuation (see Eq. (7)). Furthermore, as in the previous experiment, the diffusion coefficient was roughly stationary in space, but contrariwise it appeared to change dramatically with the electric field. It was indeed divided by a factor of 18 from 3.3 105 down to 1.8 104 as we set the voltage to 10 and 50 V, confirming the strong dependence of the diffusion coefficient with the electrophoretic force predicted by Eq. (11). More quantitatively, we measured the power law scaling exponent of the diffusion coefficient vs. electrophoretic velocity of ~-1.6, and confirmed its qualitative agreement with the exponent -2 derived from our model. Consequently, our data corroborated our analytical model of diffusion during electrohydrodynamic migration, and also showed that the band dispersion was tunable and controlled by the electric field.
12
Because separation experiments were carried out with an electric field that decreased linearly with time (Fig. 2), we finally assayed band broadening by applying different ramps of electric field spanning -10 to -5 V/s. In these settings, the diffusion coefficient varied in the time course of the migration, so we chose to report the breadth of the band after 1.3 mm of migration (Fig. 5). The band width was 3 times narrower for a slope of -10 V/s as compared to -5 V/s with a constant hydrodynamic velocity of (Fig. 5A). Conversely, changing the hydrodynamic velocities by three-fold for a given slope of -6.5 V/s marginally changed the band breadth (Fig. 5B). This data generally confirmed that diffusion was primarily controlled by the electric field and marginally by the flow velocity, as studied in the previous section (Fig. 4). This statement was strengthened by solving numerically the breadth of the band. Indeed, the migration velocity (Eq. (9)) and diffusion coefficient (Eq. (11)) could be extracted from the model, and then integrated to obtain the solution of Fick equation (Eq. (5); see details in Supplementary Material). The resulting data was consistent with our data, as shown by the dashed line in Fig. 5A and 5B, thereby comforting our comprehension of dispersion during viscoelastic electrohydrodynamic migration. From an analytical perspective, this study also showed that a rapid decrease of the electric field was more suitable to reduce band broadening.
Figure 5: Electrohydrodynamic diffusion with a linear ramp in electric field. (A) The plot shows the FWHM of the 600 bp band after 1.3 mm of migration using four slopes for the electric field and setting the flow velocity set to 1.5 mm/s. The dashed line corresponds to the numerical solution of our model, which is described in Supplementary Material. (B) The plot
represents the FWHM of the 600 bp band for a given slope of -6.5 V/s and three pressure settings, together with the prediction of the model.
Comparison of the electric actuation strategies
We finally wished to compare band broadening using constant or temporally-variable electric fields. Our thrust was to (i) identify optimal actuation strategies for the reduction of dispersion during
13
separation experiments, and (ii) recapitulate the DNA separation data shown in Fig. 2. We characterized the profile of the 600 bp band after 1 mm of migration with four actuation settings based on electrohydrodynamics or hydrodynamics (Fig. 6). Migration at 2 bar was associated to a velocity of in the separation channel (green dataset in Fig. 6). Spreading in this situation was expectedly maximal, as inferred from the width of the band of ~500 µm after 1 s. We then used a constant electric field associated to a voltage of 20 V (equivalently , dark blue dataset in Fig. 6). The use of a constant electric field slowed down the migration that was characterized by a velocity of , as well as narrowed down the band width to ~110 µm. Notably, the
asymmetry of the band profile with these actuation settings was due to the inhomogeneous boundary conditions near the lateral walls of the rectangular separation channels (Supplementary Fig. S3).
We subsequently assayed band broadening with an electric field variable over time using a sharp slope of -15 V/s starting from a voltage of 150 V (cyan dataset in Fig. 6). The convection over a distance of 1 mm took 11 s. Yet, given the slope of 15 V/s, the electric field was null during the last second of the migration, accounting for the rapid hydrodynamic-driven migration of the band during the last 1.5 s (the band travelled over ~600 µm travelled in 1.5 s vs. 200 µm using a constant electric field). Interestingly, whereas the band profile was peaked after 9.5 s with a FWHM of 95 µm, the prevalence of hydrodynamics rapidly broadened up its width to ~300 µm after 11 s. This observation clarified our separation data shown in Fig. 2, and more specifically the sharp dependence of the theoretical plate number with the slope of the electric field. Indeed, as shown in Fig. 2A, optimal separations were obtained for the concomitant passage of the band in front of the detector and vanishing of the electric field. Given that band broadening decreased as the slope of the electric field increased (Fig. 5A), separation optimization appeared to be a trade-off between the sharpest slope and a non-vanishing electric field as the band reached the detector.
Finally, we aimed to show that electrohydrodynamic actuation enabled to finely control band broadening. We chose to use the same linear slope of 15 V/s and stopped it at 20 V in order to maintain transverse viscoelastic forces throughout the migration (purple dataset in Fig. 6). Note that this strategy was already tested successfully for high MW DNA separation in capillary format 18. The passage time was significantly expanded to 16 s, corresponding to a lag of ~8 s with a sharp decrease of the electric field and slow migration, followed by 8 s of migration under constant electrohydrodynamic settings (as in the dark blue dataset). The migration velocity in front of the detector was expectedly similar to that measured with a constant electric field (compare purple and dark blue datasets). Interestingly, this actuation strategy yielded the sharpest band after 1 mm of migration with a FWHM of 79 µm, i.e. an increase of 24 µm compared to the initial breadth of 55 µm during the concentration phase (see calibration of ). The comparison of the dark blue and purple datasets also showed that the broadening of the band during the last 1.5 s was comparable with or without slope, in agreement with the fact that electrohydrodynamic actuation is identical during this
14
time period. Altogether, this experiment demonstrated that the temporal control over the electric field provided an efficient solution to tune and reduce band broadening during electrohydrodynamic migration.
Figure 6: Control of band broadening in electrohydrodynamic migration. The four plots represent the spatial distribution of a 600 bp DNA band in the course of its migration with hydrodynamic actuation associated to (green dataset) or electrohydrodynamic actuation with a constant electric field of 20 V ( , blue dataset) or linear slope of -15 V/s starting from 150 to 0 V (cyan dataset) and a linear slope of -15 V/s from 150 to 20 V (purple dataset). In
each graph, two consecutive profiles are reported with their respective times noted in inset. The number in bold corresponds to the FWHM of the band after ~1 mm of migration.
CONCLUSION
In this study, we characterized band broadening in electrohydrodynamic DNA migration and confronted our data to a model of diffusion based on Taylor-type arguments. Our key findings are that dispersion is mainly controlled by the electric field and in consequence that fine tuning of the electric
15
field over time enables the reduction of band broadening. This data also provides hints to a rational explanation of optimal conditions for DNA separation experiments. Taken collectively, these results therefore contribute to enhancing the performances of DNA separation platforms based on electrohydrodynamic actuation. Future lines of research include the integration of a DNA migration model with that of band dispersion so as to obtain a complete in silico toolbox that can be tested and validated for additional optimizations. Accordingly, whether or not a linear variation of the electric field over time is an optimal strategy for band broadening minimization remains to be elucidated. It should also be clarified whether this model can be adapted to other types of targets in the form of single stranded nucleic acids, e.g. RNA, or particles. In the latter case, many studies have addressed the physics of particle focusing in Poiseuille flows 40,41, and recent interest has emerged for micro-organism separation 42, but dispersion remains to be studied and modelled, potentially with the same types of arguments based on the Taylor model.
BIBLIOGRAPHY
(1) Duke, T.; Viovy, J.-L.; Semenov, A. N. Electrophoretic Mobility of DNA in Gels. I. New Biased Reptation Theory Including Fluctuations. Biopolym. Orig. Res. Biomol. 1994, 34 (2), 239–247. (2) Slater, G. W.; Mayer, P.; Grossman, P. D. Diffusion, Joule Heating, and Band Broadening in
Capillary Gel Electrophoresis of DNA. Electrophoresis 1995, 16 (1), 75–83. https://doi.org/10.1002/elps.1150160114.
(3) Slater, G. W. Theory of Band Broadening for DNA Gel Electrophoresis and Sequencing.
Electrophoresis 1993, 14 (1), 1–7.
(4) Slater, G. W.; Noolandi, J. New Biased-Reptation Model for Charged Polymers. Phys. Rev. Lett.
1985, 55 (15), 1579.
(5) Lumpkin, O. J.; Zimm, B. H. Mobility of DNA in Gel Electrophoresis. Biopolym. Orig. Res.
Biomol. 1982, 21 (11), 2315–2316.
(6) Lerman, L. S.; Frisch, H. L. Why Does the Electrophoretic Mobility of DNA in Gels Vary with the Length of the Molecule? Biopolym. Orig. Res. Biomol. 1982, 21 (5), 995–997.
(7) Viovy, J. L. Electrophoresis of DNA and Other Polyelectrolytes: Physical Machanisms. Rev Mod
Phys 2000, 72, 813–872.
(8) Dorfman, K. D. DNA Electrophoresis in Microfabricated Devices. Rev. Mod. Phys. 2010, 82, 2903–2947.
(9) Guttman, A. Gel and Polymer-Solution Mediated Separation of Biopolymers by Capillary Electrophoresis. J. Chromatogr. Sci. 2003, 41 (9), 449–459.
https://doi.org/10.1093/chromsci/41.9.449.
(10) Albarghouthi, M. N.; Barron, A. E. Polymeric Matrices for DNA Sequencing by Capillary Electrophoresis. Electrophoresis 2000, 21, 4096–4111.
(11) Dovichi, N. J.; Zhang, J. DNA Sequencing by Capillary Array Electrophoresis. Methods Mol.
Biol. Clifton NJ 2001, 167, 225–239. https://doi.org/10.1385/1-59259-113-2:225.
(12) Wang, X.; Liu, L.; Guo, G.; Wang, W.; Liu, S.; Pu, Q.; Dasgupta, P. K. Resolving DNA in Free Solution. TrAC Trends Anal. Chem. 2012, 35, 122–134.
(13) Liu, K. J.; Rane, T. D.; Zhang, Y.; Wang, T.-H. Single-Molecule Analysis Enables Free Solution Hydrodynamic Separation Using Yoctomole Levels of DNA. JACS 2012, 133, 6898–6901. (14) Duan, L.; Yobas, L. On-Chip Hydrodynamic Chromatography of DNA through
16
(15) Pennathur, S.; Baldessari, F.; Santiago, J. G.; Kattah, M. G.; Steinman, J. B.; Utz, P. J. Free-Solution Oligonucleotide Separation in Nanoscale Channels. Anal. Chem. 2007, 79 (21), 8316– 8322.
(16) Zheng, J.; Yeung, E. S. Anomalous Radial Migration of Single DNA Molecules in Capillary Electrophoresis. Anal. Chem. 2002, 74 (17), 4536–4547. https://doi.org/10.1021/ac0257344. (17) Zheng, J.; Yeung, E. S. Mechanism for the Separation of Large Molecules Based on Radial
Migration in Capillary Electrophoresis. Anal. Chem. 2003, 75 (15), 3675–3680. https://doi.org/10.1021/ac034430u.
(18) Milon, N.; Chantry-Darmon, C.; Satge, C.; Fustier, M.-A.; Cauet, S.; Moreau, S.; Callot, C.; Bellec, A.; Gabrieli, T.; Saïas, L. ΜLAS Technology for DNA Isolation Coupled to Cas9-Assisted Targeting for Sequencing and Assembly of a 30 Kb Region in Plant Genome. Nucleic
Acids Res. 2019, 47 (15), 8050–8060.
(19) Ranchon, H.; Malbec, R.; Picot, V.; Boutonnet, A.; Terrapanich, P.; Joseph, P.; Leïchlé, T.; Bancaud, A. DNA Separation and Enrichment Using Electro-Hydrodynamic Bidirectional Flows in Viscoelastic Liquids. Lab. Chip 2016, 16 (7), 1243–1253. https://doi.org/10.1039/c5lc01465d. (20) Chami, B.; Socol, M.; Manghi, M.; Bancaud, A. Modeling of DNA Transport in Viscoelastic
Electro-Hydrodynamic Flows for Enhanced Size Separation. Soft Matter 2018, 14 (24), 5069– 5079.
(21) Butler, J. E.; Usta, O. B.; Kekre, R.; Ladd, A. J. C. Kinetic Theory of a Confined Polymer Driven by an External Force and Pressure-Driven Flow. Phys. Fluids 2007, 19, 113101. (22) Lee, E. F.; Koch, D. L.; Joo, Y. L. Cross-Stream Forces and Velocities of Fixed and Freely
Suspended Particles in Viscoelastic Poiseuille Flow: Perturbation and Numerical Analyses. J.
Non-Newton. Fluid Mech. 2010, 165, 1309–1327.
(23) Socol, M.; Ranchon, H.; Chami, B.; Lesage, A.; Victor, J.-M.; Manghi, M.; Bancaud, A. Contraction and Tumbling Dynamics of DNA in Shear Flows under Confinement Induced by Transverse Viscoelastic Forces. Macromolecules 2019, 52, 1843–1852.
(24) Montes, R. J.; Ladd, A. J.; Butler, J. E. Transverse Migration and Microfluidic Concentration of DNA Using Newtonian Buffers. Biomicrofluidics 2019, 13 (4), 044104.
(25) Arca, M.; Ladd, A. J.; Butler, J. E. Electro-Hydrodynamic Concentration of Genomic Length DNA. Soft Matter 2016, 12 (33), 6975–6984.
(26) Montes, R. J.; Butler, J. E.; Ladd, A. J. Trapping DNA with a High Throughput Microfluidic Device. Electrophoresis 2019, 40 (3), 437–446.
(27) Milon, N.; Fuentes Rojas, J.-L.; Castinel, A.; Bigot, L.; Bouwmans, G.; Baudelle, K.; Boutonnet, A.; Gibert, A.; Bouchez, O.; Donnadieu, C.; et al. A Tunable Filter for High Molecular Weight DNA Selection and Linked-Read Sequencing. Lab. Chip 2020, 20 (1), 175–184.
https://doi.org/10.1039/c9lc00965e.
(28) Andriamanampisoa, C.-L.; Bancaud, A.; Boutonnet-Rodat, A.; Didelot, A.; Fabre, J.; Fina, F.; Garlan, F.; Garrigou, S.; Gaudy, C.; Ginot, F. BIABooster: Online DNA Concentration and Size Profiling with a Limit of Detection of 10 Fg/ΜL and Application to High-Sensitivity
Characterization of Circulating Cell-Free DNA. Anal. Chem. 2018, 90 (6), 3766–3774.
(29) Malbec, R.; Chami, B.; Aeschbach, L.; Ruiz Buendía, G. A.; Socol, M.; Joseph, P.; Leïchlé, T.; Trofimenko, E.; Bancaud, A.; Dion, V. ΜLAS: Sizing of Expanded Trinucleotide Repeats with Femtomolar Sensitivity in Less than 5 Minutes. Sci. Rep. 2019, 9 (1), 23.
https://doi.org/10.1038/s41598-018-36632-5.
(30) Naillon, A.; de Loubens, C.; Chèvremont, W.; Rouze, S.; Leonetti, M.; Bodiguel, H. Dynamics of Particle Migration in Confined Viscoelastic Poiseuille Flows. Phys. Rev. Fluids 2019, 4 (5), 053301. https://doi.org/10.1103/PhysRevFluids.4.053301.
(31) Sambrook, J.; Fritsch, E. F.; Maniatis, T. Molecular Cloning: A Laboratory Manual.; Cold spring harbor laboratory press, 1989.
(32) Ranchon, H.; Picot, V.; Bancaud, A. Metrology of Confined Flows Using Wide Field Nanoparticle Velocimetry. Sci. Rep. 2015, 5. https://doi.org/10.1038/srep10128.
(33) Ettre, L. S. Nomenclature for Chromatography (IUPAC Recommendations 1993). Pure Appl.
17
(34) Tinland, B.; Pernodet, N.; Pluen, A. Band Broadening in Gel Electrophoresis: Scaling Laws for the Dispersion Coefficient Measured by FRAP. Biopolym. Orig. Res. Biomol. 1998, 46 (4), 201– 214.
(35) Taylor, G. I. Dispersion of Solute Matter in Solvant Flowing Slowly through a Tube. Proc R Soc
Lond. 1953, A219, 186–203.
(36) Aris, R. On the Dispersion of a Solute in a Fluid Flowing through a Tube. Proc R Soc Lond.
1956, A235, 67–77.
(37) Bancaud, A.; Wagner, G.; Dorfman, K. D.; Viovy, J. L. Measurement of the Surface Concentration for Bioassay Kinetics in Microchannels. Anal Chem 2005, 77, 833–839.
(38) Heller, C. Principles of DNA Separation with Capillary Electrophoresis. Electrophoresis 2001,
22 (4), 629–643.
(39) Katayama, Y.; Terauti, R. Brownian Motion of a Single Particle under Shear Flow. Eur. J. Phys.
1996, 17 (3), 136.
(40) D’Avino, G.; Greco, F.; Maffettone, P. L. Particle Migration Due to Viscoelasticity of the Suspending Liquid and Its Relevance in Microfluidic Devices. Annu. Rev. Fluid Mech. 2017, 49 (1), 341–360. https://doi.org/10.1146/annurev-fluid-010816-060150.
(41) Yuan, D.; Zhao, Q.; Yan, S.; Tang, S.-Y.; Alici, G.; Zhang, J.; Li, W. Recent Progress of Particle Migration in Viscoelastic Fluids. Lab. Chip 2018, 18 (4), 551–567.
https://doi.org/10.1039/C7LC01076A.
(42) Nam, J.; Jee, H.; Jang, W. S.; Yoon, J.; Park, B. G.; Lee, S. J.; Lim, C. S. Sheathless Shape-Based Separation of Candida Albicans Using a Viscoelastic Non-Newtonian Fluid.
18
Study of DNA band broadening in electrohydrodynamic
migration for separation optimization
Jeffrey Teilet
1, Quentin Martinez
1, (who else)
1, Aurélien Bancaud
1Supplementary Material
Width of the DNA band with an electric field linearly decreasing over time
Let us first evaluate the passage time
in front of the detector. For this, we invert the
migration velocity knowing the distance to the detector
:
(S1)
The electrohydrodynamic velocity is given by (Eq. (9)) and we define the slope of the
decrease of the electric field as :
(S2)
Integration of Eq. (S2) leads to the following polynomial equation, that can be solved
numerically to determine
:
(S3)
The width of the band is finally determined using Eq. (11) according to:
(S4)
These equations are solved numerically with the following set of parameters: k
B= 6 10
-23J/K; T = 300 K ; a = (N_bp/300)*lk = 200 nm ; = 0.5 10
-3s ; = 30 10
-319
m ; Lp = 1.3 mm ; U
h= 1.7 10
-3m/s ;
=0.05 mm. The value of U
0is computed from the
20
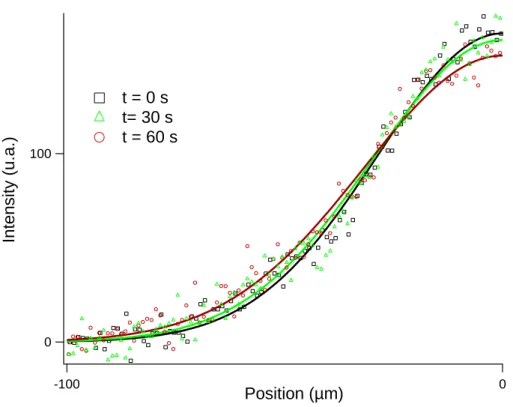
Figure S1: The plot presents the half-spatial intensity distribution of a 600 bp DNA band. Spreads is due to Brownian dispersion. Each dataset is fitted with a Gaussian function (solid lines).
Figure S2: The plot presents the steady value of the normalized electrophoretic diffusion coefficient, inferred from Fig. 3, as a function of the electric field. The solid line is a fit of the data associated to a power-law scaling response of 1.47, given
that the normalized diffusion coefficient is set to 1 at zero electric field.
100 0 Inten sity (u.a.) -100 0 Position (µm) t = 0 s t= 30 s t = 60 s 40 20 0 Normal iz ed di ffus ion c oeffi c ient x 10 3 100 50 0 Electric field (V)
21
Figure S3: The two fluorescence micrographs present the migration of a DNA band with a constant electric field of 20 V and a pressure of 2 bar. The time interval between the two images is 5 s. The band appears to “leak” near the side walls. This result is due to the boundary conditions for a rectangular channel of 10 µm in width and 2 µm in height. The flow velocity field is slowed down near the walls over a distance of ~1 µm. The electric field is thus comparatively higher in this region,