Crystallization Process Development and Spherical Agglomerates
for Pharmaceutical Processing Applications
by Justin Quon
B.S. Chemical Engineering B)
University of Delaware, 2007 -M. S. Chemical Engineering Practice
Massachusetts Institute of Technology, 2009
Submitted to the Department of Chemical Engineering in partial fulfillment of the requirements for the degree of
Doctor of Philosophy at the
MASSACHUSETTS INSTITUTE OF TECHNOLOGY
February 2013
@ Massachusetts Institute of Technology 2013. All rights reserved.
Signature of Author:
De artment of Chemical Engineering October 18, 2012
Certified by:
Bernhardt Trout
Professor of Chemical Engineering Thesi-upefvisor
Certified by: j- *I..
r. Alan Hatton
Professor of Chemical Engineering Thesis Supepzospr
Accepted by:
Patrick Doyle
Professor of Chemical Engineering Chairman, Committee for Graduate Students
Crystallization Process Development and Spherical Agglomerates
for Pharmaceutical Processing Applications
By
Justin Louie Quon
Submitted to the Chemical Engineering Department on October 18, 2012, in partial fulfillment of the requirements for the degree of
Doctor of Philosophy
ABSTRACT
The control of crystallization steps is essential in the production of many materials in the pharmaceutical, materials, and chemical industries. Additionally, due to increasing costs of research and development, reductions in manufacturing costs by moving from batch to continuous manufacturing are necessary to sustain profitability of the pharmaceutical industry. Two different projects were researched to progress towards this goal. The first was the demonstration of a continuous manufacturing platform. The second goal was the development of new crystallization techniques.
Two continuous crystallization processes were developed as part of a demonstration unit for continuous manufacturing of Aliskiren hemifumarate. The first process was an anti-solvent crystallization of an intermediate. The second process was a continuous reactive crystallization developed for the final product. The processes were able to crystallize the two compounds with both high yield (>90%) and purity (>99%). Population balance modeling was performed and experimental data were fit to the model to obtain kinetic parameters for crystal growth and nucleation for both systems. The models were used to optimize crystal purity and yield of the products.
In addition, this thesis describes two separate projects involving spherical agglomerates. In the first study, acetaminophen was shown to crystallize significantly faster in the presence of spherical agglomerates of lactose than single crystal lactose. An epitaxy study and molecular dynamics simulations showed that the (14T)/(001) pairing of faces showed coincident lattice matching and favorable energy interaction. Maximizing the number of substrate faces available for interaction increases the chance for a lattice match between the substrate and the crystallizing material which can be useful for controlling and increasing nucleation kinetics.
Finally, water-in-oil emulsions were used to make composite spherical agglomerates with two components: a heterosurface, and a target compound that does not typically crystallize as spherical agglomerates on its own. The generated composite agglomerates were relatively monodisperse and were characterized using optical microscopy, scanning electron microscopy, x-ray powder diffraction, and differential scanning calorimetry. This technique could potentially be applied to other hydrophilic compounds, in particular water-soluble pharmaceuticals
compounds, in order to change crystal morphology to spherical agglomerates in order to simplify downstream processing.
Thesis Supervisors:
Bernhardt Trout
Title: Professor of Chemical Engineering
T. Alan Hatton
ACKNOWLEDGEMENTS
I've had a great time at MIT over the last 5+ years at the Chemical Engineering Department and
I wouldn't have made it without help and support from a number of people.
First and foremost I want to thank my thesis advisors Prof. Bernhardt Trout and Prof. Alan Hatton. Without their guidance and advice I would have struggled much more with research and to finish my Ph.D. than I did. I also want to thank my thesis committee members, Prof. Allan Myerson and Prof. Klavs Jensen for all of their help throughout the past few years.
I would like to thank my main collaborators throughout my Ph.D.: Dr. Keith Chadwick, Dr.
Haitao Zhang, and Dr. Geoffrey Wood. Keith taught me so much about nucleation theory and solid state characterization, and really helped me with the heterogeneous nucleation projects. Without Haitao's contributions we probably never would have finished the red-line project. And without Geoff, we never would have finished the molecular dynamics simulations for the spherical agglomerates projects.
I also want to thank the Hatton, Trout, and Myerson groups, and the Redline team for all of their
discussions and comments throughout the years. In particular, I want to thank Jie, Eve, Blair, Kitae, Andy, Nate, Mike, Patrick, and Jose for their friendship and camaraderie.
I wouldn't have survived the past few years without the support of both friends and family. I
want to thank Byron, Stephen, Josh, Adel, Kay, Jaisree, Bradley, and Irene for always being there when I needed a friend. Finally, I want to thank my parents Check and Wailan, my siblings Nicole, Toshio, Daniel, and Denise, and my girlfriend Amanda for their love and patience.
Table of Contents
A BSTRA CT... 3 A CKN O W LED GEM EN TS ... 5 List of Figures...8 List of Tables ... 11 1. IN TRODU CTION ... 131.1. N eed for Continuous M anufacturing ... 13
1.2. Crystallization Background... 13
1.3. Continuous Crystallization... 15
1.4. Spherical agglomerates as surfaces for heterogeneous nucleation... 17
1.5. Com posite spherical agglom erates... 19
2. EXPERIM EN TA L ... 21
2.1. M aterials ... 21
2.2. A nalytical Techniques...21
2.3. Crystallization of A liskiren Boc-base ... 22
2.4. Crystallization of A liskiren Hem ifum arate ... 24
2.5. Equilibrium Im purity D istribution Coefficients...25
2.6. Population Balance M odeling... 27
2.7. Spherical Particle G eneration... 31
2.8. N ucleation K inetics M easurem ents ... 32
2.9. EpiCalc Calculations...33
2.10. M olecular Dynam ics Sim ulations ... 33
2.11. Com posite spherical agglom erate generation ... 37
3. CRY STALLIZA TION OF A LISKIREN BO C-BA SE ... 38
3.1. Introduction... 38
3.2. Process D evelopm ent... 38
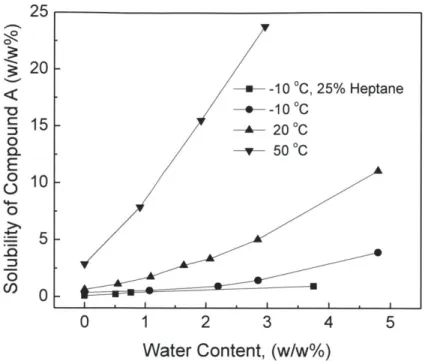
3.2.1. Influence of w ater on the crystallization process of C 1... 38
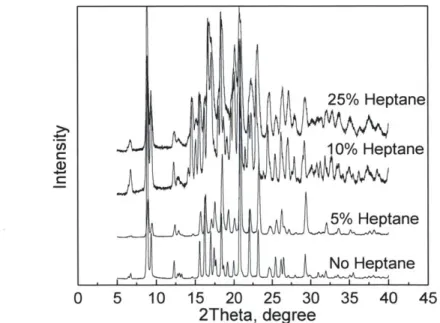
3.2.2. Influence of anti-solvent on crystal properties... 40
3.2.3. Evolution of continuous crystallization process. ... 44
3.3. M odeling results...47
3.3.1. Experim ents to D eterm ine D istribution Coefficients... 47
3.3.3. Effect of Process Conditions on Crystal Purity and Y ield ... 53
3.4. Conclusions...56
4. CRYSTALLIZATION OF ALISKIREN HEMIFUMARATE... 58
4.1. Introduction... 58
4.2. Process developm ent...58
4.3. Technical Challenges and crystallization results ... 60
4.4. M odeling results...62
4.4.1. Experim ents to determ ine equilibrium Distribution Coefficients ... 62
4.4.2. M athem atical M odeling and Param eter Fitting... 63
4.4.3. Effect of Process Conditions on Crystal Purity and Y ield ... 66
4.5. Conclusions...71
5. TEMPLATED NUCLEATION ON SPHERICAL AGGLOMERATES ... 72
5.1. Introduction...72
5.2. Generation of Spherical Agglomerates ... 72
X -ray pow der diffraction characterization... 74
5.3. N ucleation Induction Tim e ... 76
5.4. Epitaxy Study w ith EpiCalc ... 79
5.5. M olecular Dynam ics Sim ulations... 80
5.6. Conclusions...85
6. CRYSTALLIZATION AND CHARACTERIZATION OF COMPOSITE SPHERICAL A GG LOM ERATES ... 87
6.1. Introduction...87
6.2. Single Com ponent Spherical Agglom erates ... 87
6.3. Com posite Spherical Agglom erates... 91
6.4. XRPD characterization of com posite spherical agglom erates ... 94
6.5. D SC Characterization of com posite spherical agglom erates ... 96
6.6. Closing ... 97
6.7. Conclusions...97
7. CON CLU SION S AN D FU TURE W ORK ... 99
7.1. Conclusions...99
7.2. Future outlook...100
List of Figures
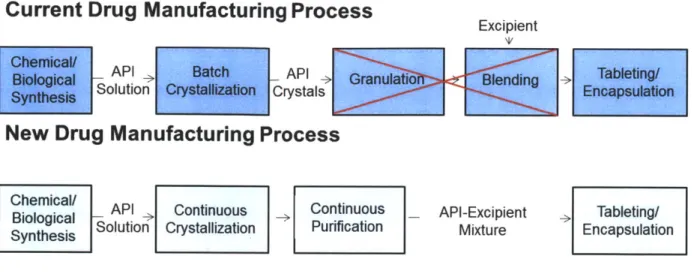
Figure 1-1: Flow chart of current and proposed drug manufacturing process ... 15
Figure 2-1: Schematic Diagram of Continuous Crystallization Apparatus for C2 ... 23
Figure 2-2: Continuous Crystallization Apparatus for Aliskiren Hemifumarate ... 24
Figure 2-3: Crystal slabs of lactose and mannitol with overlayers of AAP were simulated using the basic geometries shown. The potential energy as a function of azimuthal angle (<D) between crystal vectors al and b 1 were produced by averaging energies from short low-temperature molecular dynamics simulations. ... 3 5 Figure 2-4: Schematic of composite spherical agglomerate generation. Emulsion of water containing heterosurface (lactose) and template (NaCl) is placed into dodecane and stirred. Emulsion is heated to evaporate water. The heterosurface crystallizes first, templating nucleation of the target molecule... 37
Figure 3-1: C1 solubility versus water content in the organic phase v ... 39
Figure 3-2: X-ray diffraction of C1 crystallized in EtOAc with different heptane content ... 40
Figure 3-3: Microscope images of C1 crystallized in batch with 25% heptane... 41
Figure 3-4: XRPD of Cl crystallized with anti-solvent feeding at the first stage ... 41
Figure 3-5: Microscope images of Cl with anti-solvent feeding at the first stage ... 42
Figure 3-6: XRPD of C2 crystallized with anti-solvent feeding at the second stage...42
Figure 3-7: Microscope images of Cl with anti-solvent feeding at the second stage...43
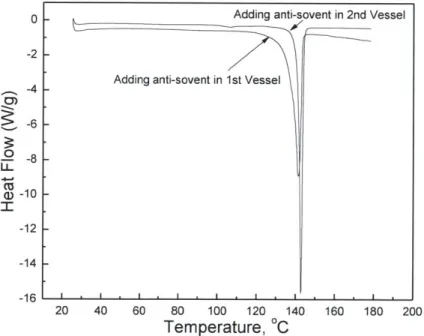
Figure 3-8: Comparison of DSC curves of the final products of C1 crystallization...43
Figure 3-9: Temperature versus time in the two stages ... 44
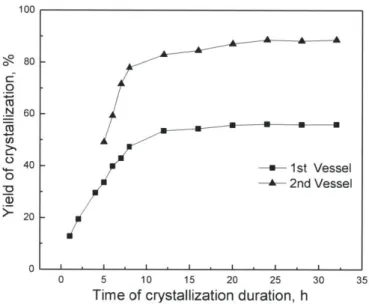
Figure 3-10: Yield evolution in the two stages during crystallization startup ... 45
Figure 3-11: CLD evolution in first stage ... 45
Figure 3-12: CLD evolution in second stage ... 46
Figure 3-13: Microscope images of the crystals at different locations in 2nd vessel ... 47
Figure 3-14: Distribution Coefficients as a function of purity of the starting solution...48
Figure 3-15: Predicted and experimental CLD for CI continuous crystallization... 50
Figure 3-16: Predicted and experimental CLD for Cl continuous crystallization for model validation .... 52
Figure 3-17: Effect of temperature of stage 1 & 2 on process yield ... 53
Figure 3-18: Effect of temperature of stage 1 & 2 on crystal purity...54
Figure 3-19: Effect of residence time of stage 1 & 2 on crystal purity...55
Figure 3-20: Effect of residence time of stage 1 & 2 on process yield...55
Figure 3-21: Purity of the crystals as a function of process yield... 56
Figure 4-1: Solubility of C3 as a function of ethanol solvent content ... 59
Figure 4-2: Solubility of C3 at 95/5 (w/w%) ethyl acetate/ethanol solvent composition ... 60
Figure 4-3: Optical Microscope picture of crystallized Aliskiren Hemifumarate ... 62
Figure 4-4: XRD pattern of crystallized product ... 62
Figure 4-5: Distribution coefficients for Aliskiren Hemifumarate ... 63
Figure 4-7: Effect of temperature of stage 1 and 2 on crystal purity ... 67
Figure 4-8: Effect of temperature of stage 1 and 2 on process yield ... 68
Figure 4-9: Effect of residence time of stages 1 and 2 on crystal purity... 69
Figure 4-10: Effect of residence time of stages I and 2 on process yield...70
Figure 4-11: Purity of crystals as a function of process yield...70
Figure 5-1: Optical microscopy image (left) and SEM image (right) of Triclinic Lactose Spherical Agglomerates. Individual crystals comprising the spherical agglomerates are on the nanometer scale in len g th ... 7 3 Figure 5-2: Optical microscope image (left) and SEM image (right) of p-Mannitol Spherical Agglomerates. Crystals comprising the spherical agglomerates are on the order of nanometers in length. ... 7 3 Figure 5-3: SEM image of single crystals of triclinic lactose (left) and beta mannitol (right). Morphology of the lactose is significantly different than that of the single crystals comprising the spherical agglomerates. Single crystals of mannitol are often large ... 74
Figure 5-4: XRPD data for Mannitol. The diffraction patterns for the spherical and powder D-mannitol are nearly identical and match up almost perfectly with the calculated powder pattern for beta mannitol 75 Figure 5-5: XRPD data for Lactose. Diffraction patterns for the spherical and powder lactose have some significant differences. Additional peaks in spherical lactose correspond to peaks in the triclinic lactose calculated pow der pattern ... 76
Figure 5-6: Plot of the log of the probability that an AAP crystallization event would not occur plotted versus time. Crystallizations of AAP in presence of spherical lactose show significantly faster kinetics than crystallizations in presence of powder lactose, while crystallizations in presence of spherical and pow der m annitol show sim ilar kinetics ... 78
Figure 5-7: Relative Average Interaction Energy per Molecule (kJ) Between Various Crystal Faces of Lactose and AAP as a Function of the Azimuthal Angle Between Lattice vectors...83
Figure 5-8: Average Number of Hydrogen Bonds Between Various Crystal Faces of Lactose and AAP as a Function of the Azimuthal Angle Between Lattice vectors.. ... 84
Figure 6-1: Images of attempts to make spherical agglomerates. A) Glycine B) Lactose C) Sodium Chloride D) Potassium Chloride E) M annitol... 89
Figure 6-2: XRPD Characterization of spherical agglomerates. Calculated patterns were compared to measured patterns of spherical agglomerates for lactose and mannitol (Figure 6-1 A) and glycine (Figure 6 -1 B ) ... 9 0 Figure 6-3: Optical microscope (A) and SEM (B) images of composite spherical agglomerates of Lactose and Sodium Chloride, optical microscope (C) and SEM (D) images of composite spherical agglomerates of Lactose and Potassium C hloride...92
Figure 6-4: Optical microscope (A) and SEM (B) images of composite spherical agglomerates of Glycine and Sodium Chloride. Optical microscope (C) and SEM (D) images of composite spherical agglomerates of G lycine and Potassium Chloride ... 93
Figure 6-5: Optical microscope (A) and SEM (B) images of composite spherical agglomerates of Glycine an d M an n ito l...94
Figure 6-6: XRPD characterization of composite particles of glycine and lactose with inorganic salts. Calculated powder patterns for KCl and NaCl are included for comparison...95
Figure 6-7: XRPD characterization of glycine/mannitol composite agglomerates. Black is spherical glycine, blue is spherical mannitol, red is composite agglomerates of glycine amd mannitol ... 95
Figure 6-8: DSC characterization of glycine/mannitol composite agglomerates. Melting curves for
List of Tables
Table 2-1: Face Pairings Between AAP and Lactose and Mannitol Investigated Using Molecular
Dynam ics Sim ulations in the Present Study ... 34
Table 3-1: Process conditions for estimation of nucleation and crystal growth kinetics ... 49
Table 3-2: Mean crystal size (volume based) in stage 1 and 2 ... 50
Table 3-3: Estimated nucleation and crystal growth kinetic parameters ... 51
Table 4-1: Process conditions for estimation of nucleation and growth parameters ... 64
Table 4-2: Estimated nucleation and growth parameters ... 65
Table 5-1: Nucleation induction time (in minutes) for AAP crystallizations. Induction time for spherical triclinic lactose is I1x faster than for powder lactose. Induction times for powder and spherical mannitol are approxim ately the sam e ... 78
Table 5-2: Lattice parameters for faces of AAP and lactose showing coincident lattice matches, and the minimum V/VO value and the angle at which the minimum occurs ... 80
1. INTRODUCTION
1.1. Need for Continuous Manufacturing
The cost of manufacturing pharmaceuticals has becoming increasingly expensive over the
recent years. A study performed in 2003 by Dimasi showed the ever increasing cost of research
and development of new drugs, and showed that it increased significantly faster than the rate of
inflation, and faster than the rate of new drug discovery [1]. In addition, the increased prevalence
of generics companies has increased competition and reduced sales volumes for drug innovators
[2, 3]. Because of rising costs of discovery and research, once a drug has actually been
developed, reducing the production costs as much as possible is paramount to retaining
profitability. Manufacturing costs can account for up to 30% of the total cost of producing a
pharmaceutical product [3]. If this amount can be reduced significantly, the profitability of
producing drugs can be increased. Continuous manufacturing is seen as one of the leading ways
to decrease production costs while maintaining or even improving drug quality. Significant
research has already been done to develop new technologies that could be used to continuously
produce pharmaceutical products. This includes work studying new methods to perform
reactions [4-6], crystallizations [7, 8], and downstream processing [9-12]. Crystallizations in
particular are an area where significant progress can be made to improve downstream processing.
1.2. Crystallization Background
Crystallization is an important separation and purification process for a number of
products in a multitude of industries. Many manufacturing processes in industries such as
chemicals, foods, and pharmaceuticals include a crystallization step as either an intermediate
purification or final isolation step [13]. Crystallization processes are designed to obtain crystals
steps of pharmaceutical products, the control of crystal size, shape, and form is crucial as these
properties can influence downstream operations such as filtration, drying, and milling as well as
influence the physical and chemical properties such as dissolution rate and solubility [14, 15].
Additionally, purity and yield of the product are very important parameters, the prior to ensure
that the product meets specification, the latter to maximize production. Knowledge of the process
conditions required to fabricate crystals with controlled characteristics is critical during process
development.
Pharmaceutical crystallizations are typically performed in batch, using cooling, addition
of anti-solvent, and reaction to generate supersaturation. Although the methodologies for
developing these types of batch crystallization processes are reasonably well understood, there
are still significant issues with batch-to-batch variability which can lead to substantial issues in
the downstream processing of the isolated material [16-18]. There exists significant potential to
transform the entire industry by producing these products via continuous
manufacturing. Continuous manufacturing has the potential for increases in efficiency, flexibility,
and quality through the use of process analytical technology. Crystallization have been identified
as key elements in improving manufacturing in the chemical and pharmaceutical industries [19].
There are two major areas that need to be researched for the conversion of batch
processing to continuous. The first is to research ways to convert processes to continuous using
existing technology. The second is to develop new technologies and techniques to perform these
unit operations. Figure 1-1 shows a schematic of a current typical drug manufacturing process
Current Drug Manufacturing Process
Excipient
Chemical/
API Batch API lTableting
Solution CrysCrystals Encpsu
New Drug Manufacturing Process
Chemical/ API Continuous _ Continuous _ API-Excipient Tableting/
Biological So > >
Synthesis Solution Crystallization Purification Mixture Encapsulation
Figure 1-1: Flow chart of current and proposed drug manufacturing process
One major issue with continuous downstream processing is that performing unit operations with significant solids handling like continuous granulation, blending, and mixing can be difficult. In order to facilitate this process, removing these steps by performing crystallizations in which the final product is more amenable for downstream processing would be advantageous.
Both of these research projects have been studied and are presented in this thesis. Two continuous crystallizations processes were developed using existing MSMPR crystallizers. Additionally, evaporative emulsion crystallizations were performed to make spherical agglomerates for two purposes. The first aim was to make spherical agglomerates of excipients to use as surfaces for heterogeneous nucleation of API's. The second aim was to make composite spherical agglomerates which would be more amenable for direct processing.
1.3. Continuous Crystallization
The focus of the Novartis-MIT Center for Continuous Manufacturing is the development of new technologies that will allow continuous pharmaceutical manufacturing. One of the important milestones for the center has been the development of a demonstration unit for continuous manufacturing. This work describes the two continuous crystallizations that were developed as part of this demonstration unit.
The most common types of continuous crystallizers are mixed-suspension, mixed
product-removal (MSMPR) and plug-flow crystallizers. Models for both types developed by Randolph and Larson (1971) have been used extensively by various investigators for the simultaneous determination of nucleation and growth kinetics in crystallization systems [7, 18,
20-23]. Both MSMPR and plug-flow crystallizers have their advantages, but plug-flow
crystallizers are usually used for fast growing systems with low residence times [7]. The compounds used in this study are slow growing and thus have long residence times. For the system being studied, MSMPR crystallizers were found to be more appropriate. This paper investigates experimentally and through modeling the cascaded MSMPR multistage crystallization system developed to perform a continuous reactive crystallization.
Two different compounds were studied in this work. Both are crystallization steps from the manufacturing of Aliskiren Hemifumarate. Aliskiren Hemifumarate is a renin inhibitor approved for the treatment of hypertension. It was approved for sale by the FDA in 2007 and is sold under the trade names Tekturna and Rasilez. This API was chosen as the model compound because it was observed that there were many areas of the manufacturing process that could greatly benefit from switching from batch processing to continuous processing. One of the crystallizations studied is for an intermediate purification (Aliskiren boc-base), while the second crystallization is a simultaneous reaction and crystallization of the final active pharmaceutical ingredient (Aliskiren Hemifumarate). The batch processes for both of the crystallizations are
highly complex with high throughput times. The continuous crystallization systems described
herein are shown to significantly reduce the throughput time without compromising process yield or purity [24, 25].
1.4. Spherical agglomerates as surfaces for heterogeneous nucleation
One means for controlling such properties is through the use of heterogeneous nucleation.
Heterogeneous nucleation is nucleation in the presence of a surface or an interface. It has been used in conjunction with organic crystals, polymers, and self-assembled monolayers (SAMs) to
manipulate crystallographic orientation and to control the nucleation of different polymorphs
[26-3 1]. Heterogeneous nucleation can also significantly increase nucleation rates. It has been
shown that tuning specific chemistries on polymeric surfaces by modulating mesh sizes can
change the induction time of aspirin by 4 orders of magnitude [32-34]. In another study, Form I
of acetaminophen (AAP) crystallized in the presence of single crystals of a-lactose monohydrate
and D-mannitol was shown to nucleate approximately five times faster than AAP nucleated from
the bulk [35]. The reduction in induction time was due to a functional group match between AAP
and lactose and mannitol rather than a purely geometric lattice match - the substrate and AAP
having complementary functional groups allowed for significant hydrogen bonding at the
interface. This was demonstrated by crystallizing AAP in the presence of graphite, whose (100)
face shares a coincident lattice match with certain faces of Form I AAP. Although graphite
decreased the induction time by a factor of 2 when compared to bulk nucleation, graphite was
not as effective as a-lactose monohydrate or D-mannitol. These studies highlight the importance
of considering both lattice matching and molecular functionality when designing heterogeneous
crystallizations.
Although single crystal substrates have been shown to increase the nucleation rate of AAP, modifying the crystal morphology may further enhance nucleation kinetics. For example, Carter
et al. [14] and Bonafede et al. [15] demonstrated how the presence of two contact planes reduces
crystal faces through modulation of the crystal morphology could induce improved nucleation
behavior. One method of fabricating substrates with modified morphologies is to crystallize them
as spherical agglomerates. Spherical agglomerates of substrates tend to be composed of densely
packed single crystals [36, 37]. Scanning electron microscope images from different studies have
shown that spherical agglomerates have increased surface roughness compared with their
corresponding single crystals, and may also exhibit differences in their morphologies [36-39].
In the present study, we have explored how crystallizing certain substrates as spherical
agglomerates can alter their surface morphology which may lead to crystal faces being exposed
that are not present in the equilibrium single crystal morphology. The effect that these
differences in crystal morphology may have on heterogeneous nucleation kinetics was then
explored. Spherical agglomerates of triclinic lactose and D-mannitol were crystallized using a
previously developed evaporative water-in-oil emulsion technique [40]. The surface morphology
and diffraction patterns of the agglomerates were characterized using image analysis and X-ray
powder diffraction, respectively. If new peaks were present in the diffraction patterns of the
agglomerates they were assigned miller indices by comparing them to peaks from calculated
powder patterns. The effect of the morphology changes and newly available crystal faces on the
induction time of AAP was then measured. Lattice matching software (EpiCalc) and molecular
dynamics simulations were used to rationalize these effects in terms of epitaxial ordering and
favorable interactions between the substrate and AAP. Finally, with the discovery of new lattice
matches and chemistries on the surfaces of the agglomerates we are able to explain the
1.5. Composite spherical agglomerates
In addition to enhancing nucleation kinetics, spherical particles or agglomerates have a
number of physical properties that are beneficial for downstream processing. Some crystal
morphologies such as needles can adversely affect the downstream operations of filtration,
drying, and compression, and can also affect physical properties such as dissolution rate and
solubility. Many earlier studies have shown that spherical agglomerates of API's are easier to
filter, have better flowability, and often are more compatible for direct compression [36-38, 43,
44] than single crystals or powders. Much of the previous work on spherical crystallization or
agglomeration was based on the use of a 3-solvent system to enact agglomeration of crystals, as
described by Kawashima [39, 45-48]. Spherical particles of glycine have been made using
evaporation from monodisperse microemulsions [49]. Spherical particles have also been
obtained through the growth of crystalline agglomerates inside water-in-oil emulsion droplets
through the slow evaporation of the droplets to generate supersaturation of the dissolved
substance, allowing time for the nucleation and growth of these spherical agglomerates. This
technique has been used to prepare spherical agglomerates of glycine and glutamic acid
hydrochloride [40]. This approach did not work for all systems investigated, however; ephedrine
hydrochloride, for instance, crystallized in the continuous phase rather than in the droplets. In
other cases, nucleation occurred within the droplet, but as single crystals rather than as the
desired spherical agglomerates of small crystallites with their better dissolution properties. It
would be beneficial to develop a more robust, general method for generating spherical
agglomerates to expand the range of API's to this approach for the enhancement of processing
and physical properties may be applied; in this work, we show that heterogeneous nucleation
Heterogeneous nucleation is that which occurs in the presence of an interface or surface,
which can affect nucleation behavior significantly [26, 27, 30, 31, 50], and not in the bulk
solution. It has been shown that crystallization experiments performed in the presence of
polymeric surfaces with various chemistries can reduce the induction time for the nucleation of
aspirin and acetaminophen [32-34, 51]. In another study, acetaminophen crystals were shown to
nucleate significantly faster in the presence of both lactose and mannitol than when nucleated
homogeneously, attributed to extensive hydrogen bonding at these heterogeneous interfaces [35].
These studies demonstrate that by the selective choice of the surface and its properties,
nucleation kinetics can be enhanced significantly. We show here that it is possible to use
heterogeneous surfaces to modify the morphology of material crystallized inside emulsion
droplets.
Glycine (as demonstrated before) and lactose were readily crystallized as spherical
agglomerates and thus served as good heterosurfaces for the templating of D-Mannitol, sodium
chloride, and potassium chloride, which were identified as good targets for morphology
modification.. The resulting composite spherical agglomerates were characterized using multiple
analytical techniques. This work demonstrated that water-in-oil crystallizations with
heterosurfaces can be used to prepare spherical agglomerates of materials that otherwise would
2. EXPERIMENTAL
2.1. Materials
Mannitol, sodium chloride, potassium chloride, glycine, fumaric acid, dodecane, span 20,
span 80, hexadecyltrimethylammonium bromide, ethyl acetate, and hexane (all 99% or higher)
were purchased from Sigma Aldrich. a-Lactose monohydrate (99% pure) was purchased from
Emprove. Ethanol (200 proof) was purchased from VWR International. Deionized water was
produced using a Millipore Milli-Q system. Aliskiren lactone (Cl),
amino-dimethyl-propionamide, Aliskiren boc-base (C2), and Aliskiren free base (C3) were received from
Novartis. The Aliskiren free base was received dissolved in ethanol, so in order to get it into a
usable form, the ethanol was evaporated using a roto-vap, and the free base was re-suspended in
ethyl acetate.
2.2. Analytical Techniques
Focused beam reflectance measurement [FBRM] was used to detect nucleation and to
measure chord length distributions (CLD) of the solid product [52, 53]. The FBRM device was a
Lasentec S400 probe from Mettler Toledo, with a measurement range from 785 nm to 1000 pm.
X-ray powder diffraction (XRPD) patterns were recorded with a PANalytical X'Pert PRO
Theta/Theta Powder X-ray Diffraction System with a Cu tube and X'Celerator high-speed
detector. This technique was used to identify crystal forms, determine polymorphism, and
analyze crystallinity. Differential Scanning Calorimetry (DSC) was used to analyze crystallinity
of crystals and for compound identification. DSC measurements were performed using a Q5000
Crystal morphology was observed by a Zeiss Axiovert 200 optical microscope in
transmission mode with a differential interference contrast polarizer and magnification range
from 5x to 50x. Prior to collection of Scanning Electronic Microscope (SEM) images with a
JEOL 6060 SEM at a 5 kV operating voltage, the samples were sputter coated with a Quorum
Technologies SC7640 high resolution gold/palladium sputter coater. Concentration and purity
were measured using High Performance Liquid Chromatography (HPLC). Mother liquor
samples were taken using PTFE syringe filters with 0.2 iL pore size. An HPLC instrument
(Agilent Technologies 1200 Series) with a column Nucleosil 100-3 C18 (4.0 X 125 mm, 3 pm)
was utilized for measuring the concentration at 230 nm, using an Agilent 1200 Series UV
detector. Measuring conditions were flow rate: 1.0 mL/min, injection volume: 20 pL, and
temperature: 50 'C.
2.3. Crystallization of Aliskiren Boc-base
Multistage continuous crystallization experiments were carried out in a self-assembled
multistage crystallization system. Each stage was operated as a MSMPR crystallizer. The
experimental system consisted of two 50 milliliter (mL) glass jacketed crystallizers with
independent temperature control and overhead mechanical stirring. Feed solution containing C1
was continuously pumped into the first crystallizer using a peristaltic pump (flow rate range
0.006 - 600 mL/min, MasterFlex, provided by Cole-Parmer corporation). In this study, two
different configurations were studied. In the first configuration - Configuration A
-supersaturation was generated in the first vessel using cooling and -supersaturation was generated
in the second vessel using both cooling and anti-solvent addition. For Configuration B,
supersaturation was generated in the first vessel using both anti-solvent and cooling, and the
Figure 2-1. The suspension that was generated in the first crystallizer was transferred to the
second stage using a peristaltic pump. The temperature of both vessels was controlled +/- O.14C
with a NESLAB RTE Refrigerated Bath Circulator.
C2 solution Stage 1 Stage 2 Heptane Anti-solvent Stage 1 C2 solution Stage 2 Heptane Anti-solvent
Figure 2-1: Schematic Diagram of Continuous Crystallization Apparatus for C2
The concentrations of C1 and C2 in the feed material and mother liquor were measured
by high performance liquid chromatography (HPLC). Mother liquor samples were taken by
filtering slurry samples from each vessel using PTFE syringe filter with 0.2 pL pore size.
Anti-solvent cooling continuous crystallization experiments for C2 were performed using
the continuous crystallization apparatus described in Figure 2-1. The feed solution consisted of
EtOAc with 13% (m/m) C2 at room temperature, 2% (m/m) Cl, and 1% (m/m) impurities that
crystallizer at a flow rate 0.125 mL/min. The working volume of the first stage was 30 mL and
the residence time of each stage was set to 4 hours. The slurry in the first crystallizer was then
pumped into the second crystallizer. Concurrently an anti-solvent stream of heptane was added to
the vessel. The heptane flow rate was set such that it would comprise 25% (m/m) of the solvent
mass (0.036 mL/min). The temperatures of Stages 1 and 2 were -5"C, and -100C, respectively. The duration of the experiment was 33 hours (four total residence times). The concentration of
the mother liquor and the chord length distribution were both monitored over time. Once the
signals leveled out, steady state was reached.
2.4. Crystallization of Aliskiren Hemifumarate
A schematic of the continuous crystallization set-up used for experimentation can be seen
in Figure 2-2. The system has two 50 mL mixed suspension mixed product removal (MSMPR)
crystallizers in series. Each is jacketed for temperature control and has independent overhead
stirring. Material is pumped into and out of each vessel using peristaltic pumps.
C3
solution
25
0C
Vessel 1: 20
0C
Vessel 2: -10"C
Fumaric Acid
solution 70*C
In a typical experiment, ethyl acetate containing 6 w/w% Aliskiren free base was pumped
into the first vessel. Concurrently, an ethyl acetate / ethanol solution (50/50 w/w%) containing 5 w/w% fumaric acid was also pumped into the first vessel. The C1 - ethyl acetate mixture is
maintained at room temperature. The fumaric acid solution was kept separately at 70'C to solubilize the fumaric acid. A molar ratio of 0.58 moles fumaric acid to 1 mole free base was used to produce the hemifumarate salt. The slight excess was to ensure that all of the free base reacted with fumaric acid to form the hemifumarate. Though the free base is freely soluble in ethyl acetate, the hemifumarate salt is much less soluble and spontaneously nucleates. The temperature of the first stage of the crystallization is 20'C, and the slurry is then pumped into the second vessel which operates at -10'C. This second vessel is used for further nucleation and growth of the crystals. Each vessel has a 4 hours residence time. The temperature of each vessel was controlled to +/- 0.1 C with a NESLAB RTE Refrigerated Bath Circulator.
2.5. Equilibrium Impurity Distribution Coefficients
The distribution of the impurity between the solid and liquid phases at each stage of crystallization is determined by the Distribution Coefficient [8, 54], which can be also expressed
as: [54]
DC =
(1)
(c, /C
c,
A mass balance for the impurity over a stage
j
has terms for the impurity coming in (Cij.1, andMij.1 ), a term for the impurity going out in solution (Cij ), and a term for the impurity accumulated in the crystals (Mi,)
Where Ci.1, and Mij.1 are the concentrations of impurity in liquid and solid phase entering stage
j,
and Cij, and Mij are the concentrations of impurity in liquid and solid phase leaving stagej.
From the experimental data shown in Figure 8, the Distribution Coefficient at each stageis a function of the concentration of impurity, which can be expressed as follows:
DC =a CJ + +b (3)
Where a and b are experimental parameters.
Substituting equation (3) into (1) to eliminate DCj, and substituting into (2) yields a quadratic
expression, from which the concentration of impurity at stage
j
can be calculated:c 2 i-1b 1 - a
j
+Ci1 j(Ct'_1 + M1_ - C,] - bMAI ]+ CAl (C C_1 ± M 1_
)-
= 0 (4) CA,j CA,j_Finally, purity of the host compound is calculated as the mass faction of the host in the solid
phase
Mass of Product
Purity(%) = (
(Mass of Product + Mass of impurity)
In order to measure distribution coefficients, a sequence of crystallization experiments
was carried out. For the C1 crystallization, a series of anti-solvent and cooling crystallization
experiments was performed. Heptane was added to a saturated solution of Cl in EtOAc at 250C
in increments of 5% heptane by mass up to a total of 25% heptane. The solution was then cooled
to -100C in increments of 5'C. For C3, sufficient fumaric acid was added to react completely
with the freebase at 250C, and cooling crystallization experiments were subsequently performed
in 50C increments down to -1 00C. After each of these crystallization experiments, the crystallized
solids were separated by filtration and dried overnight. Samples of solids and mother liquor were
When impurities incorporate at small level into the crystal, the incorporation can be
characterized by a distribution coefficient which is defined as the ratio of impurity
concentrations to the host compound concentration in the solid phase divided by that ratio in the
liquid phase.
2.6. Population Balance Modeling
Final crystal properties including yield, purity, morphology, and particle size are important
for the success of a crystallization process. A model relating nucleation and crystal growth
kinetics to operating variables is necessary to evaluate the effect of operating conditions on all of
these properties. A model of the continuous crystallization process based on the simultaneous
solution of the Population Balance Equation (PBE) and Mass Balance Equation has been
developed [8]. The purpose of the model is to predict the crystal purity, yield, and size
distribution of the crystals obtained in the multistage cascaded continuous crystallization system
[13, 18, 21, 55, 56]. FBRM was employed to determine the particle size distribution for the
parameter estimation of the model in the current work. The crystals from both of the
crystallization processes described have needle-like morphology. Because FBRM does not
directly measure the particle size distribution, the particle size distributions from the model and
experimental were not precisely the same [13, 21]. Thus, the fitted growth and nucleation
parameters are not exactly correct values. The model, however, is still useful tool to study the
effects of operating conditions on the purity and yield. Other published work has used CLD
measurements from FBRM directly in modeling rather than converting it to a particle size
distribution first [8, 57, 58]. Equilibrium distribution coefficients were also included in the model
Assuming a clear feed stream into the first stage, the general population balance equations can be reduced to Gjirj r + nj =0 (6) dL 1(6 rdn(7 G2 12 2d2 + n2 = n (7) dL
Where L is the characteristic size of the crystal, n(L) is the number density of crystals per unit
volume of size between L and L+dL, G is the size-independent crystal growth rate, and r is the
mean residence time. These equations can be solved analytically using the boundary condition:
n(O)=no, where n0 is the crystal density of zero size nuclei. The analytical solution is
0 (- L)
n, = nj exp yj (8)
n2 =n2 2 2eXPG2T2 expL + no exp -exp (9)
IGIrI - G2 T2 .. GIrI G2T2_
The rate at which solute is lost from the solution phase is equal to the rate at which mass is
gained by the solid phase. Thus, a mass balance on the solute crystallized in each stage gives:
Co = C1 + MTi for stage 1,
And, C1 = C2 + MT2 for stage 2,
where Co, C1, C2 are the solute concentration at feed, stage 1, and 2 respectively, and MT1 , MT2 are the suspension densities at stage 1 and 2, which are calculated from the third moment of the
population density at each stage.
M =6k~p T2 n2(G2 2r2)4 + G
(Gr)
-(G22
(11)2 GI'rl - G21-2 _
where p is the solid density and k, is a volume shape factor.
The crystal growth rate and nucleation rate can be expressed as a function of
supersaturation in the form of empirical power-law equations (8), (9), and (10), where Gi and Bi
are crystal growth rate and nucleation rate at stage i respectively, Ci is the steady state
concentration at stage i, Cisat is the equilibrium concentration at stage i, T is the temperature, R is
the gas constant (8.314 J/mol-K), whereas kg, kgo, kgi, g, kb, and b are model parameters.
G g= kg ' s,' (12) C1 kg = kgo exp ( + (13) R(T + 273), B k ' sa(14) 0 B, n , = G , ( 1 5 )
Temperature-dependent solubilities of Aliskiren Hemifumarate in EtOAc/EtOH were measured
by HPLC.
Volume based distribution of the steady state CSD experimental data were converted to
population density data using the relationship
n A MM (16)
Where nexp is the experimental population density, AM is the mass based CSD (%), MT is the
slurry density, AL is the size range, k, is the volume shape factor, L is the characteristic size of
the crystal and p is the crystal density.
If the error is defined as the difference between the measured (experimental) and calculated
values of the crystal size distribution, then a least-squares optimization procedure to estimate the
kinetic parameters consists of finding the values of 6 that minimize the objective function V/(6)
defined as the sum of squares of the error, where 0 is the vector of model parameters, 0 kgo,
kgi, g, kb, b ]. The optimization problem is expressed as
mm
#stagesL max11(D() = e, - n(L)y (17)
01 0
subject to equations (4) to (10).
Thus, the population balance equations for each stage, as well as the mass balances and expressions for kinetics of crystallization are solved with initial values for the parameters 0, and the obtained crystal size distribution for each stage is compared to the experimental data. The value of the parameters 0 is then recalculated and the procedure is repeated until a minimum value for the sum of squares of the error is found. Typical assumptions include that the errors of each measurement are independent and are normally distributed with zero mean.
Once the optimal values for kinetics parameters are found, the crystal growth rates and nucleation rate at steady state are calculated for each stage, using equations (8), (9), and (10). The mass based mean size of the crystals can be estimated for each stage i from the third and fourth moments of the size distribution.
fL4ndL
(
, =(18)f
Ln dL0
Using the population density expressions for each stage (equations (4) to (5)) to solve the
integrals, crystal mean size is obtained as a function of mean residence times, crystal growth rate, and population density of nuclei for each stage.
L4,3 = 4GIrI (19)
4n2 (G2r2)5 +
4ni
I (Gi, ) - (G2r2 )5L4,3 = -- j-- (20)
n2o
(G2
2)4 + ni G r(Gir
)4 -(G2T2)42 21) 1Girl - G2r'2 IG
2.7. Spherical Particle Generation
Spherical agglomerates were generated by evaporative crystallization from water-in-oil
emulsions [40]. The lactose or D-mannitol was dissolved in 8 mL of water. The mass of each
compound depended on its respective solubility at 400C (0.25 g/mL lactose, 0.46 g/mL for
D-mannitol). The aqueous solution (the dispersed phase) was then added to 72 mL of dodecane
which served as the continuous phase. The mixture was stirred at 650 rpm at 700C to obtain a
stable emulsion. The emulsion was stabilized using 1 w/w% surfactant, a mixture of span 20 and
span 80 at a mass ratio of 3 to 7. CTAB was added as an additive to promote nucleation in the
emulsion system. Once the emulsion was stabilized (observed optically), the temperature was
raised to 800C to slowly evaporate the water. Samples were taken and analysed by optical
microscopy every 15 minutes to determine when crystallization was complete. Once
2.8. Nucleation Kinetics Measurements
Average nucleation induction time, r, was measured to determine the effect of spherical
morphology on the nucleation rate of AAP. The induction time is the time lag between the onset
of supersaturation and the occurrence of nucleation. - is a useful measure of how much a surface
aids nucleation because the value can be greatly reduced if the surface lowers the kinetic barrier
to nucleation [32]. Due to the stochastic nature of nucleation, a large number of identical
experiments were required in order to obtain a statistically significant result. Several assumptions
were made for this analysis. First, the detection of heterogeneous nucleation was the detection of
secondary nucleation of AAP - it was assumed the time between heterogeneous nucleation and
secondary nucleation occurring was negligible. Second, the time required for the system to reach
the desired supersaturation was assumed negligible in comparison to r. Finally, the growth rate
of acetaminophen was assumed to be much faster than the nucleation rate, such that the time
difference between nucleation and detection could be ignored.
Induction time data were collected using a RS 10 Clarity Solubility Station from Thermo
Fisher Scientific [59]. This method has been used in a number of other studies [33, 34]. A stock
solution of AAP in ethanol was prepared (232.75 g/kg, saturated at 300C). 1.5 mL aliquots were
then syringe filtered into an HPLC vial to remove any solid impurities. The vials were agitated
with a magnetic stir bar rotating at 700 rpm. The samples were then quench cooled to 15C
which resulted in a supersaturation (F) of 1.36. G = c*/ceq, where c* is the actual concentration
and ceq is the equilibrium concentration at a given temperature. For experiments with the
substrates, approximately 3 mg was added into each vial prior to the addition of the AAP/ethanol
2.9. EpiCalc Calculations
The interface between a substrate crystal face and an overlayer crystal face is defined by
7 parameters: a,, a2, a (describing the substrate), b1, b2,
p,
(describing the overlayer), and $.These parameters are shown in Figure 1. The parameters (a,, a2) and (b1, b2) are pairs of vectors
describing the 2-dimensional lattices of a crystal substrate and overlayer, respectively. The
parameters a and
p
are the angles between each pair of vectors. The variable $ is known as the azimuthal angle and is defined as the angle between the a, and b, vectors and therefore describesthe orientation of the overlayer with respect to the substrate. The three modes of epitaxy are
commensurism, coincidence, and incommensurism. Commensurism is defined as a total lattice
match between the substrate and overlayer, while coincidence is a partial lattice match.
Incommensurism means that the lattices do not match.
The lattice agreement between the substrate and AAP was determined using EpiCalc
Version 5 [60-62]. This software calculates the lattice agreement between two surfaces using a
dimensionless potential energy, V/VO, as a measure of goodness of fit. The value for VVo ranges
between -0.5 and 1, where a value of 1 indicates incommensurism, 0.5 implies coincidence, 0
indicates commensurism on a non-hexagonal substrate, and -0.5 commensurism on a hexagonal
substrate. The angle $ was varied between 00 and 1800 in intervals of 0.250. The size of the
overlayer was set to 25blx25b2. The output is a plot of the potential V/VO as a function of the
azimuthal angle $.
2.10. Molecular Dynamics Simulations
Systems containing a crystal slab of triclinic lactose or
p-mannitol,
with dimensions ofapproximately 50x50x20
A,
were constructed with various crystal faces aligned to one another.The following faces of lactose and AAP were aligned: (140)/(001), (14T)/(001), (20T)/(001),
(011)/(00 1), and (011)/(111). These faces were chosen as representative pairs in the absence of
experimental data showing which faces of lactose and AAP are bound together. The (140), (14T)
and (20T) faces of lactose were chosen because of their increased presence in the spherical
agglomerates (vide infra) whereas the (011) face was chosen because it is the most abundant face
in the single crystal form. The (001) and (111) faces of AAP were chosen because they have
been previously determined to be the fastest growing faces [63]. For D-mannitol and AAP a
previous epitaxy study demonstrated that the (00 T)/(100) are bound together, therefore we
simulated the energy interaction between this pair [35]. Table 2-1 summarizes additional
simulated pairings. These additional face pairings showed neither lattice matching from the
EpiCalc calculations nor favourable energy interactions and will not be discussed in the results
section.
Table 2-1: Face Pairings Between AAP and Lactose and Mannitol Investigated Using Molecular Dynamics Simulations in the Present Study.
AAP 001 111 100 011 Lactose 14T x 140 x 20T x 11T x x 011 X x 011 x 10T x x Mannitol 00T x x x
Each alignment was carried out such that the face-to-face distance between lactose or
mannitol and the AAP overlayer was approximately 3
A.
After the initial alignment, the AAP overlayer was rotated through 2.5 degree increments for 360 degrees to produce 144 starting structures for each system. Following the rotations, all systems were placed in a period box withbox vectors matching the bjb2-dimensions of the lactose/mannitol crystal. The b3-direction on the
other hand was ascribed a length of 120
A
so that face-to-face interactions of periodic images would be minimized. The basic system setup and geometric parameters are shown in Figure 2-3.(P
120A
A AP overlayer
al 3 a2 b1---
----
b2
--
90A
90A
Lactose/Mannitol
Figure 2-3: Crystal slabs of lactose and mannitol with overlayers of AAP were simulated using the basic geometries shown. The potential energy as a function of azimuthal angle (cD) between crystal vectors al and b1 were produced
by averaging energies from short low-temperature molecular dynamics simulations.
The Glycam06 force-field parameters [64] were applied to molecules in the lactose
crystal, whereas the following procedure was used to derive parameters for AAP and D-mannitol:
First, xyz coordinates of AAP and mannitol monomers were taken from the crystal structures of
AAP (Form I) and the
P
polymorph of D-mannitol. The coordinates of these structures were relaxed to a local minimum on the potential energy surface (zero-imaginary frequencies) usingthe B3-LYP/6-31G(d) level of theory. The electrostatic potentials (ESP) of the AAP and
mannitol monomers were derived by carrying out a single-point energy calculation on the
resultant structures with the HF/6-3 1G(d) level of theory. The resultant ESPs were fit using the
RESP procedure [65, 66] to derive partial atomic charges in accordance with standard parameter
development of AMBER-style force-fields [67]. The remaining parameters for describing bond,
angle, dihedral and vdW potentials were taken from the generalized amber force-field (GAFF)
[68]. All molecular dynamics simulations were carried out using the GROMACS 4.5.3
molecular dynamics suite of programs [69] by using the porting procedure of Sorin and Pande
[70]. All quantum chemistry calculations were carried out using the Gaussian 03 program
package [71].
7000 steps of steepest descent minimization on all rotamers were carried out to derive
relative interaction energies (AE) as a function of azimuthal angle. The resultant structures were
used as shooting points for 10 short (6 ps) low temperature molecular dynamics simulations.
These simulations were performed in order to overcome local energy barriers without causing
major disruptions of the relative lattice angles between the lactose and mannitol crystals and the
AAP overlayer. The final structures from the MD simulations were optimized for a further 7000
steps of steepest descent minimization and the average potential energy of the 10 optimizations
was taken as the energy for the given lactose/mannitol and AAP rotamer. All molecular
dynamics simulations were coupled to a Berendsen thermostat and semi-isotropic Berendsen
barostat to a target temperature of 100 K and target pressure of 1 bar. The isothermal
compressibility in the z-direction was set to 0.0 bar-' in order to maintain the large face-to-face
separations between periodic images. Electrostatic interactions were calculated with the Ewald
were constrained using the LINCS algorithm [73] and the time integration step was set to 2 fs. A
geometric definition for the existence of a hydrogen bond was used for the hydrogen bond
analysis. The acceptor-donor distance cutoff was set to 3.5
A.
The angular acceptor- hydrogen-donor cutoff was set to 300.2.11. Composite spherical agglomerate generation
To form the composite spherical particles, the two components were dissolved together in
water with concentrations set such that the template molecule would crystallize first, allowing
the target to nucleate heterogeneously on the crystalline template surface. The concentrations
were set such that the nucleation induction time for the template molecule was always shorter
than that of the target molecule, as verified by experiments conducted on the individual
components alone, in the absence of one another. A schematic of this process can be seen in
Figure 2-4.
Evapoato
a eof water
Crystalti zation Tehplating of
Water of Lactose NaCl by Lactose
containing Lactose and
NaCJ
Doecne
Figure 2-4: Schematic of composite spherical agglomerate generation. Emulsion of water containing heterosurface (lactose) and template (NaCl) is placed into dodecane and stirred. Emulsion is heated to evaporate water. The
3. CRYSTALLIZATION OF ALISKIREN BOC-BASE
3.1. Introduction
This chapter describes the first of two continuous crystallization processes that were
developed as part of the bench scale unit for continuous manufacturing. Each of the
crystallizations had its own unique challenges. As an intermediate purification crystallization, the
primary concerns for the crystallization of Aliskiren boc-base were purity and process yield. This
chapter describes the work that went into the process development, including challenges using
synthesized material rather pure starting material and the decisions that were made about where
to add anti-solvent into the process. Additionally, this chapter describes the results of the process
modeling performed on the crystallization system. This combined population and mass balance
model was both fitted and validated using experimental data.
3.2. Process Development
3.2.1. Influence of water on the crystallization process of C1.
The feed solution to the crystallization consisted primarily of Cl and C2 in Ethyl Acetate.
Crystallization experiments using pure ethyl acetate, C1 and C2 to form the starting solution
resulted in a yield of 92% Cl recovered with greater than 98 % purity. Crystallization using feed
material from an actual reaction (as opposed to using pure materials) gave a yield of 62% with