I."
x
CRYSTALLIZATION AND MELTING KINETICSOF SODIUM DISILICATE by
GERALD STEWART MEILING S. B0 University of Utah (1958)
S, M. Massachusetts Institute of Technology (1959)
Submitted in partial fulfillment of- the requirements for the degree of
DOCTOR OF SCIENCE at the
Massachusetts Institute of Technology
1966 Signature of Author 7 Signature of Professor in Charge of Research Signature of Chairman of Departmental Committee on Graduate Students
Department ,of Metallurgy
Professor Donald R, Uhlmann
/7_
1/
ii
ABSTRACT
CRYSTALLIZATION AND MELTING KINETICS OF SODIUM DISILICATE
by
GERALD STEWART MEILING
Submitted to the Department of Metallurgy, September 1966 in partial fulfillment of the requirements for the degree of
DOCTOR OF SCIENCE
The kinetics of crystallization of sodium disilicate from the melt have been measured over a range of undercooling of 298
Centigrade degrees. The extent of crystallization was found to be a linear function of time in both air and dry nitrogen atmospheres. A maximum in the growth rate vs, temperature curve was observed at
about 810*C with a value of about 55 /min, When the reduced growth rate, un/[l- exp(- LAT/ RTTE)I, is plotted vs. the degree of
undercooling, AT, a straight line which intersects the ordinate is obtained for undercoolings greater than 50*CT
At all undercoolings, the growing crystals were observed to have a well-defined faceted morphology, This morphology, as well as the form of the reduced growth rate vs. undercooling relation, provide evidence against any transition from a lateral growth mechanism to one of continuous growth.
The extent of melting was observed to be linear with time
except after extensive melting wherein disintegration of the crystal took place rather rapidly. At superheats of 1 and 4 degrees, the melting rates are 3 and 40i/min, respectively,
The slopes of the melting and crystallization rates vs, tempera-ture were found to be discontinuous through the melting point, This result is discussed in terms of our understanding of the crystalliza-tion and melting processes,
Thesis Supervisor: D. R. Uhlmann
Title: Assistant Professor of Ceramics
Table of Contents
Page No, Title Page 0 0 0 0 0 0 0 0 0 0 0 0 0 0 0 0 0 0 0 0 0 0 0 0 0 0 0 0 0 0 0 0 0 0 0 0 0
i
Abstract 0 io
Table of Contents 0 0 o 0 0 0000000000000 0 0 0 0 0 0 0 0
iii
List of Illustrations o 0 oco o 0 . o o o o o oo oo0oo0ooo00oV
List of Tables ... ... 4cocoo ooooooo o o o00 o00 0 4 ix Acknowledgement ... 00000 00 0 0 0 0 0 0 0 0 0 0 0 0 0 0 0 0 0 0 0 0 xI0 INTRODUCTION 0.0 .o 0 0 0o 0 0 0o. 0 0 00 0 o000 0 0 00000 1
II,0 LITERATURE REVIEW 0 0 C 0 0 0 0 0 0 0 0 0 0 0 00000000 .00000 3
10
Growth RateTheory
000000000000000000.00. 0 3 2. Interface Morphology 00000000000000000006. 7 3, Crystal Growth Measurement Techniques .... 19 4. Kinetic Studies in Glassy Systems 00000000 225 Sodium Disilicate o ooo0ooo000 00.0. 26
III. PLAN OF WORK 0 0 .0 0 0 . 0 0 00 0 0 0 0 0 0 0 0 0 0 0 0 0 0 0 0 0.0.0 35
IV. EXPERIMENTAL PROCEDURE 0 37
1. Sample Preparation 4 37
2. Viscosity Measurem;ents oooccocc.ooo.ooo.o. 38 3. X-ray Analysis 0 0 0 0 0 0 0 0 0 0 0 0 0 0 39 4. Phase Equilibrium and Kinetic Studies .. 0. 39
5, Crystallization Measurements ... 40 6. Interface Temperature Determination ... 42
7. Melting Measurements . 43
V. RESULTS AND DISCUSSION o...oo.o... 47
1, Chemical Analysis of Sample o....oo... 47 2 . Vi s os i ty 0 0 0o 0 .a a 0 a 0 . 0 00 0aaaa . 047
3, Phase Equilibrium and X-ray Analysis .0.0 49 4. Crystallization Measurements ... ooo... 55 5. Melting Measurements .. o. ooao... 73
iv
Page No, VI0 CONCLUSION 0000000000000000000000000000 0 0000 0 81 VII, SUGGESTIONS FOR FURTHER WORK 0 82 VIII, BIBLIOGRAPHY ,00 00 00000 00 00000000 00 00 00 00000 83 IX. APPENDICES 00000000000000000 0 00 00 0 0 0000000000 88 BIOGRAPHICAL NOTE 0 0 0 0 0 0 0 0 0 0 0 0 0 0 0 0 0 0 0 0 0 0 0 0 0 0 0 0 0 0 0 0 0 0 0 110
List of Illustrations
Fig. No. Title Page No.
1 Free Energy of Solid to Liquid Phases at (a) Equilibrium, (b) Displacement from
Equilibrium 0 0 0 00o0 0oooooooooooooooooooooo o 4 2 Schematic Representation of (a) Smooth
Interface and (b) Rough Interface (After
Chalmers [13]) 0 00 o.0.0 0 0 0 a o ao 9 3 Relative Free Energy as a Function of the
Fraction of the Surface Sites which are
Occupied (After Jackson [ 13
4 Surface Free Energy of an Interface as a
Function of its Position (After Cahn [3]). 15 5 Theoretical Reduced Growth Rate Curve
for Rough and Smooth Interface (Growth
at Screw Dislocations)0 ,0 0 0 0 0 0 0 0 00 0.... 0 18 6 Theoretical Reduced Growth Rate Curve
for All Materials (After Cahn, Hillig,
and Sears [4]) 0000000.00a0.0. . ... 20 7 Observed Melting and Crystallization
Rates of Tetragonal P205 (After Cormia,
McKenzie and Turnbull [31])0000000... 25 8 Phase Diagram in the Region of the
Binary Compound Sodium Disilicate (After
Kracek
[33])
... ...0.0.0 . ...0 0 ... 279 Projection of the Crystal Structure of Sodium Disilicate in the x-y Direction
(After Liebau [36])..0000.0..0..0... 29 10 Composite Viscosity Data for a Sodium
Disilicate Melt .. ... 0000000000000000000 30 11 Growth Rate vs. Temperature for Sodium
Figo No0 12 13 14 15 16 17 18 19 20 21 22 23 24 25 vi Title,
Reduced Growth Rate vs. Undercooling for Scott and Pask's Dataoo0 0 0 0 0 0 0 0 0 0 0 0 0 0 0 0 0 Schematic Diagram of Crystallization Furnace .a 0 0 0 0 0 0 0 0 0 o 0 0 0 0 0 a 0 0 0 0 0 0 0 a 0 0 0 0
Micrograph of Bulk Sample Showing Non-uniformity of Melting at Grain
Boundaries0000 o0o000000000000000000a00 000
Schematic Diagram of Hot Stage Used for Melting Studies 0 0 0 0 0 0 a 0 000 a a a a aa
Infrared Analysis of Sodium Disilicate Glass .0 0 0 0 0 0 0 0 0 0 0 0 0 0 0 0 0 0 0 a 0 0 0 0 0 a 0 0 0 a a a a
Viscosity vs. Temperature for Sodium Disilicate Melt.a 0000 0a oa a ooa a o a a Log Viscosity vs0 Reciprocal Temperature for Sodium Disilicate Melt 0ooooo o0o0o.0
Time Required for Complete Transformation of a to a Phase vs. Reciprocal
Temperature eeoooo o oaooooo a o 000 000..
X-ray Diffraction Patterns of Samples of Sodium Disilicate Obtained from
Crystallization Experiments.,.00 0 0 0 0 0 0 0 0 0 0 Extent of Crystallization vso Time, Series A-0 0 0 0 0 0 0 00 0 3 0 0 0 00o o. 000000 Extent of Crystallization vs. Time,
Series A
,
0 00 Q 0..0 a.0 a ...0 000Extent of Crystallization vs. Time,
Series Ao.0000 .00.0000.000000.0000..0..0 Extent of Crystallization vs. Time,
Series A ooooo ooo ooooo.oooo.oooo o000.. Extent of Crystallization vs0 Time,
Series A o o o o0 0o 0 0 o o 0 0 o 0 a 040 o o o 0 e oo. oo0
Page No0 33 41 44 45 48 50 51 54 56 58 59 60 61 62
Fig. No0, 26 27 28 29 30 31 32 33 34 35 36 37 38 39 40 41 42 Title
Extent of Crystallization vs, Time for Encapsulated Sampleo00ooooo0 ooooooooOOOO Growth Rate vs,, Temperatureoooooooooooo Growth Morphology of Sodium Disilicate at 9 Degrees Undercooling oooooooooooooooooo Growth Morphology of Sodium Disilicate at 20 Degrees Undercooling 0 0 0 0 0 0 0 0 0 0 0 0o O0 0 0 Growth Morphology of Sodium Disilicate at 244 Degrees Undercooling oooooooooooo Growth Morphology of Cristobalite in Fused Silica at 263 Degrees Undercooling. Temperature vs, Time for Thermocouple Bead Located in Sample ooooooooooooooooo Reduced Growth Rate vs. Undercooling .... Reduced Growth Rate at Small
Undercoolings vs0 Undercooling 000o0000. 0
Extent of Melting vs. Time 00 000..0
Extent of Melting vs0 Time 00000000000.00 Crystallization and Melting Rates at Small Undercoolings vs0 Undercooling ... Extent of Crystallization vs0 Time,
Series B o .
Extent of Crystallization vs, Time,
Series B 000.. 0000000000000000000a0000 . a Extent of Crystallization vs. Time,
Series B o ooo o o o o ooo o a . Extent of Crystallization vso Time, Series B 0 0 0 0 0 0 0 0 0 . Extent of Crystallization vs. Time, Series B 0 Pge No0 63 64 67 67 67 67 69 72 75 76 77 78 97 98 99 100 101
'4uqj, 0
9A UO m1IvTTTU3S(D JO
*91111 OSA UOTIUZTTT SAZI JO E OT 0 000 0 00 0000 0 0 0 00 0 0 ooooo0oo00 0 0 Q0 6Ou1j 08A UOT39Z1TTVISAIOr JO Z OT 0 0 000 00 0 000 0 000 00 0 000 0 000 00 00 0 00 D 'u1LL 08A uOTIWzTTTVISJO JO 0 SN SNd;a:T T T TA GO.18S :tug.xa .3uaxa saT.19S 9t? O 97-ST
List of Tables
Title
Summary of Phase Equilibrium of
Sodium Disilicate 0 0 0 0 0 0 0 0 0 0 0 0 0 0 0 0 0 0 0
Page. No.
52
Table No.
x
Acknowledgements
I am particularly grateful to my advisor, Professor Donald R. Uhlmann, for the many discussions we have had regarding this work and the crystal growth field in general, Appreciation is also
expressed to Professor John W. Cahn for the many stimulating dis-cussions we have held on the same subject0
The construction of the hot stage microscope used in the study was greatly expedited by the assistance of Thomas R. Brown and the Vickers Instrument Company who permitted us to borrow the microscope equipment used in this study0
The viscosity data is due entirely to Corning Glass Works under the direction of Mr. Eugene Fontana, Also, the probe thermo-couple used in this study was calibrated by the AVCO Corporation with the assistance of Dr. William Rhodes.
My wife, Jane, provided moral support for the period of time in which this investigation was made and also provided
invaluable assistance in the typing and by checking the composition of the thesis in the later stages of its development.
Finally, acknowledgement is given to the U. S. Atomic Energy Commission for the financial support of this work. Contract
In recent years there has been much theoretical discussion about the nature of crystal growth from the melt [1-5], To date, however, there has been a notable paucity of experimental data against which the theories can be tested, Indeed, a recent survey of the literature [5] has indicated only a single study [6] in which growth rate, viscosity, and morphology data were obtained over a wide range of undercooling with the same given starting material.
The importance of morphological observation as an essential supplement to kinetic studies was noted by Professor Frank in his introductory remarks at the Cooperstown Conference [7]: "%.we cannot expect to understand the kinetics of crystal growth either in the relatively simple case of the growth of a metal from its melt, or in the very complex and obscure case of the crystallization
of a polymer, without paying close attention to the morphology of the growing crystal - and conversely, by the time we fully understand the morphology, we shall know practically all about the kinetics."
In the present work, then, we will be concerned with
observations of growth morphology and the crystallization and melting kinetics of sodium disilicate. The material was selected because of its convenient melting point, relatively high viscosity at the melting point, pronounced glass-forming tendency, intermediate
2
entropy of fusion, the availability of viscosity data over a wide range of temperature, and previous kinetic data which indicated promising results but required confirmation or modification.
II LITERATURE REVIEW
10 Growth Rate Theoryg
When a supercooled liquid is maintained at a temperature
below the liquidus, crystal growth normally takes place after initial nucleation. The nucleation process in condensed systems has been reviewed by several authors [8-9] and will not be discussed in this work except as it relates directly to the crystallization process, ice. growth which is controlled by the nucleation and growth of a two dimensional disc on the surface of the crystal0
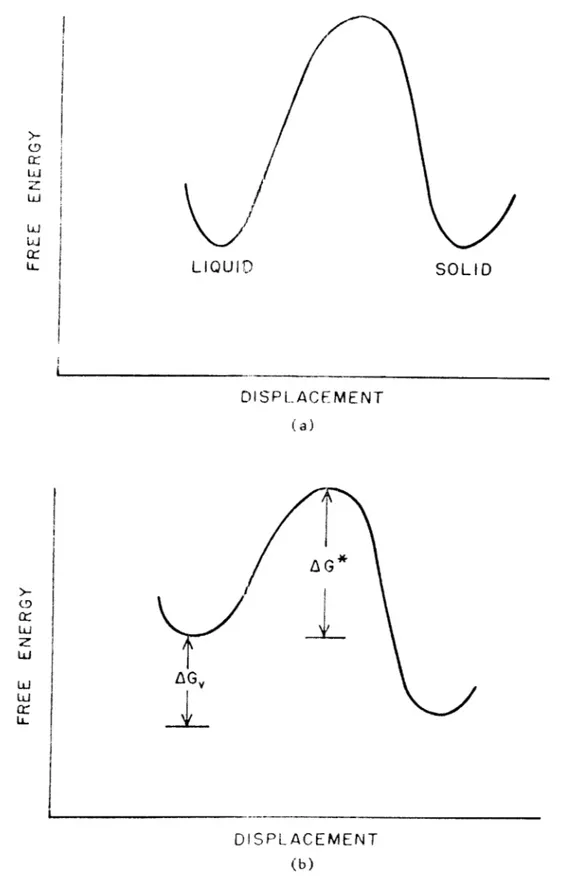
In the classical analysis of the crystallization kinetics of a pure material, one considers a two phase system where the growth of the solid phase takes place through the addition of molecular units from the liquid phase across the solid-liquid interface to sites (steps) at the surface of the crystal where the molecule will have a low energy configuration (small number of "dangling bonds"). At equilibrium the free energy of the solid and liquid phase are
equal (Figure la), With a finite departure from equilibrium, a driv-ing force AG, is maintained in the direction of the most stable
phase, ie. crystallization at finite undercooling or melting with finite superheat (Figure lb), The activation energy for the process is AG*, and it represents the diffusional barrier to growth,
The rate of advance of a solid-liquid interface is determined by considering the net frequency of successful jumps which a molecule
4 (94 U
LIQUr)
SOLID DISPLACEMENT (a) AG* UX
LU D I SPLA CEMENT (b)Figure 1. Free Energy of Solid and Liquid Phases at (a) Equilibrium and (b) Displacement from Equilibrium.
in the liquid makes to the solid. Thus,
u = aov (1)
where u is the growth rate in cm/sec and ao is the jump distance. The term v is given as v - D/ao2 (the frequency which molecules in a medium having a self-diffusion coefficient D" strike an area of molecular dimensions ao2) X f (a factor which represents the fraction of sites at the interface where molecules can be prefer-entially added or removed) X [1-exp(AGv/kT)] (the thermodynamic driving force) [10]. That is:
U f [1 -- exp(- "M
)]
(2)At small departures from equilibrium the driving force AGv is small and can be approximated as
G T (3)
Av TE
where L is the latent heat of fusion and TE is the equilibrium transition temperature, Also, when AGv is small, equation (2) can be further- simplified by expanding the exponential and neglecting the higher order terms, thus
U fD"LT (4)
6
This result is essentially the same as derived by Hillig and
Turnbull [11], At large underceelings equation (4) is unsatisfactory
and the following relationship is preferred:
fD" L AT
u =
[1
- exp(- RTT)] (5)0 E
A further refinement of equation (5) can be made by using a
better approximation for AGv as suggested by Hoffman [12], however this refinement is generally beyond the experimental accuracy of this measurement.
Diffusion across a solid-liquid interface is not well under-stood; it is expected, however, that the activation energy for viscous flow and diffusion in a liquid is the same as that which controls the transport of molecules across the interface. Thus the diffusion coefficient D" is generally assumed to be inversely pro-portional to viscosity n according to the relationship
D" = (6)
where b is a constant and is often given as the Stokes-Einstein coefficient
k
b = (7)
It should be pointed out, however, that the diffusion coefficient for transport across the solid-liquid interface is, in general, different from that for transport in the bulk liquid, Indeed, it has been suggested [4] that it may be larger than the bulk liquid coefficient by a factor of 10 to 100, This difference is attributed primarily to an expected difference in jump distance ao
For purposes of relating crystal growth kinetics to observed morphology it is useful to express equation (5) in terms of a
reduced growth rate by combining it with equation (6) such that
f ,. un/[l - exp(- LT)] (8)
E
The right hand side of the equation is defined as the reduced growth rate, and it is this relationship that we will be most concerned with in this investigation, The left hand side is the factor f which is related to the crystal morphology and will be discussed in
detail in the next section0
2Q Interface Morphology!
As previously mentioned the factor f in the growth rate
relationship and the atomic attachment mechanism are interdependent, thus an important part of growth kinetics is the relationship of growth morphology0 In general the growth morphology can depend upon several variables namely, surface energies, solute concentration,
8
grain boundary energies, and the free energies of the two phases [13], As in any kinetic process, however, it is expected that one set of conditions will dominate and give the observed morphology,
The interface between a solid and a liquid can be defined as the surface which separates those molecules which occupy lattice positions in the crystal and those which do not, When this
definition is accepted there are two possible "structures" of the interface which are illustrated in Figure (2). Here (a) represents a "smooth" interface with a step and (b) is a "rough" interface0
Consider first of all the "smooth" interface. If the inter-face between the solid and liquid is crystallographically perfect, iLe, without steps, then two dimensional nucleation theory predicts that a finite undercooling must be achieved before a disc on the surface will grow without increasing the free energy of the system. For growth by such a mechanism Hillig [10] has summarized various proposed models and the growth rate is expected to follow the relationship
u % exp(- ) (9)
where a is a constant,
Experimentally, it is observed that crystals growing from the vapor phase have a well developed faceted morphology (smooth
nrON
(a)
(b)
Figure 2. Schematic Representation of (a) Smooth Interface and (b) Rough Interface (After Chalmers [13]).
10
one can obtain0 Thus only rarely does the growth rate follow the relationship given in equation (9). To explain this apparent anomaly, Frank [14] suggested that growth takes place at the steps formed by emergent screw dislocations.
The Frank model proposes a spiral ramp which rotates around the dislocation and continually provides sites (steps) for growth. Assuming an Archimedean spiral in the steady state
r = 2r*O (10)
one can calculate the angular velocity w
W1
2r* r (11)
where r* is the critical nucleus and r is the rate of advance of a step in the plane of the interface (lateral growth). The rate of growth normal to the face is then given by the frequency which steps pass a point on the surface times the step height.
wa a
u= 47rr* r (12)
Initially, this mechanism was proposed only for growth from a vapor phase, but Hillig and Turnbull [11] later suggested that it may be applicable to growth from the melt0 In this centext the
second term in equation (12) is the rate of growth of a straight step and the first term is equivalent to the factor f, hence
a aLAT
4rr* &8TaTSLTE (13)
since the critical radius of the spiral (per nucleation theory) is given as
r* ___L
(14)
AG
where aSL is the solid-liquid interfacial energy, The most interesting point is that for a screw dislocation mechanism the factor f is proportional to the undercooling AT. Physically, as AT increases the steps become closer together, hence the number of sites available for growth increases.
A rough interface, Figure (2b), is one in which the interface is not atomically smooth and has many low energy sites (stfps). If such a "structure" is thermodynamically stable then growth can take place at these sites without prior nucleation or need of a screw dislocation mechanism to provide steps. In this case f is expected to be of the order of unity, and while it will in general depend on orientation [5], it should not depend strongly on undercooling.
The concept of a rough interface has been discussed by
~qI -- _________
12
Jackson proposes that the surface of a crystal is in equilibrium with its liquid and then, on the basis of a nearest neighbor model,
calculates the free energy change as atoms or molecules are added randomly at the plane surface. The result is the following free energy relationship T= ax (1 - x) -xznx - (1 - x) Zn(l - x) (15) NkTE where L a = E( (16)
and x is the fraction of surface sites occupied. The constant in equation (16) consists of two factors, L/RTE, which is a bulk material constant, and E which is a structure constant and depends on the crystal face under consideration, This factor represents the fraction of the total binding energy which binds a molecule in a layer parallel to the plane face to other molecules in the layer. It is always less than unity and is largest for the most closely packed planes of the crystal.
In Figure (3) equation (15) is plotted for various values of ao It is observed that for a<2 the lowest free energy configura-tion corresponds to a surface with half the surface filled, i.e. a rough interface0 For a>2 a smooth interface is defined. That
a =10.0 1.5 z 1.0-z U-
a
=5.0 0.5-a = 3.0 0 a = 2.0 a = 1.5 a= ro -0.51 0.1 0.2 0.3 0.4 0.5 0.6 0.7 0.8 0.9 1.0 OCCUPIED FRACTION OF SURFACE SITESFigure 3. Relative Free Energy as a Function of the Fraction of the Surface Sites which are Occupied (After Jackson [1]).
14
is, the lowest free energy configuration is a surface having a few extra sites filled and a few missing from the face,
According to the criterion of Jackson, therefore, materials characterized by small entropies of fusion (L/RTE<2) should have interfaces which are rough on an atomic scale and should demonstrate the features of nearly isotropic growth. Materials characterized by large entropies of fusion (L/RTE>2), on the other hand, are
expected to have smooth interfaces and demonstrate the features of anisotropic growth.
A somewhat different approach to the nature of the interface is that taken by Cahn [3,4]> Cahn proposes that it is not
sufficient to consider growth by a lateral mechanism (smooth) or by a continuous mechanism (rough) without considering the effect of the driving force on the nature of the interface.
The nature of the interface is assumed to be "diffuse" in the sense that the degree of order, composition, or some other extensive variable changes continuously with distance as one traverses the interface. An anology is the continuous change of magnetic direction with regard to direction across a domain wall. With such an interface the surface energy of an interface will depend upon its position with respect to the gradient. Hence the surface energy will vary periodically (with the periodicity of the lattice) as the interface moves. See Figure (4). The difference between the maxima and minima of the surface energy would then
15 00,
z
0 zI)z
w
w
LLa:
b
... "Ill...a
-POSITION
OF INTERFACE
Figure 4. Surface Free Energy of an Interface as a Function of Its Position (After Cahn [3]).
16
constitute a barrier to lattice motion normal to the interface, The height of the barrier is related to a term gM which is derived from the theory and for very diffuse interfaces is given as
g = 7Tx3exp(- 7rx) (17)
where x - TTn/2 and n is the number of atomic layers comprising the transition from solid to liquid, For a smooth interface gm is given as approximately unity.
The theory further predicts that at low undercoolings the driving force is not sufficient to overcome the lattice resistance to motion, thus all materials must crystallize by a lateral growth mechanism (two dimensional nucleation or defect growth). This
type of growth corresponds to a critical undercooling AT* which is defined as
AT* < M o E18)
where o is the surface energy at its minimum. For undercoolings larger than
AT > 7 AT*
(19)
resistance and growth is primarily normal to the interface, while at intermediate undercoolings there is a transition from lateral to continuous growth.
The approach of Cahn and that of Jackson may appear to over-lap, but in fact there are serious differences between the two as pointed out by a recent critical review of crystal growth theory and experimental data [5], For the purposes of this investigation it is sufficient to point out the differences that each theory predicts with regard to the temperature dependence of crystal growth0
The Jackson model suggests two types of interface struc-ture (a) a rough interface on which the fraction of growth sites at the surface is large (of order unity) and should not vary strongly with temperature, and (b) a smooth interface on which the fraction of growth sites is small, and on which the creation of steps (by a screw dislocation mechanism, two dimensional nucleation, or possibly some other mechanism not yet determined)
should be required in order for the interface to advance. Based on these suggestions and equation (8), one would predict that when the reduced growth rate is plotted vs. undercooling, a horizontal line would be evident for a rough interface (f sl),
and a line with a positive slope would be obtained for screw dislocation growth (f" AT). See Figure (5). For two dimensional nucleation controlled growth a plot of log urn vs. 1/TAT should be a straight line with a negative slope.
CONTINUOUS GROWTH
UNDERCOOLING
Pigure 5. Theoretical Reduced Growth Rate Curve for Rough and Smooth Interface (Growth at Screw Dislocations),
The model envisaged by Cahn, Hillig, and Sears [4] proposes that all materials should at sufficiently small undercoolings
grow from the melt by a lateral growth mechanism (screw dislocation or two dimensional nucleation), while at larger undercoolings, growth should take place by the continuous advance of the surface
everywhere. Corresponding to this transition, a break would be expected to appear in the reduced growth rate vs. undercooling as well as a change in morphology from faceted to nonfaceted growth, As shown in Figure (6) the reduced growth rate vs, undercooling curve has a positive slope (screw dislocation) which increases rapidly, approaching the continuous mechanism at an undercooling of nAT*0
3o Crystal Growth Measurement Techniquesg
In all the above discussion, attention, of course, has been directed to the relation between growth rate and interface under-cooling, Unfortunately, however, growth is often limited not by interface kinetics, but rather by the rate at which the latent heat of fusion, generated in the freezing process can be removed from the freezing front. Under such conditions the interpretation of kinetic data is dependent upon a direct measurement of the interface tempera-ture,
A number of techniques have been used in attempting to circum-vent this problem. Among them, two have received wide attention:
Al
A
0A0
LuJ LuJz
-J0 401onE
(n(II-CONTINUOL
./
A/
101JS
REGIME
-(AT)* 4 7T (AT)* NJ
Figure 6. Theoretical Reduced Growth Rate versus Undercooling for All Materials (After Cahn, Hillig and Sears (4]).
U
-q
I 1 0 1 MAW ,
Crystal growth measurements can be made in fine bore
capillaries [17, 18] when the growth rate is small enough to permit the latent heat to be dissipated to the bath surrounding the capillary, In general, however, this is difficult to achieve because of problems associated with heat transfer from the crystal to the capillary, and through the boundary layer of liquid around the capillary.
The "thermal wave technique" [19, 20] consists of a crystal in contact with its melt such that the solid-liquid interface is in a constant temperature gradient, At one end of the system, a
sinusoidal thermal wave is introduced which propogates to the inter-face causing it to move back and forth, The interinter-face thus acts as a heat sink (melting) or a source (freezing) and generates a
thermal wave out of phase with the applied wave, By measuring the amplitudes and phases of the thermal waves with thermocouples
placed on both sides of the interface it is thus possible to determine the growth rate and the interface temperature. In practice, however, this technique has many shortcomings; experimentally it is difficult to obtain a truly sinusoidal thermal wave and any convective motion in the liquid is bound to effect the results obtained. Also this procedure involves a rather elaborate experimental setup and the
results hinge upon a complex theoretical analysis of the data. In metallic systems, however, where the solid and liquid are opaque and
the growth rate at a few degrees undercooling is of the order of meters/sec, it has many possibilities.
22
A third technique, used in the presen.t study, is the investi-gation of growth kinetics in materials with high viscosities at their melting points. With such materials, the growth rate and the rate of latent heat generation can be small even at large undercoolings, thus the interface temperature can well be taken as the bath
(furnace) temperature, The rapid increase of viscosity with de-creasing temperature likewise permits an observation of the growth morphology since the "quenched in" morphology is an accurate
representation of the morphology at the temperature under study, The glass forming systems, therefore, have much to offer in the way of elucidating the kinetics of crystal growth, but these
systems are not without difficulties. The interpretation of the kinetic data is heavily dependent upon viscosity (as will be demonstrated), Also, water vapor or other atmospheres have been shown to have an appreciable effect upon the growth rate, at
least in some systems [21], Many of the inorganic glass formers melt at high temperature, thus temperature measurement and control can become a source of error,
4. Kinetic Studies in, Glassy Systems:
Among the systems which form a glass upon quenching, organic liquids have probably been studied the most. Their low melting point and ease of obtaining homogeneous samples are attractive to an investigator. Salol [5, 22-26], glycerine [27], and durene [28]
are classic examples. The results of these investigations have been reviewed by at least two authors [4, 5] so they will not be dis-cussed in detail here. It will suffice to say that in none of the investigations except that of Jackson, Hunt and Uhlmann [5] on salol was growth kinetics related to morphology, and in this investigation the growth rate was found to depend strongly on
gaseous impurities and water, Also, a time dependence was observed in that a given face of a given crystal was found to grow at
different rates at different times0 Hence the relevance of each of these studies to crystal growth theory leaves something to be desired0
A bright exception to this is the work of Magill and
Plazek [6], In this investigation, the viscosity and growth rate measurements on Tri-a-Naphthyl Benzene have been made over a wide range of temperature0 Preliminary results suggest that the crystal growth kinetics in this material, under the conditions studied, are surface nucleation controlled, That is, a plot of log un vs0 1/TAT gives a straight line of negative slope,
Among the inorganic glasses, most published results are concerned primarily with glasses of commercial interest which are generally at least three components,, There are, however, a few studies which treat the crystallization kinetics of single component or congruent melting compounds0
24
most complex when it comes to interpretating growth data, Boric oxide does not crystallize at all even when seeded except under high pressure [29]. Fused silica has been investigated by Ainslie,
Morelock and Turnbull [21] and the extent of crystallization was observed to be diffusion controlled and dependent upon atmosphere, specifically oxygen and water vapor. Wagstaff [30] later confirmed the previous results and observed that samples of synthetic fused silica, dewatered by heat treatment in vacuum, had linear kinetics, From this he concluded that the parabolic rate dependence is due
to the nonstoichiometry of fused silica0 Wagstaff did not attempt to correlate his data with theory since viscosity data for fused silica is extremely dependent upon water content,
Cormia, MacKenzie and Turnbull [31] investigated the melting and crystallization kinetics of P205 over a small range of
temperature, In this study single crystals of P205 were encapsu-lated in fused silica, heated on a hot stage, and the rate of crystallization and melting determined by following the change in size of the crystal with a micrometer eyepiece, In general the rates were found to be dependent upon time, crystal morphology, crystal direction and thermal history. The small temperature range and the scatter in the data do not permit a good interpretation in terms of crystal growth theory, but the data appears to suggest growth by a screw dislocation mechanism over the range studied. Also, the data suggests that a continuous curve could be drawn
SOLIDIFICATION RATE + AT, 0C 30 k- MELTING RATE 20
F
10 U(CM/SEC X 10) 10 0 0 0-10 -20 -30 00T
-40
-0
00 00 00 20 Tm = 580 0C 40 U(CM/SEC X 10') F--AT, 0CL
Figure 7. Observed Melting and Crystallization Rates of Tetragonal
P205 (After Cormia, McKenzie and Turnbull [31]).
0
L
60
N,
O
26
5, Sodium Disilicate:
The material investigated in the present study was sodium disilicate. It was selected, as previously mentioned, because of its convenient melting point, relatively high viscosity at the melting point, pronounced glass forming tendency, intermediate entropy of fusion, the availability of viscosity data, and the existence of previous kinetic data which indicated promising re-sults but required confirmation or modification,
A partial phase diagram from the Na20 - Si02 system is
given in Figure (8), It is observed that sodium disilicate melts congruently at 874+ 1C and has two stable polymorphs which
Morey and Bowen [32] and Kracek [33] have designated as the 6 and a forms (referring to the low-temperature and high tempera-ture phases respectively), Kracek suggested that the a to 6 transformation was displacive and gives the transformation temperature as 678*Co Also, two unmixing heat arrests were defined at 706*C and 768*C. Recently these transition tempera-tures were investigated by Willgallis and Range [34] who suggest that heat arrests are in fact displacive transformations of the high phase (a)corresponding to
678 706
a - a , a (20)
No20 SiO2+ L 10890 LIQUID MIXED CRYSTALS Nc 2 -2SiO + L 874 0 8460
/
I No2O- SiO 2/
I
I
I
7060/ +aNa20-2 Si0 2 +$ No20-2 S"Oa2 50 60 MIXED CRYSTALS a No20 - 2 SiO2+ SiO2/G
No20 -2 Si02+ S02 70 TRIDi WEIHT PERCENT Si0 2Figure 8. Phase Diagram -in the Region of the Binary Compound Sodium Disilicate (After Kracek [33]).
1200 I 100 1000 C) 0 LUJ -LU 900 YMITE 800 700 600 + L 870*1 QUARTZ + 793* 7680
1
678* 80 90 I I I I I28
is suggested to be of the reconstructive type and the equilibrium temperature is estimated at 670*C. The a to transition has never been observed [34, 35].
The crystal structure of the a and a form were determined on single crystals by Donnay and Donnay [35] and found to be orthor-homic and monoclinic, respectively, A more detailed analysis of the a phase was carried out by Liebau [36] who proposes that the crystals consist of corrugated Si205 layers parallel to the (010) direction. A x-y projection of the crystal is given in Figure (9). Clearly, most of the x-ray work done on sodium disilicate has been done on single crystals since there is no powder data available in the literature, although the "d" spacings for both the a and the 6 phase are available [35]o
Viscosity data for molten sodium disilicate [37-40] are available over the temperature range 500*C to 1200*C - with, how-ever, most uncertainty in the temperature region of greatest interest (where crystal growth itself may interfere with the determination of viscosity). The data are summarized in Figure (10). The lower curve was drawn to include all the data, while the upper curve was drawn with the specific exclusion of the uncertain data (which seem consistently low).
The heat of fusion may be evaluated by combining measurements of heats of solution [41-43] with heat capacity data [44]. Values range from 77 to 10c2 kcal/mole, with the lower values representing
AA
Figure 9. Projection of the Crystal Structure of Sodium Disilicate in the x-y Direction (After Liebau [36]).
30
109 -- POSPEL.OV a E VSTRO POV
X - TL( E
0 - SHARTSIS, SPINNER 8 CAPPS I00 10 4--~ x-x -X -L!L-x 10 LuD S 10' 0 500 60 "oo 800 900 1000 1o100i TEMPERATURE (*C)
Figure 10. Composite Viscosity Data for a Sodium Disilicate Melt.
the more reliable data. A value of 8 kcal/mole was used in this investigation.
Measurements of the growth kinetics of sodium disilicate have previously been made by Leontjewa [45] and by Scott and Pask
[46], The former worker only obtained data over a limited range of temperature, and his results are of somewhat questionable reliability,
Scott and Pask's measurements were carried out over an
extensive range of temperature. They placed small samples of glass in the center of a strip heater fabricated with a central hole
for the sample. A thermocouple was located in the glass to determine the temperature,
Growth rates were measured on individual crystals, over single time intervals, using a micrometer eyepiece. All growth measurements were made on crystals growing on the surface of the melt0 Two separate glasses were investigated, the glass designated No. 2 having a higher impurity content and being further off
stoichiometry than glass No. l In Figure (11) the observed growth rates for both glasses are plotted versus the undercooling AT. Both the a and a phases were observed to have essentially the same growth rate at all temperatures studied.
When the reduced growth rate is plotted as a function of undercooling, the results shown in Figure (12) are obtained. Using the lower viscosity extrapolation (which includes all the viscosity
60
-
-50- a NUCLEATED AT 25*C D1,G NUCLEATED AT 5500C 40~ GLASS #10
00
30--00O
I--< 20-0 GLASS #2e 00 C 0 a: 10 -01 600 650 700 750 800 850 900 TEMPERATURE (*C)Figure 11. Growth Rate versus Temperature for Sodium Disilicate (After Scott and Pask [46]).
I I I I I I I I U Ii U r - VISCOSITY CURVE Q GLASS * 1I 'LS - VISCOSITY CURVE 4
GLASS # 2
{0
- VISCOSITY CURVE0 - VISCOSITY CURVE 0 6 --2* 0 0 4 0 0 0 . 0 00 4- 0 0e Figure 12. UNOERCOOLING (*C)
Reduced Growth Rate versus Uncercooling for Scott and Pask's Data.
48 44 40 -36 -32 -IC.) 28 2 2 260 L~i
1
1
t- 20 40 60 so 100 12 10 60 IO 20 20 24034
data), no deviation is apparent from a linear dependence of the re-duced growth rate on undercooling over the entire range of under-cooling investigated, There is, however, some uncertainty in the low undercooling range, for which the data are fragmentary,
It should be noted, however, that the kinetic data of Scott and Pask are subject to a number of drawbacks and possible errors, In particular, non-uniformities of temperature, with concomitant non-uniformities of growth, may well be anticipated from the sample and heater geometry. Further, the observation of phenomena on a
surface carries with it the possibility of contamination causing misleading results.
35
IIL PLAN OF WORK
The importance of morphology, atmosphere, and viscosity on crystal growth rates has been discussed in the introduction and
literature survey, It is also clear that because of the relevance of these parameters there is not yet a definitive experimental work which provides a good test for the theoretical models proposed,
The present work therefore proposes to study the relationship of these parameters on the crystallization and melting kinetics of sodium disilicate with the hope of providing a better understanding of the subject. Toward this end the following investigations were carried out,,
10 Design and construction of a furnace capable of maintaining a given temperature within + 0025*C for long periods of
time,
2. Preparation of homogeneous samples of sodium disilicate which are nearly stoichiometric.
3. Obtain reliable powder x-ray diffraction data for the a and phase,
4, Determine under what conditions the a and 6 phase are stable.
5, Investigate the kinetics of the a + S and S + a phase
36
6. Obtain the viscosity data for the material used in this investigation with special emphasis placed upon the range 600 - 750*C where there is a paucity of data,
7 Measure the crystallization rate over as wide a tempera-ture range as feasible with concurrent observations of the growth morphology.
8, Determine the possible effect of water vapor on the crystallization rate.
9. Measure the temperature of the interface between solid and liquid to see if any rise in temperature due to latent heat exists.
10. Determine the best technique for quantitative melting rate measurements and construct equipment if necessary, llo Measure the melting rates over as wide a temperature range
IV. EXPERIMENTAL PROCEDURE
l Sample Preparation:
Sodium disilicate glass was prepared from reagent grade
sodium carbonate and crushed quartz, The mixture was dry milled for 8 hours and heated at 700*C for 3 hours to drive off the C02* To minimize impurity effects, a single new platinum crucible was used
for both the calcining and fusion processes, The fusion was carried out by heating the mixture for 8 hours at 1000*CO At such temperatures, losses of Na20 by volatilization are expected to be negligible [47], Homogeneity of the glass was achieved by repeated melting and crushing. The melts were poured onto a graphite block, cooled, and crushed with a procelain mortar and pestle0 It was found that 3 or 4 crushings were sufficient to obtain homogeneity0
The final melt was heated at 1150*C for 8 hours to remove bubbles and then poured into a heated graphite block measuring 2" x 3" x 1/4"o The glass plate was then placed on a platinum sheet on a flat alumina block and annealed at 500*C for 2 hourso Since the graphite mold may have chemically reduced the surface of the glass during the pouring operation, the faces of the glass plate were ground to a depth of about 0.5 mm. Individual samples
measuring 2 mm x 2 mm x 6,0 mm were then cut from the glass plate and used in the crystallization and melting studies; viscosity measurements were made on the remnant0
38
Several samples of the glass used in this study were submitted for quantitative chemical analysis to Mr. D. L, Guernsey (Analytical Laboratory, Metallurgy Department, Massachusetts Institute of
Technology). Also, a semi-quantitative determination of the water content of the glass was obtained from an infrared analysis, A
sample of Corning's 7940 fused silica (water content about 1 percent) was compared with the glass used in this investigationo
2. Viscosity Measurements:
The interpretation of crystallization kinetic data requires that the viscosity of the material be well characterized, Therefore, samples of the glass used in this study were submitted to Mr0
Eugene Fontana of the Corning Glass Works for viscosity measure-ment,
The viscosity range of interest is the region 102 to 108 poise with special emphasis on the region where there is a paucity
of data0 This large range of viscosity required the use of two methods, rotating cylinder [48] and the parallel plate [49-51]. The rotating cylinder method is a standard technique and well described in the literature, hence it will not be discussed here0
The parallel plate is a modified version of Gent's [49] equipment such that the viscosity is measured dynamically with increasing temperature. That is, the flow (change in height) of a sample between two parallel plates under an applied load is
39
measured as a function of temperature. This equipment and the rotating cylinder have been calibrated against the NBS 710 standard glass.
3o X-ray Analysis:
The crystalline phase for a particular investigation was determined from x-ray diffraction patterns obtained using a standard 57 mm diameter Debye-Scherrer camera or a Norelco
diffractometer. The method used was determined largely on the size of the sample available, For the Debye-Scherrer technique,
samples were crushed and then contained in quartz capillaries of 0.5 mm diameter.
The reference powder data was obtained following the standard technique [52] of crushing the sample to pass through a 200 mesh screen and scanning the powder at 0.125 degrees per minute0 All samples were run in air at room temperature using Cu Ka radiation.
4. Phase Equilibrium and Kinetic Studies:
Because of the confusion in the literature regarding the phase transitions of the a and $ phases [32-35], it was felt
necessary to attempt to clear this up, Therefore, samples of glass were nucleated under different conditions and the crystallizing phase determined after isothermal heat treatment at several
tempera-40
tures0 Having thus established under what conditions the a and S phase could be obtained, a semi-quantitative determination of the a to S and 0 to a transitions were made, For this study, samples of the nearly pure phase (a or a) were isothermally heat treated and the time required for 100% transformation obtained,
5. Crystallization Measurements:
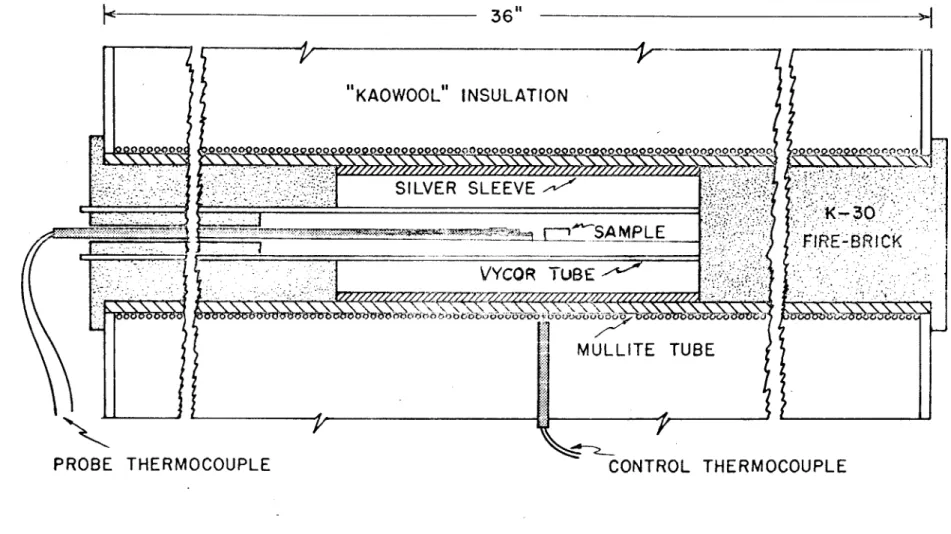
The crystallization studies were carried out in the furnace described in Figure (13). The furnace is Kanthal-wound and has seven zones whose resistance can be changed by means of external shunts to provide a uniform heating zone, A seven inch silver sleeve was placed in the hot zone to further improve temperature uniformity.
Power was supplied to the furnace by a saturable core reactor-magnetic amplifier unit. The chromelalumel control thermocouple was positioned between the windings of the furnace and the
tempera-ture was controlled by an expanded scale Honeywell Electronik strip chart recorder-controller The temperature was found to be constant within + 1/2C at 900*C over seven inches. The maximum temperature deviation in a 24 hour period was + 1/4*C.
The temperature of all samples was measured with a single platinum-platinum 10% rhodium thermocouple which was calibrated against an NBS standard thermocouple at four temperatures between 600*C and 900*C. A well maintained ice bath served as the cold junction and the emf was measured with a Leeds and Northrup K-3 potentiometer.
"KAOWOOL" INSULATION
000000q oq 0 00 00PS0SILVER SLEEVE
SAMPLE
E-30
VYCOR TUBE
MULLITE TUBE
PROBE THERMOCOUPLE
CONTROL THERMOCOUPLE
Figure 13. Schematic Diagram of Crystallization Furnace.
Js
42
The growth rates were determined by isothermally heat treating samples of glass for predetermined lengths of time at a particular temperature and then rapidly quenching to room temperature, Prior to the run, the surfaces of the samples were dusted with crystals of the a phase to promote uniformity of growth.
Following each run, the samples were mounted, polished at right angles to the growth front, and etched for 15 seconds with a 0,25% HF solution. The extent of crystallization was measured
with a micrometer eyepiece and the morphology of the growing crystals observed and recorded photographically0
Most runs were carried out in the ambient atmosphere0 To investigate the possible effect of atmospheric impurities, several runs were made on samples encapsulated in fused silica under an atmosphere of dry nitrogen.
6, Interface Temperature Determination:
In order to evaluate the possible departure of the interface temperature from the bath temperature, a run was made in which a fine (5 mil) platinum-platinum 10% rhodium thermocouple was inbedded in the sample. The sample was held at a temperature corresponding to the maximum rate (810*C), and the temperature was recorded on a strip chart recorder at maximum sensitivity (full scale 1.0 mv). Thus if the temperature of the interface departed appreciably from that of the bath it would be observed as the interface passed the thermocouple.
7 Melting Measurements:
It was hoped initially that the extent of melting could be measured in the same manner as the technique used for crystallization,
Thus, samples of glass were wrapped in platinum and crystallized
by heat treating at a temperature below the melting point, After
complete crystallization (as calculated from previous growth rates) the samples were further heat treated (melting) for a predetermined amount of time by "up quenching" to a temperature a few degrees above the melting point and then air quenched to room temperature, Following the run the samples were mounted, polished, and etched as previously discussed.
Samples prepared following the above procedure were ob-served to have extensive melting at the grain boundaries. The extent of melting in these regions was of varying thicknesses which can be attributed to flow and/or a distribution of particle
sizes. See Figure (14). Hence it was not possible to obtain quantitative melting rate data using this technique.
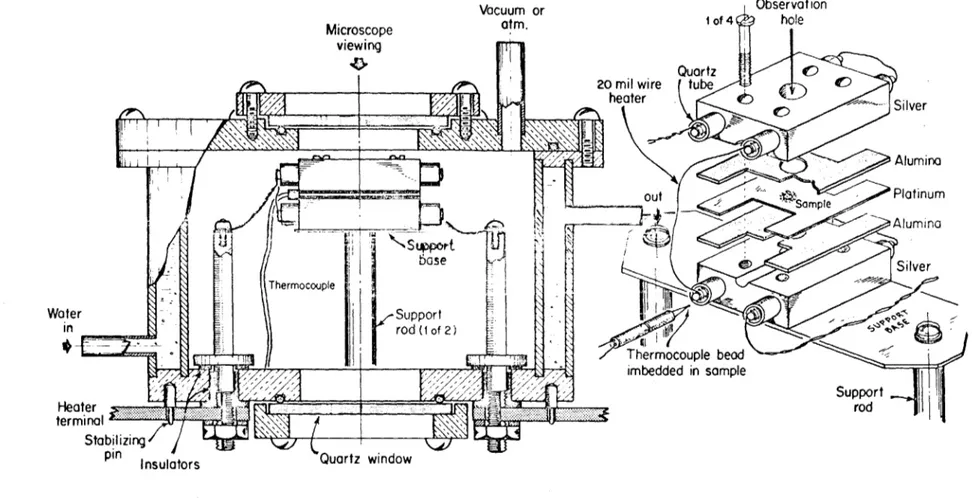
A hot stage microscope was the next technique tried.
Several heater and sample geometries were tried, however the stage described in Figure (15) gave the best results. A small glass sample was placed in a hole fabricated in the center of a platinum strip and a 5 mil thermocouple was placed in the glass to determine the temperature0
44
Figure 14. Micrograph of Bulk Sample Showing Non-uniformity of Melting at Grain Boundaries (Dark areas are
Quartz 20 mil wire tube
heater - Sle
S Silver
Alumina
out Sample Platinum
&
Alumi na'1 Thermcoppie base Sle
ThermSilvpr
Water
Support
in
rod (I of 2) Thermocouple bead imbedded in sample Support Hleater rod terminal - -StabilizingInsulators Quartz window
46
connected in series which are insulated from the silver block by fused silica tubes,, The high thermal mass of the silver and the location of the sample in a hole provided a sample which was essentially free of temperature gradients,
The power supply to the stage consists of a voltage stablizer and a variable transformer which served as a course control0 A
variable resistance in parallel with the hot stage was used as
a fine control whereby the temperature of the stage could be readily changed from one to ten degrees0
Upon heating the stage above 650*C, several crystals formed on the surface of the glass, By cycling the temperature through the melting point, a single crystal could be obtained. This crystal was then grown to a rather large size (500-700 U) at an undercooling of
about 25*C. The temperature was then raised near the melting point with the course control and adjusted to the temperature of study with the fine control (variable resistor). The extent of melt-ing was followed microscopically usmelt-ing a micrometer eyepiece. All melting measurements were made in the ambient atmosphere.
The thermocouple used in the melting study was standardized against the one used in the crystallization work. This was
accomplished by placing the thermocouples side by side in the crystallization furnace and bucking the emf outputs of the two thermocouples to determine the differential at the same temperature0
V0 RESULTS AND DISCUSSION
10 Chemical Analysis of Sample:
The silicate analysis of the glass used in this study indicated a S102 content of 65 85, 65,85, 65,91, 65o7O, 650979 65,80 percent, This compares with a theoretical SiO2 content for the disilicate of 65.97 percent. Cations other than sodium and silicon were found to be present in concentrations less than OJl percent, with iron being
the chief impurity, It is concluded, therefore, that the glass used in this investigation was within 0,2 percent of stoichiometric
sodium disilicate,
The results of the infrared analysis are illustrated in Figure (16), The fused silica sample is observed to have a quite sharp adsorption edge at 3,5 - 4.0 microns while that of sodium disilicate glass is much more diffuse, The presence of hydroxyl ions in the glass structure is very much evident in the fused silica
(water content approximately one percent) as indicated by the strong adsorption peak at 2.73 microns, There is only a slight peak in the sodium disilicate glass, however, and this may well be due to surface adsorption of water, Therefore, the glass used in this study may be regarded as "essentially" water free,
2, Viscosity:
MICRONS 2.5 3.0 3.5 4.0 5.0 0 .10 FUSED SILICA .20 z m .30
X' SODIUM DISILICATE GLASS
0 U) < .40 .50- .60-.70 1.0-4000 3500 3000 2500 2000 FREQUENCY (CM )
disilicate are summarized in Figure (17) together with the reported results of other investigatorso
It is observed that the data from the two techniques used in this investigation (parallel plate and rotating cylinder) overlap, giving quite good reproducibility. In the temperature region 650 - 690*C, the viscosity, as determined from the parallel plate technique, departs from the smooth curve due to the
crystallization of the sample, Except for this deviation, the data are in excellent agreement with previous investigators for both high and low viscosity regions0
It may be concluded, therefore, that the data of Pospelov and Evstropov are definitely low, as had been suggested previously, hence they may be disregarded0 Thus, of the two proposed curves
suggested in Figure (10), the data are best fit by curve number two, as also had been expected.
In Figure (18) log viscosity is plotted versus reciprocal temperature, It is observed that the viscosity obeys an Arrhenius relationship only at temperatures greater than 1000*K, and at
lower temperatures the slope of the curve increases with decreasing temperature, corresponding to a higher activation energy for viscous flow,
30 Phase Equilibrium and X-ray Analysis:
All of the crystalline samples obtained from this study had at least a small fraction of a disilicate, that is, it was not
50
O"0
--100
X - LILLIE
0 - SHARTSIS, SPINNER a CAPPS
A - POOLE
0 - POSPELOV a EVSTROPOV V - THIS STUDY (PARALLEL PLATE)
Q - THIS STUDY (ROTATING CYLINDER) ID 7 10 0 V I- V TEMERTUEVVC 0 > 10 100 x 104 x 10 400 500 600 700 800 900 1000 1100 TEMPERATURE (*C)
Figure 17. Viscosity versus Temperature for Sodium Disilicate Melt.
8.0
o
--O -LILLIE
o
- SHARTSIS, SPINNER a CAPPS4.0
--o
- POSPELOV a EVSTROPOVA - POOLE
V - THIS STUDY (PARALLEL PLATE)
13 - THIS STUDY(ROTATING CYLINDER)
2.0
-0.70 0.75 0.80 0.85 0.90 0.95 1.0 1.05 1.10 1.15 1.20 1.25
I/T X
52
possible to obtain $ disilicate free of a disilicate crystals, even in the reported stability range of a disilicate, where the a
disilicate must nucleate and grow as a metastable phase, This behavior is usually associated with a sluggish reconstructive type transformation between the two phases, Thus, this phenomenon is not unexpected for a material like sodium disilicate, and has been noted by several other authors [34, 35, 46],
In Table I the phases crystallizing at various temperatures and nucleating conditions are given,
Summary of Growth Temperature *C 800 800 800 650 800 TABLE I Phase Equilibrium Nucleation Temprture *C 700 675 650 650 25 of Sodium Disilicate Crystalline Phases Present " only
" and small amount of a " and small amount of a
and small amount of a a only
From the foregoing results it is observed that the a phase is formed by nucleation from a melt at temperatures below 675*C and that the a phase appears to be the most stable phase above this temperature (as determined by the relative quantity of each phase
53
produced), Above 700*C the a phase is the only phase formed, Hence the a - 6 equilibrium temperature appears to lie between 650 and 700.C
The foregoing analysis is typical of the techniques that have been used by previous authors [32-34] for determining the equili-brium transition temperature between the a and $ phase0 It
must be pointed out, however, that this is at best, just an
estimate of the equilibrium temperature, since metastable nuclea-tion and growth could lead to an erroneous result,
An estimate of the time required for the S to a phase transition to occur was obtained by taking samples which were nearly a free and isothermally heat treating them for various times over a range of temperatures0 The time required for 100 percent transformation was noted when the $ peaks disappeared on an x-ray analysis, The lowest temperature investigated was 750*C. where the transformation requires about 17 hours to take place0 The other results of this study are given in Figure (19).
If the straight line in Figure (19) is extrapolated to 675*C., the time required for transformation is of the order of 105 hours0 Thus, it is virtually impossible to determine the actual transformation temperature directly. The fact that the a to $ transformation has never been observed is also consistent with the above findings0 In this study, a sample of pure a phase was held for 1000 hours at 650*C with no apparent change, as determined by x-ray analysis0
54 TEMPERATURE
(*C)
850 800 750 4 0 1 0 ---Lj 00 LL 1 0 -0 C 00 8.6 8.8 9.0 9. 2 9.4 9. 6 9.8 10.0 I/T X 10'Figure 19. Time Required for Complete Transformation of 6 to a Phase versus Reciprocal Temperature.
![Figure 3. Relative Free Energy as a Function of the Fraction of the Surface Sites which are Occupied (After Jackson [1]).](https://thumb-eu.123doks.com/thumbv2/123doknet/14527151.532690/23.918.163.803.169.965/figure-relative-energy-function-fraction-surface-occupied-jackson.webp)
![Figure 4. Surface Free Energy of an Interface as a Function of Its Position (After Cahn [3]).](https://thumb-eu.123doks.com/thumbv2/123doknet/14527151.532690/25.918.216.818.145.1075/figure-surface-free-energy-interface-function-position-cahn.webp)
![Figure 6. Theoretical Reduced Growth Rate versus Undercooling for All Materials (After Cahn, Hillig and Sears (4]).](https://thumb-eu.123doks.com/thumbv2/123doknet/14527151.532690/30.1188.223.963.171.783/figure-theoretical-reduced-growth-versus-undercooling-materials-hillig.webp)
![Figure 8. Phase Diagram -in the Region of the Binary Compound Sodium Disilicate (After Kracek [33]).](https://thumb-eu.123doks.com/thumbv2/123doknet/14527151.532690/37.918.161.811.159.920/figure-diagram-region-binary-compound-sodium-disilicate-kracek.webp)
![Figure 9. Projection of the Crystal Structure of Sodium Disilicate in the x-y Direction (After Liebau [36]).](https://thumb-eu.123doks.com/thumbv2/123doknet/14527151.532690/39.1188.205.978.227.606/figure-projection-crystal-structure-sodium-disilicate-direction-liebau.webp)
![Figure 11. Growth Rate versus Temperature for Sodium Disilicate (After Scott and Pask [46]).](https://thumb-eu.123doks.com/thumbv2/123doknet/14527151.532690/42.1188.113.998.139.773/figure-growth-versus-temperature-sodium-disilicate-after-scott.webp)