HAL Id: hal-02503877
https://hal.sorbonne-universite.fr/hal-02503877
Submitted on 10 Mar 2020HAL is a multi-disciplinary open access archive for the deposit and dissemination of sci-entific research documents, whether they are pub-lished or not. The documents may come from teaching and research institutions in France or abroad, or from public or private research centers.
L’archive ouverte pluridisciplinaire HAL, est destinée au dépôt et à la diffusion de documents scientifiques de niveau recherche, publiés ou non, émanant des établissements d’enseignement et de recherche français ou étrangers, des laboratoires publics ou privés.
Insights into OCP Identification and Quantification in
the Context of Apatite Biomineralization
Marc Robin, Stanislaw von Euw, Guillaume Renaudin, Sandrine Gomes,
Jean-Marc Krafft, Nadine Nassif, Thierry Azaïs, Guylene Costentin
To cite this version:
Marc Robin, Stanislaw von Euw, Guillaume Renaudin, Sandrine Gomes, Jean-Marc Krafft, et al.. Insights into OCP Identification and Quantification in the Context of Apatite Biomineralization. CrystEngComm, Royal Society of Chemistry, 2020, 22 (16), pp.2728-2742. �10.1039/C9CE01972C�. �hal-02503877�
Insights for OCP Identification and Quantification in
the Context of Apatite Biomineralization
Marc Robin
a,b, Stanislas Von Euw
a, Guillaume Renaudin
c, Sandrine Gomes
c,
Jean-Marc Krafft
b, Nadine Nassif
a, Thierry Azaïs
a*and Guylène Costentin
b*a Sorbonne Université, CNRS, Collège de France, Laboratoire Chimie de la Matière Condensée de Paris,
LCMCP, F-75005 Paris, France
b Sorbonne Université, CNRS, Laboratoire Réactivité de Surface, LRS, F-75005 Paris, France c Université Clermont Auvergne, CNRS, SIGMA Clermont, ICCF, F-63000 Clermont-Ferrand, France
Abstract
Calcium phosphates (CaPs) are one of the major mineral families of wide interest in biomineralization and biomaterials development. The identification and quantification of the different CaPs phases (crystalline and amorphous) remains a major challenge in both in vitro and in vivo systems. This work aims to provide critical analysis of the different analytical techniques, Raman spectroscopy, solid-state NMR spectroscopy (ssNMR) and X-ray diffraction (XRD) that are used for the discrimination of octacalcium phosphate (OCP) from hydroxyapatite (HAp). Low amount of OCP (~10 wt%) can be detected by Raman spectroscopy in presence of biomimetic carbonated apatite (cHAp), providing that the (HPO4) contribution of weak intensity from OCP at 1008 cm-1 is observable or that spectral
decomposition of the overlapped 1(PO4) bands from OCP and cHAp is performed. However, Raman is
not suitable for quantification purpose. At reverse, the quantification of OCP in proportions down to 10 wt% is easily performed with 31P solid state NMR. Opposite to solid state NMR, Raman can be
implemented under in situ conditions to follow the time dependence of the biomineralization process without any sampling perturbation. An approach combining the advantage of in situ micro-Raman spectroscopy and the sensitivity of ex situ solid state NMR was used to monitor the formation of biomimetic carbonated apatite from an acidic aqueous solution of phosphate, carbonate and calcium ions. In relationship with the progressive increase of pH, we identify the transient phases, precursors of cHAp: it is shown that an amorphous calcium phosphate phase (ACP) is first formed and subsequently transformed into OCP that then progressively turns into cHAp. Finally, powder X-ray diffraction coupled to Rietveld refinement was found very powerful to quantify very few amount of residual OCP in cHAp (down to 2 wt%). Upon the OCP transformation into cHAp, the decrease of the relative intensity of the (100) diffraction peak of the transient OCP phase was ascribed to an alteration of its hydrated layers, related to an incorporation of water molecules and/or carbonate anions upon reaction time. Such carbonate uptake in the course of transformation of OCP into cHAp could explain the origin of carbonate substitutions in the final biomimetic carbonated apatite.
Introduction
The unambiguous identification and quantification of CaP phases (crystalline or amorphous) formed in biomaterials development and in biomineralization context is of wide interest but remains challenging in both in vitro and in vivo system.1 Biomimetic carbonated hydroxyapatites (cHAp) are
considered as model of bone mineral because of their structural similarities as cHAp are carbonated, Ca-deficient and poorly crystalline.2-4 Biomimetic cHAp particles also exhibit a nanometric size, a
platelet shape and a core/layer organization where a hydrated amorphous calcium phosphate-like layer coats an apatite crystalline core.5 Several mechanisms have been proposed for the formation of
biological apatite in particular through the investigation of in vitro systems.6-9 It is proposed that
synthetic cHAp and biological apatite results from the transformation of metastable CaP phases considered as precursor phases. Specifically, octacalcium phosphate (OCP) is found to precede apatite formation in vitro6, 10-13 and is proposed as a transient biological apatite precursor in vivo.14-16 Similar
considerations are made for amorphous calcium phosphate (ACP) both in vitro9, 17-20 and in vivo.21-23
Infrared (IR)24-28 and Raman12, 27-35 spectroscopies, electronic microscopies36, 37 and X-ray
diffraction (XRD)38-40 are widely used to characterize the nature of mineralized phases in biological
tissues, cell cultures and biomaterials. Nevertheless, the close crystallographic structures of OCP and cHAp phases39 makes the unambiguous distinction of OCP from cHAp difficult when using these
techniques. As an example, the superposition of OCP and cHAp X-ray diffraction patterns at wide angles, combined with nanometric size of the mineralized phases, is problematic. In a similar way, the overlap of the main 1PO4 phosphate Raman bands of the various CaP phases makes difficult the
unambiguous identification of the different CaP phases although Raman spectroscopy is widely used in the biomineralization field14, 16, 41, 42 as it allows the study of hydrated and living materials. Thus,
questions remain on the possibility to discriminate the distinct CaP phases in vivo. In contrast, solid state NMR (ssNMR) has been shown to be an efficient tool to identify the various CaP phases including ACP, OCP and synthetic and biogenic HAp5, 13, 43-49 due to distinct 31P resonances. Moreover, ssNMR can
potentially provide quantitative data, but there is no reported data yet on its detection limit for the quantification of CaP phases.
Besides the difficulty in identifying and quantifying the presence of different CaP phases, another challenge is to monitor the precipitation of the CaP phases over time without any perturbations. Thus, it is of main interest to find suitable analytic tools to unambiguously distinguish and quantify cHAp from their precursor CaP phases, in particular amorphous calcium phosphate (ACP) and OCP, in both synthetic and biological-relevant media.
In this work, we provide a suitable and relevant approach for the identification and quantification of cHAp precursors (ACP and OCP) and the monitoring of their transformation into cHAp in a bioinspired context.50 First, physical powder mixtures of various proportions of OCP and cHAp were
used as references to compare the ability of Raman and 31P ssNMR to detect and quantify the presence
of OCP vs. cHAp. Then, the advantages of the two spectroscopies (i.e. (i) real-time tracking and absence of perturbation of the reaction for in situ Raman, and (ii) easier discrimination and quantification of the CaP phases for ex situ NMR) were beneficially combined to monitor the precipitation processes of biomimetic cHAp. The progressive pH increase of an acidic calcium, phosphate and carbonate solution resulted in the precipitation of CaP phases that could be identified and quantified. Finally, Rietveld refinement analysis on X-ray powder diffraction (XRPD) data allowed to push up the detection limit of residual OCP present in cHAp and to discuss subtle structural modifications of OCP during its transformation into cHAp.
Experimental section
Synthesis of biomimetic carbonated apatite (cHAp) and octacalcium phosphate (OCP)
The cHAp synthesis was performed according to the procedure described by Nassif et al. (referred as HA-2).50 Experiments were carried out at 22 ± 1 °C. Briefly, a solution of 110 mM CaCl
2, 33
mM NaH2PO4 and 33 mM NaHCO3 was prepared in distilled water in order to preferentially synthesize
B-type biomimetic carbonated apatite (cHAp) (where carbonates are substituting phosphate groups).4
The pH was adjusted to 2.2 with 12 M HCl. Two flasks (35 mL, height = 50 mm) containing these solutions (20 mL) and covered by perforated Parafilm (to slow down the gas diffusion) were placed into a closed chamber (1000 cm3). The precipitation was triggered via the slow increase of the pH of
the solution induced by the diffusion of vapors of fresh ammonia aqueous solution (30% wt/ 8 mL) in the chamber. In the present work, few drops of a universal indicator solution pH (Fluka-31282) were added to visually follow the evolution of pH gradient upon reaction time. A few minutes after ammonia introduction, precipitation occurs in the solution. After 6 days, the pH is 10 and the solid was washed and centrifuged (6000 rpm, 10 min) first in distilled water and then in ethanol to remove the non-precipitated salts. The recovered powder was dried at 37 °C for 48 hours before characterization. This sample is hereafter referred to as cHAp.
In order to prepare cHAp with very low amount of residual OCP, several experiments were reproduced using similar protocol, but the syntheses were stopped before completion of the reaction and then sampled as described above after 1, 2 and 3 days. Samples are hereafter referred to as cHAp-1d, cHAp-2d and cHAp-3d, respectively.
The synthesis of pure OCP was performed according to the procedure described by Bigi et al.
51 It consists of the dropwise addition (1 drop per second) of 500 mL of Ca(CH
3COO)2 0.04 M into 1500
mL of a phosphate solution containing 10 mmol of Na2 HPO4 and 10 mmol of NaH2PO4, with a starting
pH of 5. The reaction was performed at 70° C without stirring. The precipitate was then left in contact with the mother solution for 15 min, filtered, washed with doubled distilled water, and dried at 37° C.
Various proportions of cHAp and OCP powders were intimately grounded in an agate mortar. The resulted physical mixtures were immediately characterized.
Ex situ Micro-Raman, in situ Raman spectroscopies and spectral decomposition
Ex situ micro-Raman analysis was performed on cHAp, OCP and physical mixtures of OCP/cHAp
powders. Spectra of these samples were collected from a KAISER Optical system equipped with a charge coupled detector (CCD) and a LASER with λ = 785 nm (Psample ~ 1 mW, resolution = 4 cm-1
accumulation time = 20 s, 5 scans per spectrum) coupled with a microscope with a 50x lens.
In situ Raman spectroscopy was used to monitor the evolution of CaP precipitation during the
cHAp synthesis previously described. Spectra of the samples were collected using the same KAISER Optical system (P = 10-12 mW, resolution = 4 cm-1 accumulation time = 150 s, 6 scans per spectrum, 1
spectrum every 16 minutes) using a fiber optic Raman probe equipped with a sapphire optical lens. The probe was directly immersed in the ionic solution as show in Figure S1 prior to ammonia exposure and was left immobile during the CaP precipitation to prevent any deviation from the initial procedure. Time zero corresponds to the moment ammonia was introduced in a closed chamber.
Solid-State Nuclear Magnetic Resonance
Solid state nuclear magnetic resonance (ssNMR) experiments were performed on an AVANCE 500 Bruker spectrometer (B0 = 11.7 T) operating at ν(1H) = 500.13 MHz and ν(31P) = 202.40 MHz. The
powder samples (OCP/cHAp physical mixture) were packed into 4 mm zirconia rotors and spun at a magic-angle-spinning frequency of MAS = 14 kHz. The 31P NMR spectra were recorded through a single
pulse experiment (/6 = 1.3 µs) of 32 added scans acquired with proton-decoupling (SPINAL-64; vRF(1H)
= 70 kHz). A recycle delay RD of 200s was used in order to obtain quantitative 31P spectra.
For the ex situ monitoring, wet samples were carefully extracted from the cHAp precipitation medium with a syringe and a 25G needle thus limiting the convection movements in the reaction flask.
in-between two Teflon spacers and their 31P ssNMR spectra immediately recorded. 31P single pulse
NMR experiments were performed in similar conditions (except MAS = 8 kHz and 32-200 scans
depending on the signal-to-noise ratio). In addition, 1H-31P cross-polarization (CP MAS) experiments
were performed on cHAp still containing some OCP as a contaminant phase (1d, 2d, cHAp-3d) using a contact time tCP of 1 ms (typically RF(1H) = 55 kHz and RF(31P) = 45 kHz, RD = 2s). 2D 1H-31P
HetCor experiment was recorded at MAS = 8 kHz with similar conditions and using 180 t1 increments
of 80 scans.
For all NMR experiments, 1H and 31P chemical shift was referenced (δ = 0 ppm) to TMS and 85 wt%
aqueous H3PO4, respectively.
Decomposition of Raman and NMR spectra
The decomposition of Raman and NMR spectra was performed using the Dmfit program.52 The spectra
of the reference samples OCP and cHAp were fitted first. The resulted positions, linewidths and relative intensities of the reference bands or resonances were kept constant for the decomposition of the physical mixture spectra.
X-rays powder diffraction (XRPD)
XRPD patterns were recorded on a PANalytical X’Pert Pro diffractometer, with θ-θ geometry, equipped with a solid X-Celerator detector and using Cu K radiation ( = 1.54184 Å) with a ¼° divergence and a 5.5 mm anti-scatter slits. XRPD patterns were recorded at room temperature in the interval 3° < 2θ < 120°, with a step size of 0.0167° and a counting time of 200 s for each data value. A total counting time of about 200 min was used for each sample. A XRPD pattern was collected from pure NIST standard LaB6 using the same experimental conditions in order to extract the instrumental
resolution function to improve peak profile fitting during Rietveld refinements using a pseudo-Voigt profile function.
Rietveld refinements were performed with the program Fullprof.2k53to determine the relative
proportions of OCP and hydroxyapatite in cHAp-1d, cHAp-2d and cHAp-3d. The structural parameters of hydroxyapatite, Ca5(PO4)3∙OH, were taken from ref.54: space group P63/m, Z = 2, a = 9.4218 Å and c
= 6.8813 Å, 7 independent non-H atomic positions: two Ca, one P and four O positions. The O4 oxygen position (i.e. the hydroxyl anion) is half occupied; this corresponds to a statistically disordered 4e position around the 2a (0,0,¼) site. The structural parameters of OCP, Ca8(HPO4)2(PO4)4(H2O)5, were
taken from ref.40: space group
P
1
, Z = 2, a = 19.692 Å, b = 9.523 Å, c = 6.835 Å, = 90.15°, = 92.54°and = 108.65°, 44 independent non-H atomic positions: eight Ca, six P positions and thirty O positions (from which five positions correspond to water molecules). In order to lighten, and thus make stronger and more stable, the modeling process of the experimental diffraction data, the apatite phase was considered as non-substituted hydroxyapatite; and not a carbonated Ca-deficient hydroxyapatite which requires introducing additional parameters to be – not easily – refined. This simplification of the model is justified by the preservation of the hexagonal P63/m symmetry in the case of a B-type cHAp.55, 56 In a first step, the structural parameters were fixed to literature values. Then during the successive
refinement cycles, all hydroxyapatite parameters were refined: first lattice parameters and peak profiles, next atomic parameters (positional, isotropic temperature and occupancy factors), and finally anisotropic peaks broadening. Due to the nanometric feature of the coherent domain size, the low symmetry of the OCP structure and the numerous independent crystallographic sites, structure parameters of OCP were kept fixed to literature values. Peak broadening, peak asymmetry and preferential orientation were systematically refined. To improve powder pattern refinements of cHAp-1d, cHAp-2d and cHAp-3d samples, and in particular to account for the unusual weak intensity of the (100) reflection compared to (110) and (010); respectively at 2 = 4.55°, 9.55° and 9.73°, Rietveld simulations were finalized by varying the electronic density within the OCP hydrated layer. Expressing the electronic density as n equivalent of water molecules, underhydrated and overhydrated OCP-based phases were investigated by formally removing or adding water molecules from the OCP nominal
related water crystallographic sites (O25 to O30 oxygen crystallographic sites from ref 40), simulations
were performed on the following compositions: Ca8(HPO4)2(PO4)4 (anhydrous composition obtained by
removing the electronic weight on the six water crystallographic sites), Ca8(HPO4)2(PO4)4.(H2O)4 (by
removing the electronic weight onto the water crystallographic site along the hexagonal channel), Ca8(HPO4)2(PO4)4.(H2O)6 (by formally doubling the electronic weight of the water crystallographic sites
into the hexagonal channel) and Ca8(HPO4)2(PO4)4.(H2O)10 (by doubling the electronic weight of the
whole water crystallographic sites).
Results and discussion
1 Detection limits in physical mixtures of OCP and cHAp
1.1 Limitation in the OCP vs. cHAp discrimination using Raman spectroscopy
To evaluate the ability of Raman spectroscopy to address the detection of OCP in the presence of biomimetic apatite, Raman spectra of OCP/cHAp physical mixtures in various proportions were recorded. The recorded spectra of pure OCP (Ca8(PO4)4(HPO4)2.5H2O) and cHAp phases (Fig. 1) are in
agreement with the typical Raman spectra reported in the literature (Table 1).10, 27, 32 Concerning OCP,
the 1PO4 double band at 955 and 964 cm-1 is characteristic of the OCP phase (see the spectral
decomposition in Fig. 1 green inset).12, 29-31 The other vibration modes ascribed to (PO
4) and (HPO4)
moities are observed as broad massives of weak intensity.27 The requirement for numerous
contributions for their decomposition is probably significant of the geometrical distortion of the related PO4 tetrahedra. Note the absence of any carbonate contribution around 1070 cm-1 in the pure
Figure 1. Raman spectra of octacalcium phosphate (OCP, green) and biomimetic apatite (cHAp, red).
The green and red insets display the spectral decomposition (in the 890-1010 cm-1 region) of OCP and
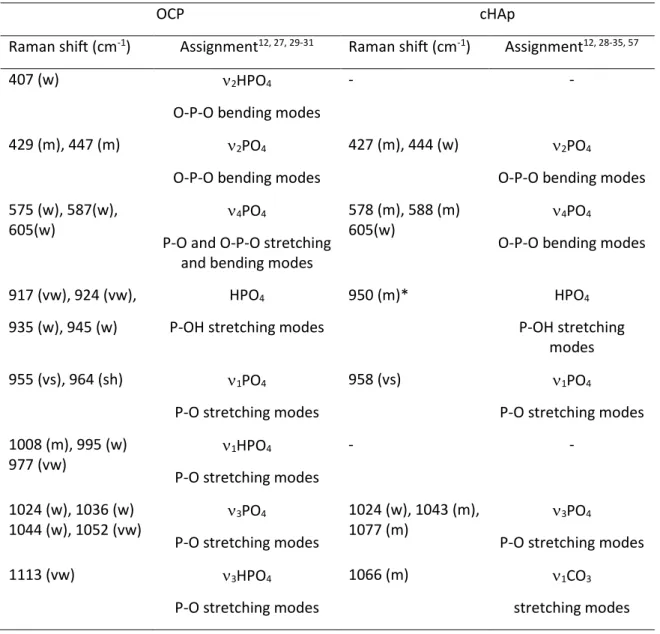
Table 1. Positions of the Raman contributions obtained from Fig. 1 for OCP and cHAp and assignment
based on literature data.
OCP cHAp
Raman shift (cm-1) Assignment12, 27, 29-31 Raman shift (cm-1) Assignment12, 28-35, 57
407 (w) 2HPO4
O-P-O bending modes
- -
429 (m), 447 (m) 2PO4
O-P-O bending modes
427 (m), 444 (w) 2PO4
O-P-O bending modes 575 (w), 587(w),
605(w)
4PO4
P-O and O-P-O stretching and bending modes
578 (m), 588 (m) 605(w)
4PO4
O-P-O bending modes
917 (vw), 924 (vw), 935 (w), 945 (w)
HPO4
P-OH stretching modes
950 (m)* HPO4
P-OH stretching modes 955 (vs), 964 (sh) 1PO4
P-O stretching modes
958 (vs) 1PO4
P-O stretching modes 1008 (m), 995 (w)
977 (vw)
1HPO4
P-O stretching modes
- -
1024 (w), 1036 (w) 1044 (w), 1052 (vw)
3PO4
P-O stretching modes
1024 (w), 1043 (m), 1077 (m)
3PO4
P-O stretching modes
1113 (vw) 3HPO4
P-O stretching modes
1066 (m) 1CO3
stretching modes vw= very weak; mw= medium weak; m=medium; s=strong; sh=shoulder;
*contribution assigned to ACP10
On the other hand, the Raman spectrum of biomimetic cHAp exhibits an asymmetrical-shaped 1PO4 band centered at 958 cm-1 29-35 that can be decomposed into a main component at 958 cm-1 and
a broader one at 950 cm-1 characteristic of crystalline hydroxyapatite28 and ACP phase,10 respectively.
As it has been recently evidenced that these biomimetic cHAp nanoparticles are composed of a crystalline apatitic core coated by an ACP-like layer,58 we assign the sharp band at 958 cm-1 to the
3PO4 contributions, ranging from 1010 to 1090 cm-1 overlap with the 1CO3 contribution of carbonates
at 1066 cm-1 (Fig. 1, red inset, Table 1).57 This detected carbonate contribution (absent in the case of
the OCP spectrum) is coherent the carbonation expected for cHAp (~5 wt% as reported previously50).
To estimate the sensitivity of the Raman spectroscopy to detect OCP in presence of cHAp, spectra OCP/cHAp physical mixtures with various relative proportions were recorded (Fig. 2a). Based on the visual tracking of the characteristic shoulder of OCP at 964 cm-1, the presence of OCP is only
clearly detectedfor high OCP content (≥ 70 wt%). For lower OCP content, a slight shift of the maximum of the 1PO4 band is observed due the overlapping with those from cHAp. In contrast to stoichiometric
crystalline hydroxyapatite,28the low crystallinity of cHAp results in the broadening of the Raman
bands32, 59 that even increases the overlap with those from OCP, making ambiguous the identification
of the two phases. Hence, unless OCP is largely predominant (≥ 70 wt%), OCP cannot be readily identified in the presence of biomimetic carbonated apatite through the visual observation of the 1PO4 Raman bands.
Figure 2. Raman spectra of various OCP/cHAp physical mixtures: (a) 1PO4 region and (b) zoom of the
region of the HPO4/CO32- contributions.. Green doted lines and red solid line represent OCP and cHAp
To allow overcoming such visual limitation (Fig.2a), other Raman bands such as those centered at 407 cm-1 and 1008 cm-1 characteristic of the OCP structure (respectively ascribed to
2HPO4 and
n1HPO4 vibrations modes) could be considered (Table 1). However, only that at 1008 cm-1 is well
resolved from other contributions present in HAp (Fig.1). Despite its low relative intensity compared to the main ν1 PO4 bands (Fig.1), this contribution may be particularly useful to probe the presence of
OCP due to the absence of signal in this region for cHAp. Hence, according to the zoom of this region (Fig.2b), OCP is clearly detected from 10 wt% and its intensity increases with the OCP content. However, considering the low absolute intensity of this contribution, its detection requires peculiar attention to optimize the S/N ratio. In addition, in the context of in situ Raman measurements implemented in biomineralization systems as cell cultures16, 41 or tissue cultured ex vivo,14 other
overlapping contributions originating from organic compounds make difficult the use of this spectral region to conclude on the presence of OCP.
To overcome this difficulty, an alternative to improve the detection limits of OCP in presence of cHAp consists in spectral decomposition of the 1 PO4 region. The experimental spectra of OCP/cHAp
physical mixtures were fitted starting from the positions, linewidths and relative intensity of the two 1 PO4 components extracted from the spectra related to pure substances OCP and cHAp (Fig. 1, Fig.
S2a, b). As illustrated in (Fig. S2c and S2d), the introduction of the two sets of components corresponding to OCP and cHAp is required to fit the experimental spectra of the physical mixtures (OCP/cHAp: 10/90 and 40/60, respectively): thus low OCP content (10 wt%) can be qualitatively detected by Raman providing spectral decomposition is processed. However, despite quite good accuracy of the spectral decomposition of the physical mixtures spectra, the extracted areas of the fitted contributions of the two sets of components corresponding to OCP and cHAp do not lead to accurate semi quantification (Fig. S2c and S2d). This confirms that due to dependence of the signal to numerous parameters other than concentration such as surface/volume ratio, diffusion of the particles, Raman is not suitable for quantification purpose.
1.2. Identification and quantification of OCP from cHAp using 31P ssNMR
Unlike their Raman signals, the 31P ssNMR resonances of OCP and cHAp exhibit distinct
chemical shifts. The 31P ssNMR spectrum of pure OCP exhibits typical resonances at 3.3 and 3.0 ppm
for the phosphates from the apatitic layers (sites P4 and P1, respectively, according to Davis et al.44)
and at 1,7, -0.1 and -0.3 ppm from the hydrated layers (P2, P6 and merged P3 and P5, respectively, according to Davis et al. 44) while pure cHAp is characterized by a resonance at 2.8 ppm.
Figure 3. 31P single pulse MAS spectra of various OCP/cHAp physical mixtures. Green doted lines and
Contrary to Raman, small proportions of OCP in OCP/cHAp physical mixtures are readily detected through 31P MAS NMR (Fig. 3) due to the 31P resonances of OCP hydrated layers (1.7 and
-0.3 ppm). As an example, the presence of 10 wt% of OCP is unambiguously detected with 31P ssNMR
without additional data processing.
In principle, NMR spectroscopy allows the extraction of quantitative data (i.e. the relative proportion OCP/cHAp) from the 31P single pulse MAS NMR spectra. The Figure S3a displays the
decomposition of the various spectra of the physical mixture OCP/cHAp. Spectra were fitted by keeping constant (i) position and linewidth of the 31P resonances of cHAp and OCP extracted from the pure
cHAp and OCP spectra, (ii) as well as the relative intensities of the several phosphorus resonance contributions of the OCP. Unlike in the case of Raman spectra, the good accuracy of the fits performed for mechanical mixtures whatever the mass ratio and even at low amount of OCP (10/90) (Fig. S3a) allows the establishment of a calibration curve (Fig. S3b) to extract quantitative data based on 31P
NMR.
2. Monitoring the precipitation of biomimetic apatite over time
2.1 Combination of in situ Raman and ex situ ssNMR
Monitoring the carbonated apatite formation over time remains a great challenge in bone biomineralization. This is mainly due to the process of bone remodelling that leads to the continuous deposition and dissolution60 of the mineral, but also by the fact that mineral undergoes extensive
chemical post-modifications after their synthesis and initial deposition.61 Mineral crystallites with
poorly crystalline structure are subject to maturation processes involving changes in their chemistry and coherent domain size.62 Thus, studying bioinspired protocols is of great interest to improve
knowledge on apatite biomineralization. Here, we rely on a biomimetic synthesis of cHAp already published in the literature,50 where cHAp is obtained starting from an acidic aqueous solution of
through the slow dissolution of NH3 vapours into the reactants solution as illustrated by the color
evolution in the presence of few drops of a universal indicator added in the solution (see video S4, Fig.S4). The final cHAp product is obtained after 6 days of reaction.
In the following, we take advantage of the both analytical techniques, Raman (easy implementation, including under in situ conditions in liquid medium thanks to the use of fiber optic Raman probe) and
31P ssNMR (identification, quantification) to monitor cHAp precipitation. Indeed, the sensitivity of
Raman spectroscopy allows the recording of successive spectra at short time intervals and thus the in
situ study of CaP minerals formation.12, 31, 63 Due to our synthesis protocol, the originality of the present
in situ Raman set-up relies on the fact that the Raman probe is directly immersed into the reacting
solution (Fig. S1). Hence, the conversion of CaP precursors into biomimetic cHAp is continuously monitored. Complementary, at relevant time points identified thanks to in situ Raman, ex situ 31P
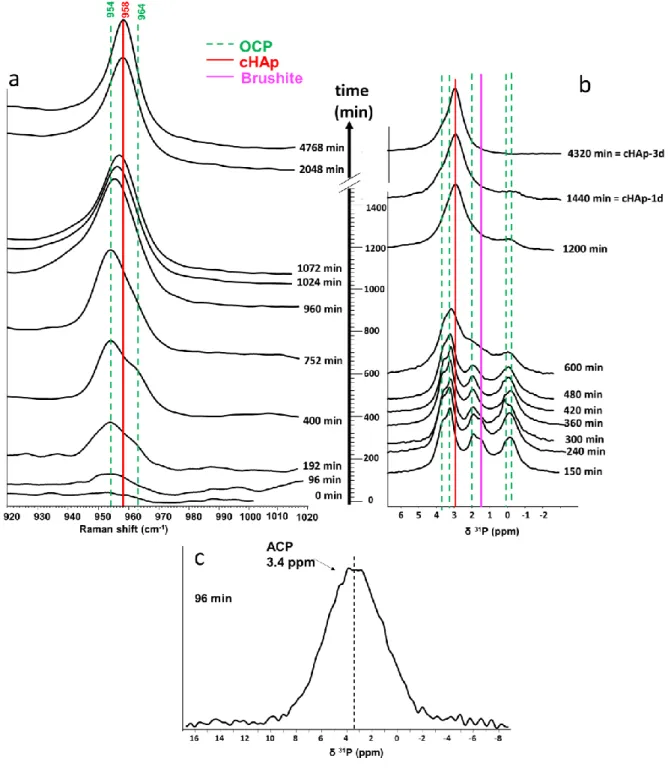
ssNMR analysis were used as “analytical snapshots” to complement the identification and quantification of the CaP phases. Selected Raman and 31P ssNMR spectra are displayed in Fig. 4a and
Figure 4. The precipitation of biomimetic apatite is monitored using a combination of (a) in situ Raman
and (b). ex situ 31P single pulse MAS ssNMR. Green doted lines, red solid line and pink solid line represent
the OCP, the apatite and the brushite contributions, respectively. (c) 31P CP MAS NMR spectrum
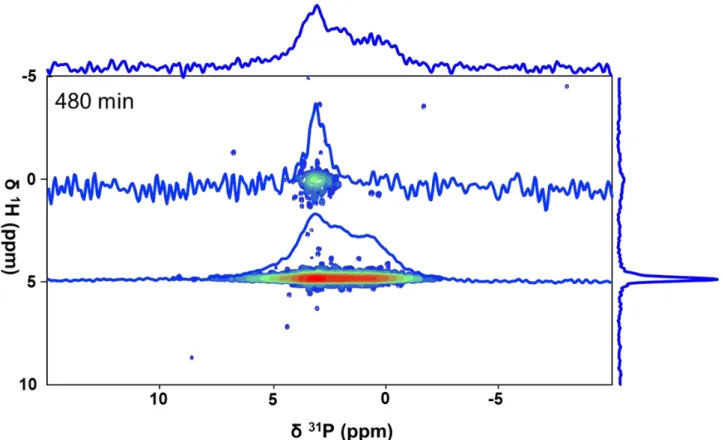
Figure 5: 2D 1H-31P HetCor experiment (1 ms contact time) recorded after 480 min. together with 31P
1D spectra extracted at (1H) = 0 ppm (OH- from cHAp) and (1H) = 5 ppm (water molecules from OCP).
Table 2. Evolution of the positions and FWHM of the main Raman band upon reaction time
Time (minutes) Shift (cm-1) FWHM (cm-1) 96 ~954 - - 192 954 964 17 400 954 964 17 752 954 964 19 960 955 - 18 1024 956 - 14 1072 957 - 12 2048 958 - 12 4768 958 - 11
Formation of amorphous calcium phosphate phase (0-96 min)
After 96 min, a precipitate forms at the bottom of the flask that displayed a very weak Raman signal around 954 cm-1. The nature of the precipitate is difficult to determine by Raman although it
might correspond to a disordered CaP phase10, 12, 31 (Fig. 4a The corresponding 31P single pulse NMR
spectrum is not reported in Fig. 4b due to very low intensity of the related signal. However, the amorphous nature of the precipitate was confirmed by the corresponding 31P CP MAS spectrum that
exhibits a broad Gaussian line shape (FWHM 900 Hz) centred at 3.4 ppm, which is characteristic of an amorphous calcium phosphate phase64 (Fig. 4c). This result is consistent with data from the
literature showing that apatite precipitation in vitro can involve the formation of an initial disordered phase that subsequently crystalizes into a less soluble and more ordered phase.31, 65
Formation of brushite and OCP phases (96-480 min)
Then, as the pH increases up to ~ 5 value (Video S4, Fig.S4), this unstable ACP progressively transforms into OCP (double Raman band at 954/964 cm-1 -see spectrum after 192 minutes, Fig. 4a).
The observation of OCP, resulting from the transformation of ACP, as a precursor of apatite is coherent with the literature.11, 12, 31, 66 Note that the corresponding Raman bands are slightly broader compared
to the reference OCP powder (FWHM = 19 vs 15 cm-1) suggesting a less crystalline nature. In addition,
in these in situ recording conditions, the S/N is poor and the HPO4 contribution characteristic of OCP
(see section 1) expected at 1008 cm-1 is not detected. Ex situ 31P ssNMR confirms that OCP is formed
in this time interval as the characteristic 31P chemical shifts of the OCP phase are observed from 150
minutes of reaction (Fig. 4b). In accordance with Raman features, broader 31P OCP resonances are
observed compared to the OCP reference sample confirming the poorly crystalized nature of OCP formed at this step of the precipitation process. In addition, brushite (DCPD) is observed after 150 min by 31P ssNMR (characteristic signal at 1.4 ppm) but is not detected anymore after 300 min (Fig. 4b).
contribution at 987 cm-1)67 but was evidenced as intermediates during ACP to OCP transformation in
hanging drop vapor diffusion experiments.31
OCP transformation in cHAp (480 min-end)
According to in situ Raman and ex situ 31P ssNMR, the transformation of OCP into cHAp seems
to start long after 480 min. Indeed, the corresponding spectra (in situ Raman after 400 min and ex situ
31P ssNMR after 480 min) still exhibit the characteristic signals of OCP (Fig. 4a,b). However, according
to two-dimensional ssNMR experiment (1H-31P HetCor), cHAp is already present in the medium after
480 min (Fig.5): if OCP is noticeably highlighted (correlation signal at (1H) = 5 ppm), a small amount
of cHAp is also evidenced through the characteristic correlation signal at (1H) = 0 ppm.
The transformation of OCP into cHAp is becoming evident on one-dimensional spectra starting from 752 min as shown by the modification of the Raman signal shape (Fig. 4a). If the maximum of the 1PO4 band from OCP is still detected at 954 cm-1 up to 960 min, the associated shoulder at 964 cm-1 is
not clearly observed after 752 min (Table 2). This is significant of a growing contribution at 958 cm-1
related to the formation of cHAp. Then, the band maximum is progressively shifted to higher wavenumber, finally reaching 958 cm-1 (typical value of cHAp) after 1072 min of reaction.
Ex situ 31P ssNMR provides complementary data on the temporal evolution of OCP
transformation into cHAp. In accordance with Raman data, we observe a strong modification of the 31P
OCP resonances after 600 min. First, the 31P OCP linewidths increase suddenly after 600 min, then, the
maximum of the 31P signal is shifted to reach the characteristic value of cHAp ((31P) = 2.8 ppm) after
1200 min. The enlargement of the resonances indicates a deep modification of the OCP structure through the increase of the local disorder around the phosphate sites upon cHAp formation. However, the transformation of OCP into cHAp is not fully accomplished after 1440 min as the characteristic resonances of P3,P5,P5 sites around 0 ppm are still visible on the 31P ex situ ssNMR spectra. The
transformation seems to be fully completed after 2048 min (Raman data: 1PO4 = 958 cm-1) and is
confirmed by 31P ssNMR after 4320 min (3 days of reaction).
According to the calibration curve obtained from the OCP/cHAp physical mixtures (Fig. S3b), and spectral decomposition (Fig S5) the OCP weight proportion is estimated to 45, 26 and 16 wt% (± 10) at 600, 1200 and 1440 min, respectively. Note however, that decomposition of the spectra is not as accurate as in the case of physical mixture, due to the broadening and shifting of some OCP 31P
resonances. Especially the contributions at low chemical shift that are characteristic of the phosphates located in the hydrated layer of OCP are not accurately simulated. This strongly suggests a modification of the OCP structure along the precipitation route, as investigated below.
To sum up this study, cHAp precipitation in our conditions starts with the formation of ACP that turns into OCP (and brushite) and finally into cHAp. Such a sequence of formation of brushite and OCP (pH~5), then of cHAp (pH~9) (Fig. S4) is consistent with what is expected from the speciation diagram of phosphate ions in solution.68 Such evolution of ACP into cHAp through transient OCP
formation was already reported, but either through ex situ Raman measurements12 that implied
washing steps that might have led to some changes in the chemical nature of the precipitates or under specific conditions (hanging drops vapor diffusion system)31 that are representative of tiny amounts of
matter and may induce different precipitation kinetics. Here, in situ Raman spectroscopy avoids these misleading experimental features, but it appears to be less sensitive compared to ssNMR to precisely identify cHAp at early stage of formation and residual OCP in presence of cHAp. This emphasizes the advantage to combine in situ and ex situ sensitive spectroscopic technics to detect OCP in small amount in the course of its transformation into cHAp. Moreover, the recording of 2D 31P HetCor NMR
experiments appears useful to track the early stages of cHAp formation. We also note that the OCP phase persists up to 1440 min (i.e. 1 day) of reaction. Thus, OCP can be considered as a potential contaminant phase of cHAp in our conditions of precipitation. Using in situ Raman and ex situ 31P
ssNMR, the determination and quantification of this potential contaminant phase ( 10 %) is particularly difficult. Other analytical techniques might be used to access tiny amount of OCP.
2.2. Pushing up the detection limit of ssNMR by cross polarization
Many apatites obtained by precipitation likely to mimic biological apatites involve the formation of OCP.6, 10, 11 Hence, OCP resulting from the incomplete transformation into carbonated
apatite may exist as a persistent phase in the final material although not detected. In our conditions, the complete transformation of OCP into cHAp is achieved after 6 days. Hence, samples obtained after 1, 2 and 3 days (cHAp-1d, cHAp-2d and cHAp-3d, respectively) i.e. before total completion of cHAp precipitation are likely to contain low amounts of OCP. If after 1 day of reaction (1440 min) 16 ±10 wt% of OCP in cHAp-1d are estimated by 31P ssNMR (Fig. S3b, Fig. S5), after 3 days (4320 min) both Raman
and 31P ssNMR failed to detect traces of OCP in cHAp-3d.
In order to push up the detection limit of OCP, cHAp-1d, cHAp-2d, cHAp-3d and cHAp samples were analyzed by 1H-31P CP MAS NMR (Fig. 6). Although non quantitative, 1H-31P CP MAS NMR is much
more sensitive than 31P single pulse experiments to protonated phosphates.
As a consequence, 31P resonances of phosphates within the OCP structure in protonated
environments (P2 and P3, P5, P6 signing at δ(31P) = 1.7 and -0.3 ppm, respectively) are highlighted at
short contact time (1 ms) (Fig.6). It clearly confirms that the OCP transformation into cHAp is totally achieved after 6 days in our conditions. Conversely, OCP is still present as a contaminant phase up to 3 days of reaction (i.e. in cHAp-1d, cHAp-2d and even in cHAp-3d).
Figure 6. 1H-31P CP MAS (contact time = 1 ms) spectra of cHAp-1d, cHAp-2d, cHAp-3d (incomplete OCP
to cHAp transformation) and cHAp (reference sample). Red full line and green dotted lines represent the 31P resonances of cHAp and OCP (P2 and P3, P5, P6, according to Davies et al.44), respectively.
2.3. Structural and quantitative investigations of residual OCP using XRPD and Rietveld refinement
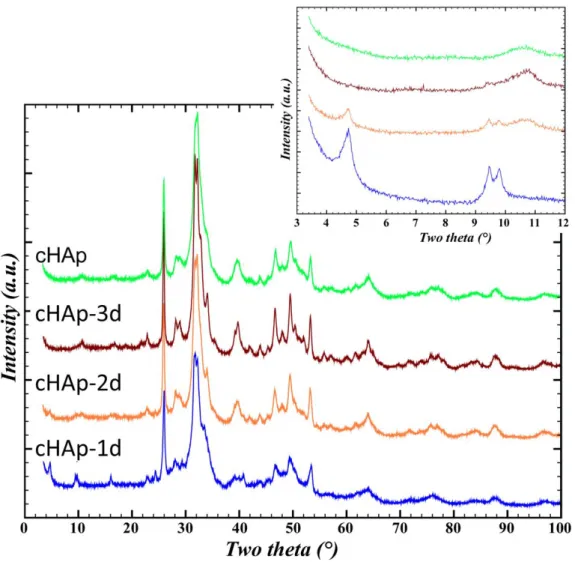
The use of X-ray diffraction to determine the presence of a minor phase of OCP along with cHAp is also challenging, because most of the reflections from these two crystalline phases overlapped within the angular range (2θ) of 10°-60°. Moreover, the diffraction peaks broadening due to nanometric coherent domain sizes increases this difficulty (Fig. 7). To overcome these difficulties, the low angular range (2θ) of 4°-10° was considered since three reflections are specific to OCP: Bragg peak (100) at 2θ = 4.7°, (
0 1
1 ) at 9.5° and (010) at 9.8°, with the following relative intensities : 100%, 8% and 8%, respectively (see PDF card number 01-079-0423 and ICSD data 65347). This low angular region is rarely available
conventional diffractometers. From Fig. 7, inset, the presence of OCP is unambiguously confirmed in 1d and 2d thanks to the detection of peaks in the 3-10° 2 region, but the case of cHAp-3d is more questionable on this sole basis.
We performed Rietveld refinement analysis on XRPD data collected from these different cHAp samples. Beforehand, the OCP crystal structure (firstly resolved by Brown,39 and further improved by
a single crystal study by Mathew et al. 40) was checked on the pure OCP phase (reference sample). The
adequacy between our synthetic OCP sample and the Ca8(HPO4)2(PO4)4∙5H2O model crystal structure40
is shown by comparison of the cell parameters reported in Table S6. The refined preferential orientation allowed the adequate modeling of the experimental OCP powder pattern as seen on Figure S6 and expressed by good Rietveld agreement factors (Table S6). This is significant of the platelet crystal growth in the [100] direction which overexposed the intense (100) diffraction peak. Such a platelet morphology coherent domain is explained by the layered structure of OCP displaying alternatively “apatitic layers” and ‘hydrated layer’ along the a axis as shown in Fig. S7.
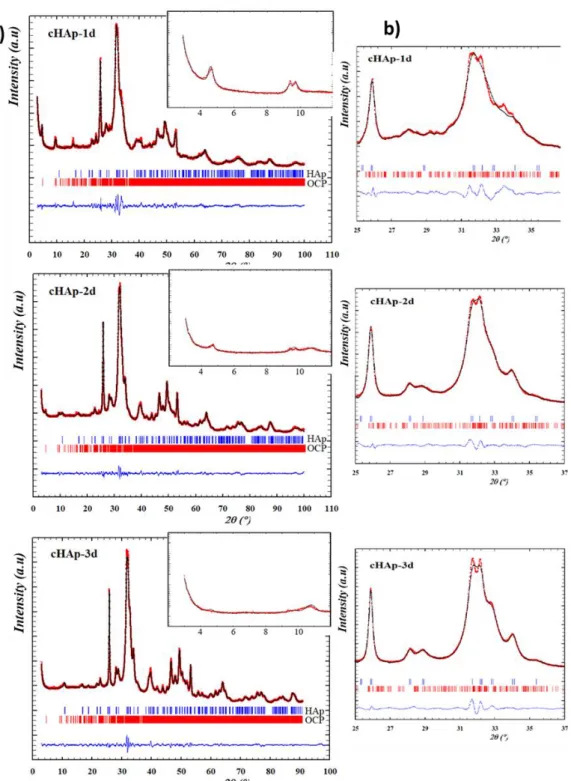
Figure 7. X-ray diffraction powder patterns of cHAp-1d, cHAp-2d and cHAp-3d (powders containing OCP
as a contaminant phase) and cHAp. The inset shows the zoom in the 3.5-12° 2 range.
Rietveld refinements were undertaken in order to determine the relative proportions of OCP/cHAP present in cHAp-1d, cHAp-2d and cHAp-3d samples. Surprisingly, compared to what is found for the reference OCP sample (Fig. S6), in the case of cHAp-1d and cHAp-2d the intensity of the OCP (100) diffraction peak at 4.7° 2 is strongly reduced in comparison with that of the (110) and (010) peaks (9.5°, 9.8°, respectively) (Fig. 7 inset). Preferential orientation correction was considered, but was insufficient to model accordingly the relative intensity of the first diffraction peak. Thus, we assume that such a decrease of the relative intensity of the (100) diffraction peak is indicative of a modification of the OCP structure during the transformation into cHAp. To further investigate this
assumption, the variation of the electronic density in the OCP hydrated layer was simulated (Fig. S8; the electron density being formally transposed to an equivalent number of water molecules). We observe that increasing the electronic density in the interlayer space results in a significant decrease of the relative intensity of the (100) diffraction peak (compared to the pure OCP structure Ca8(HPO4)2(PO4)4∙5H2O) whereas the intensity of other diffraction peaks were not strongly impacted,
in particular the (110) and (010) peaks. These simulations suggest that the OCP phase transforming into cHAp may undergo an alteration of its hydrated layer structure involving the incorporation of species with higher electronic density, compared to that present in the reference OCP structure. Such a modification of the hydrated layer as the pH increases suggests an hydrolysis mechanism of the OCP transformation into cHAp, which is also supported by the thin platelets morphology of the final cHAp sample.50 Indeed, dissolution/precipitation or epitaxial mechanism (i.e. growth of cHAp over OCP)
should rather induce the formation of crystals of different morphologies: rods with hexagonal section and thick platelets, respectively.
Rietveld refinements of the cHAp-1d, cHAp-2d and cHAp-3d samples were thus done combining the effects of preferential orientation and increase of the electronic density inside the hydrated layer of the OCP structure. Almost doubling the latter parameter was found decisive to get accurate Rietveld refinements (Fig. 8) resulting in good Rietveld agreement factors (Table 3), and thus allows the quantification of the two phases. As reported in Table 3; the OCP content progressively decreased over maturation time, and was estimated to be 15 wt%, 5 wt% and 2 wt% for cHAp-1d, cHAp-2d and cHAp-3d, respectively. Note that compositions obtained by Rietveld refinements and solid state NMR (based on calibration curve) for the cHAp-1d and the cHAp after 1440 min of reaction (1day), 15 and 16 wt %, respectively, are in very good accordance. The decreasing linewidth of XRD reflections from cHAp-1d to cHAp-3d (Fig. 8 b) indicates the increase in crystallinity of the related apatite phase upon reaction time. This is in good concordance of the cell parameters obtained for cHAp with those previously reported55, 56 and explains the slight improvement of the reliability factors from
time, the OCP structure is altered during the transformation from OCP to cHAp in agreements with previous results where OCP lattice parameters were found to increase in the stage preceding OCP conversion to apatite.69
Table 3 and discussion in the text), blue line for difference curve and blue and red sticks for OCP and HAp Bragg positions, respectively. (a)in the full 0-100 2(°) range and zoom in the 0-12 2(°) range in the insets(b) zoom in the 25-37 2(°) range.
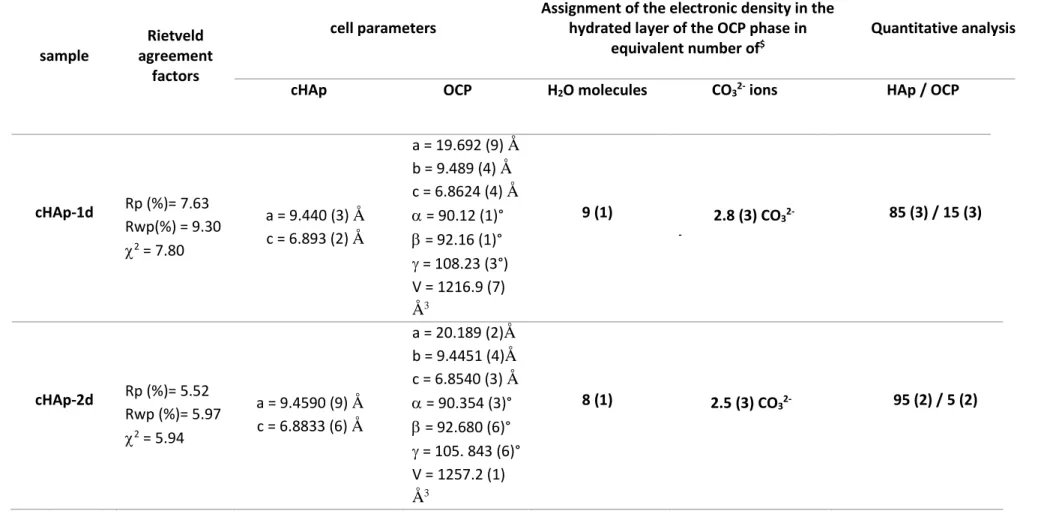
Table 3 : Quantitative analysis and structural properties of cHAp and OCP phases present in cHAp-1d, cHAp-2d and cHAp-3d deduced from Rietveld refinements.
The electronic density in the OCP hydrated layer is expressed as two composition limits associated with an equivalent number of water molecules or carbonate ions. Standard deviations are indicated in bracket.
sample
Rietveld agreement
factors
cell parameters
Assignment of the electronic density in the hydrated layer of the OCP phase in
equivalent number of$
Quantitative analysis :
cHAp OCP H2O molecules CO32- ions HAp / OCP
cHAp-1d Rp (%)= 7.63 Rwp(%) = 9.30 2 = 7.80 a = 9.440 (3) Å c = 6.893 (2) Å a = 19.692 (9) Å b = 9.489 (4) Å c = 6.8624 (4) Å = 90.12 (1)° = 92.16 (1)° = 108.23 (3°) V = 1216.9 (7) Å3 9 (1) 2.8 (3) CO32- -85 (3) / 15 (3) cHAp-2d Rp (%)= 5.52 Rwp (%)= 5.97 2 = 5.94 a = 9.4590 (9) Å c = 6.8833 (6) Å a = 20.189 (2)Å b = 9.4451 (4)Å c = 6.8540 (3) Å = 90.354 (3)° = 92.680 (6)° = 105. 843 (6)° V = 1257.2 (1) Å3 8 (1) 2.5 (3) CO32- 95 (2) / 5 (2)
cHAp-3d* Rp (%)= 5.83 Rwp (%) = 6.12 2 = 6.78 a = 9.4474 (6) Å c = 6.8802 (4) Å a = 20.189 (-)Å b = 9.4451 (-)Å c = 6.8540 (-) Å = 90.354 (-)° = 92.680 (-)° = 105. 843 (-)° V = 1257.2 (-) Å3 8 (-) 2.5 (-) CO32- 98 (1) / 2 (1)
* Lattice parameters of the OCP phase in the cHAp-3d sample have been fixed to the values previously refined for the cHAp-2d sample (because of too weak amount of the phase – about 2 wt % - to refine lattice parameters of a triclinic phase).
$ transcription of the electronic density into an equivalent number of water molecules (10 electrons par H
2O molecule) or carbonate ions (32 electrons par
Accordingly, OCP phases in these samples exhibit a significant higher electronic density compared to the OCP reference structure possessing 5 water molecules per unit cell within the hydrated layers. Such an increase in the electronic density might be ascribed to the incorporation of additional water molecules (Table 3). Indeed, according to Tseng et al.13 the transformation of OCP
into cHAp is controlled by OCP hydrolysis through the incorporation of water molecules into the hydrated layers leading to the deprotonation of the HPO42- ions via the basic hydrolysis reaction HPO4
2-+ OH- = PO
43- + H2O. Such mechanism is consistent with our synthesis set-up where the pH of the
solution is around 10 after 1 day of reaction (S4 video). Thus the increase in electronic density may be tentatively ascribed to an increase in number of water molecules. Hence, if we express the electronic density as an equivalent number of water molecules, we found between 8 (OCP in 2d and cHAp-3d) and 9 (OCP in cHAp-1d) equivalent water molecules, largely exceeding the 5 molecules associated to the full occupancy factors in the OCP structure. However, it is questionable if the steric hindrance associated with such high hydration level within the OCP structure is compatible with the preservation of the whole structural organization shown by the absence of impact on the other diffraction peaks of the OCP structure (Fig. 8).
Thus, one may alternatively consider the possible incorporation of species with higher electronic density than water to account for the increase of electronic density within the hydrated layer. Indeed, it was reported that citrate, succinate or carbonate ions can be incorporated in the OCP structure, affecting the scattering contrast between apatitic and hydrated layers, and then the (100) peak relative intensity.43, 70, 71 In the present study, given that the final apatite phase is carbonated, the
involvement of carbonate ions should also be considered. The two composition limits assuming the involvement of only water (9 to 8 molecules) or only carbonates (2.6 to 2.3 ions) are present are reported in Table 3, even though a mixed water-carbonate composition is much rather expected. The charge balance compensation required upon carbonate incorporation could be easily achieved through the propensity of phosphate towards protonation. Such carbonate uptake within OCP
hydrated layers is relevant considering that the mechanism of incorporation of carbonate upon of OCP transformation into carbonated apatite still remains an open question.
Conclusion
The present study provides a suitable and relevant methodology to monitor cHAp precipitation from the identification and quantification of mineral precursor phases to their mechanism transformation into cHAp. The advantages and limitations of Raman and ssNMR spectroscopies are discussed in a context of the uncertain qualitative discrimination and quantification of OCP and cHAp, especially for low OCP relative content. From comparative study performed on physical mixtures of OCP and cHAp compounds, the better resolved contributions of the OCP from the cHAp ones in 31P NMR compared
to Raman makes this technic more sensitive to visually detect the characteristic fingerprints of OCP. However, providing Raman spectral decomposition is achieved or the weak HPO4 contribution at
1008 cm-1 is tracked, both techniques finally enable to successfully qualitatively detect down to 10%
OCP mixed in cHAp, even though only ssNMR allows accurate quantification thanks to calibration curve. Despite its detection limitation, Raman can be advantageously carried out under in situ conditions thanks to the use of fiber optic Raman immersion probe. It provides thus a unique opportunity to monitor without any perturbation the kinetics of precipitation of cHAp. Such in situ Raman study allowed tracking relevant time points to complementary better identify by solid state NMR the sequential formation of the calcium phosphate phases transiently formed in the course of biomimetic cHAp precipitation. Consistently with the progressive increase of the pH, induced by the slow dissolution of NH3 vapor in the reactants solution, ACP is first identified after 96 min thanks to
solid state NMR and then it progressively transforms to poorly crystalline OCP, that is detected from from 150 min and 192 min by solid state NMR and Raman, respectively. Although detected by solid state NMR the transient formation of Brushite (150-300 min) is not clearly identified by in situ Raman. If OCP is still present after 480 min, according to 2D HetCor NMR experiment, its transformation into cHAp has already started. This slow transformation leads to progressive modification of the shape of the Raman and solid state NMR signals. The maximum of the main PO4 Raman band is progressively
up to 1440 min. Although not quantitative, the highly sensitive 1H 31 P CP MAS NMR sequence confirms
that the OCP transformation is achieved after 6 day of reaction, and evidences that residual OCP is still present after 3 days. Thus, coupling in situ Raman and ex situ ssNMR spectroscopies provides a very interesting tool to track and quantify OCP during its transformation into cHAp. Complementary, final cHAp powders can be advantageously characterized by XRD and the quantification limit encountered with solid state NMR can be overcome through Rietveld refinements. It allowed to detect the persistence of OCP as contaminant phase still present down to 2wt % after 3 days of reaction. To reach accurate refinements, the abnormal evolution of the 2= 4.7° line of OCP phase undergoing transformation into cHAp has to be simulated by increasing the electronic density of the hydrated layer of OCP occurring in the course of its transformation into cHAp. It is rationalized by the incorporation of additional water molecules and/or to carbonate uptake within the hydrated layer of the OCP structure. These two types of transient structural modifications are relevant in the context of the transformation of OCP to carbonated cHAp, and could be associated to the undergoing OCP hydrolysis and to the carbonation mechanism of cHAp from OCP, respectively.
Acknowledgement
This work was supported by French state funds managed by the ANR within the Investissements d'Avenir program under reference ANR-11-IDEX-0004-02, and more specifically within the framework of the Cluster of Excellence MATISSE led by Sorbonne Université. The authors are also grateful to Vincent Losinho from Laboratoire Réactivité de Surface, Sorbonne Université for his involvement in the implementation of the in situ Raman set up.
Electronic Supplementary Information Available:
(S2) Decomposition of the 1 PO4 region of the Raman spectra of pure OCP, cHAP and physical mixtures
of the two compounds.
(S3) Decomposition of the 31P NMR spectra of pure OCP, cHAP and physical mixtures of the two
compounds and deduced calibration curve.
(S4) Biomimetic apatite precipitation visualized via video (web enhanced object) and pictures recorded in the presence of universal indicator solution.
(S5) Decomposition of the 31P NMR spectra recorded during the precipitation of biomimetic apatite.
(S6) Rietveld refinement of the prepared OCP sample showing concluding to the adequacy with the OCP structure model.
(S7) Representation of the OCP structure.
(S8) Rietveld simulations accounting for the modification of the intensity of the (100) diffraction line of OCP.
References
1. C. Drouet, BioMed Res. Int., 2013, 2013, 1-12.
2. C. Combes, S. Cazalbou and C. Rey, Minerals, 2016, 6, 34.
3. C. Rey, C. Combes, C. Drouet, H. Sfihi and A. Barroug, Mat. Sci. Eng. C-Biomim., 2007, vol. 27 (n° 2) 198-205.
4. C. Rey, C. Combes, C. Drouet and M. J. Glimcher, Osteoporos Int., 2009, 20, 1013-1021. 5. Y. Wang, S. Von Euw, F. M. Fernandes, S. Cassaignon, M. Selmane, G. Laurent, G.
Pehau-Arnaudet, C. Coelho, L. Bonhomme-Coury, M. M. Giraud-Guille, F. Babonneau, T. Azaïs and N. Nassif, Nat. Mater., 2013, 12, 1144-1153.
6. M. S.-A. Johnsson and G. H. Nancollas, Crit. Rev. Oral Biol. Med, 1992, 3, 61-82. 7. L. Wang and G. H. Nancollas, Chem. Rev., 2008, 108, 4628–4669.
8. A. Dey, P. H. H. Bomans, F. A. Müller, P. M. Frederik, G. de With and N. A. J. M. Sommerdijk,
Nat. Mater., 2010, 9, 1010-1014.
9. G. He, T. Dahl, A. Veis and A. George, Nat. Mater., 2003, 2, 552-558.
10. G. R. Sauer, W. B. Zunic, J. R. Durig and R. E. Wuthier, Calcif Tissue Int 1994, 54, 414-420. 11. W. J. E. M. Habraken, J. Tao, L. J. Brylka, H. Friedrich, L. Bertinetti, A. S. Schenk, A. Verch, V.
13. Y. H. Tseng, C. Y. Mou and J. C. C. Chan, J. Am. Chem. Soc., 2006, 128, 6909-6918.
14. N. J. Crane, V. Popescu, M. D. Morris, P. Steenhuis and M. A. J. Ignelzi, Bone, 2006, 39, 434-442.
15. P. Bodier-Houlle, P. Steuer, J. C. Voegel and F. J. Cuisinier, Acta Cryst., 1998, D54, 1377-1381. 16. E. Gentleman, R. J. Swain, N. D. Evans, S. Boonrungsiman, G. Jell, M. D. Ball, T. A. V. Shean, M.
L. Oyen, A. Porter and M. M. Stevens, Nat. Mater., 2009, 8, 763-770.
17. F. Nudelman, P. H. H. Bomans, A. George, G. de With and N. A. J. M. Sommerdijk, Faraday
Discuss., 2012, 159, 357-370.
18. F. Castro, A. Ferreira, F. Rocha, A. Vicente and J. Teixeira, Chem. Eng. Sci., 2012, 77, 150-156. 19. T. Tsuji, K. Onuma, A. Yamamoto, M. Iijima and K. Shiba, P Natl. Acad. Sci. USA, 2008, 105,
16866-16870.
20. A. Lotsari, A. K. Rajasekharan, M. Halvarsson and M. Andersson, Nat. Commun., 2018, 9, 4170. 21. J. Mahamid, A. Sharir, L. Addadi and W. S., P Natl. Acad. Sci. USA, 2008, 105, 12749-12753. 22. J. Mahamid, B. Aichmayer, E. Shimoni, R. Ziblat, C. Li, S. Siegel, O. Paris, P. Fratzl, S. Weiner and
L. Addadi, P. Natl. Acad. Sci .USA 2010, 107, 6316–6321, S6316/6311-S6316/6316. 23. E. Beniash, R. A. Metzler, R. S. Lam and P. Gilbert, J. Struct. Biol. , 2009, 166, 133-143. 24. F. Ren, Y. Ding and Y. Leng, Biomed. Mater. Res. Part A, 2014, 102A, 496-505.
25. S. Diallo-Garcia, M. Ben Osman, J. M. Krafft, S. Casale, C. Thomas, J. Kubo and G. Costentin, J.
Phys. Chem. C, 2014, 118, 12744-12757.
26. Z. H. Cheng, A. Yasukawa, K. Kandori and T. Ishikawa, J. Chem. Soc.,Faraday Trans., 1998, 94, 1501-1505.
27. B. O. Fowler, M. Markovic and P. W. Brown, Chem. Mater., 1993, 5, 1417-1423.
28. M. Ben Osman, J. M. Krafft, Y. Millot, F. Averseng, T. Yoshioka, J. Kubo and G. Costentin, Eur. J.
Inorg. Chem., 2016, 17, 2709-2720.
29. S. Koutsopoulos, J. Biomed. Mater. Res., 2002, 62, 600-612.
30. M. Pilarczyk, K. Czamara, M. Baranska, J. Natorszka, P. Kapusta, A. Undas and A. Kaczor, J.
Raman Spectrosc., 2013, 44, 1222-1229.
31. G. B. Ramírez-Rodríguez, J. M. Delgado-López and J. Gómez-Morales, CrystEngComm, 2013, 15, 2206-2212.
32. A. Antonakos, E. Liarokapis and T. Leventouri, Biomaterials 2007, 28, 3043-3054. 33. M. D. Morris and G. S. Mandair, Clin. Orthop. Relat. Res., 2011, 469, 2160-2169. 34. G. L. Darimont, B. Gilbert and R. Cloots, Mater. Lett., 2003, 58, 71-73.
35. M. M. Kerssens, P. Matousek, K. Rogersb and N. Stone, Analyst, 2010, 135, 3156-3161. 36. Y. Leng, J. Chen and S. Qu, Biomaterials, 2003, 24, 2125–2131.
37. R. Xin, Y. Leng and N. Wang, J. Crystal Growth, 2006, 289, 339-344.
38. R. M. Wilson, J. C. Elliott, S. E. P. Dowker and L. M. Rodriguez-Lorenzo, Biomaterials, 2005, 26. 39. W. E. Brown, J. P. Smith, J. R. Lehr and A. W. Frazier, Nature, 1962, 196, 1050-1055.
40. M. Mathew, W. E. Brown, L. W. Schroeder and B. Dickens, J. Cryst. and Spectrosc., 1988, 18, 235-250.
41. S. Stewart, D. A. Shea, C. P. Tarnowski, M. D. Morris, D. Wang, R. Franceschi, D. L. Lin and E. Keller, J Raman Spectrosc., 2002, 33, 536-543.
42. A. Akiva, M. Kerschnitzki, I. Pinkas, W. Wagermaier, K. Yaniv, P. Fratzl, L. Addadi and S. Weiner,
J. Am. Chem. Soc., 2016, 138, 14481-14487.
43. E. Davies, K. H. Muller, W. C. Wong, C. J. Pickard, D. G. Reid, J. N. Skepper and M. Duer, P Natl.
Acad. Sci. USA, 2014, 111, E1354–E1363.
44. E. Davies, M. J. Duer, S. E. Ashbrook and J. M. Griffin, J. Am. Chem. Soc., 2012, 134, 12508-12515.
45. G. Cho, Y. Wu and J. L. Ackerman, Science, 2003, 16, 1123-11127.
46. W. P. Rothwell, J. S. Waugh and J. P. Yesinowski, J. Am. Chem. Soc., 1980, 102, 2637-2643. 47. W. P. Aue, A. E. Roufosse, M. J. Glimcher and R. G. Griffin, Biochemistry, 1984, 23,25,
48. A. H. Roufosse, W. P. Aue, J. E. Roberts, M. J. Glimcher and R. G. Griffin, Biochemistry, 1984, 23, 6115-6120.
49. C. Jäger, T. Welzel, W. Meyer-Zaika and M. Epple, Magn. Reson. Chem., 2006, 44, 573-580. 50. N. Nassif, F. Martineau, O. Syzgantseva, F. Gobeaux, M. Willinger, T. Coradin, S. Cassaignon, T.
Azaïs and M. M. Giraud-Guille, Chem. Mater. , 2010, 22, 3653-3663.
51. A. Bigi, B. Bracci, S. Panzavolta, M. Iliescu, M. Plouet-Richard, J. Werckmann and D. Cam,
Crystal Growth & Design, 2004, 4, 141-146.
52. D. Massiot, F. Fayon, M. Capron, I. King, S. Le Calvé, B. Alonso, J.-O. Durand, B. Bujoli, Z. Gan and G. Hoatson, Magn. Reson. Chem., 2002, 40, 70-76.
53. J. Rodriguez-Carvajal, http://www-llb.cea.fr/fullweb/fp2k/fp2k_divers.htm), 2005.
54. L. M. Rodríguez-Lorenzo, J. N. Hart and K. A. Gross, J Phys. Chem. B, 2003, 107, 8316-8320. 55. M. E. Fleet and X. Liu, J. Solid State Chem., 2004, 177, 3174-3182.
56. M. E. Fleet, X. Liu and X. Liu, Am. Miner., 2011, 96, 1148-1157.
57. A. Awonusi, M. D. Morris and M. M. Tecklenburg, Calcif. Tissue Int., 2007, 81, 46-52.
58. S. Von Euw, Y. Wang, G. Laurent, C. Drouet, F. Babonneau, N. Nassif and T. Azaïs, Sci. Rep., 2019, 9, 8456.
59. J. D. Pasteris, B. Wopenka, J. J. Freeman, K. Rogers, E. Valsami-Jones, J. A. van der Houwen and M. J. Silva, Biomaterials, 2004, 25, 229-238.
60. M. R. Urist, Fundamental and Clinical Bone Physiology, J.B. Lippincott Co., Philadelphia, 1980. 61. J. D. Currey, Bones: Structure and Mechanics, Princeton University Press, 2002.
62. N. Vandecandelaere, C. Rey and C. Drouet, J. Mater. Sci. Mater. Med. , 2012, 23, 2593–2606. 63. K. Chatzipanagis, M. Iafisco, T. Roncal-Herrero, M. Bilton, A. Tampieri, R. Kröger and D.-L. J.M.,
CrystEngComm, 2016, 18, 3170-3173.
64. S. Von Euw, W. Ajili, A. Delices, G. Laurent, F. Babonneau, N. Nassif and T. Azaïs, Acta biomater., 2017, 59, 351-360.
65. M. J. Glimcher, L. C. Bonar, M. D. Grynpas, W. J. Landis and A. H. Roufosse, J. Cryst. Growth 1981, 53, 100-119.
66. L. Brečević and H. Füredi-Milhofer, Calc. Tiss. Res., 1972, 10, 82-90.
67. R. L. Frost, Y. Xi, R. E. Pogson, G. J. Millar, K. Tan and S. J. Palmer, J. Raman Spectrosc., 2012, 43, 571-576.
68. J. C. Elliot, Structure and Chemistry of the Apatites and Other Calcium Orthophosphates., Elsevier, Amsterdam, Neth., 1994.
69. V. F. Shamrai, A. E. Karpikhin, A. Y. Fedotov, V. P. Sirotinkin, S. M. Barinov and V. S. Komlev,
Inorganic Materials, 2015, 51, 355-361.
70. T. W. T. Tsai, F.-C. Chou, Y.-H. Tseng and J. C. C. Chan, Phys. Chem. Chem. Phys. , 2010, 12, 6692-6697.
71. D. Shen, N. Horiuchi, S. Nozaki, M. Miyashin, K. Yamashita and A. Nagai, Biomed. Mater. Eng., 2017, 28, 9-21.
Electronic Supplementary Information
Insights for OCP Identification and Quantification in the Context of Apatite Biomineralization Marc Robin a,b, Stanislas Von Euw a, Guillaume Renaudinc, Sandrine Gomesc,
Jean-Marc Krafft b, Nadine Nassif a, Thierry Azaïs a* and Guylène Costentin b*
a Sorbonne Université, CNRS, Collège de France, Laboratoire Chimie de la Matière Condensée de Paris,
LCMCP, F-75005 Paris, France
b Sorbonne Université, CNRS, Laboratoire Réactivité de Surface, LRS, F-75005 Paris, France c Université Clermont Auvergne, CNRS, SIGMA Clermont, ICCF, F-63000 Clermont-Ferrand, France
S1 Schematic representation of the in situ Raman set up
Figure S1. Schematic representation of the original set-up used to monitor the precipitation of
biomimetic apatite (cHAp).
Ca
2+PO
42-CO
3 2-Ca2+ PO4 2-CO3 2-Ca2+ PO4 2-CO32-in situ
Raman
@
785 nm
ex situ
solid state NMR in
wet conditions
pH 2.2
Centrifugation
NH3NaHCO
3NaH
2PO
4CaCl
2pH 11
S2 decomposition of the Raman spectra from physical mixtures of OCP and cHAp
Figure S2. Spectral decomposition Raman spectra in the 1 PO4 region for a) pure OCP, b) pure cHAp
and c) and d) OCP/cHAp physical mixtures with weight ratio of 10/90) and 40/60, respectively. In these two latter cases, the two set of components extracted for pure OCP and cHAp samples (band positions, linewidths and the relative intensities of the two components present in the pure OCP (955 and 964 cm -1) and cHAp (958 and 950 cm-1) samples were kept constant. The estimated compositions deduced from
the extracted contributions of the fits for the two physical mixtures (27/73 and 45/55, respectively) are however not in good accordance with the nominal ones, which is explained by the numerous parameters (surface/volume ratio, diffusion) impacting the intensities of the Raman contributions. Experimental spectrum in blue, 1 PO4 bands related to OCP in green, 1 PO4 bands related to cHAp in
S3 Decomposition of 31P NMR spectra of physical mixtures of OCP and cHAp and calibration curve.
Figure S3a : decomposition of the 31P ssNMR spectra of the OCP/cHAp physical mixtures. Experimental
spectrum in blue, resonances corresponding to OCP in green, to cHAp in red, sum in dashed black. The relative OCP/cHAp nominal weight fraction are indicated onto each spectrum.
b)
Figure S3b : relationship between the wt% OCP in the OCP/cHAp physical mixture and the % of the area
of OCP phosphate components as determined through 31P ssNMR to be used as calibration curve for
S4 Biomimetic apatite precipitation video
Video S4. Video (web enhanced object) of the precipitation of biomimetic apatite in one of the two
flasks. The pH is indicated by the changes in the pH indicator colour. Web-Enhanced object is available.
Figure S4. Selection of pictures indicating the evolution of the pH values upon increasing reaction time
and corresponding pH value at the bottom of the reactor deduced from universal indicator solution pH
S5 Spectral decomposition of 31P NMR spectra recorded during precipitation of biomimetic apatite
Figure S5: decomposition of the 31P ssNMR spectra of the reaction products during the formation of
biomimetic cHAp. Experimental spectrum in blue, resonances corresponding to OCP in green, to cHAp in red, sum in dashed black. The OCP weight fraction that is deduced from the decomposition and the calibration curve (Fig. S3b) is indicated onto each spectrum together with the reaction time.