Novel insights on the geomagnetic field in West Africa from a new
intensity reference curve (0-2000 AD)
Lisa Kapper, Vincent Serneels, Sanja Panovska, Rafael Garcia Ruiz, Gabrielle Hellio, Lennart de Groot, Avto Gogichaishvili, Juan Morales, and Ruben Cejudo Ruiz
Fig. S1: Examples of typical thermomagnetic curves of samples from (a-b) Doumbala (DMB), with one and with two phases, respectively; (c-d) Siola (SIO); and (e-f) from Korsimoro (KRS). (a-c) and (e-f) are magnetization versus temperature, whereas (d) is magnetic susceptibility versus temperature.
Fig. S2: Examples of typical hysteresis curves from Doumbala (DMB) with (a) narrow and (b) wasp-waisted shapes; from (c) Siola (SIO); from Korsimoro (KRS) with (d) narrow and (e) wasp-waisted shapes. The dia- and paramagnetic components were not removed.
-5.00E-04 5.00E-04 1.50E-03 2.50E-03 3.50E-03 4.50E-03 5.50E-03 0 100 200 300 400 500 600 M (A m 2/k g) T (ºC) KRS34-4C -1.00E-03 4.00E-03 9.00E-03 1.40E-02 1.90E-02 0 100 200 300 400 500 600 M (A m 2/k g) T (ºC) SIO1D 0.0E+00 2.0E-03 4.0E-03 6.0E-03 8.0E-03 0 100 200 300 400 500 600 M (A m 2/k g) T (°C) KRS35-5D -1.00E-06 1.00E-06 3.00E-06 5.00E-06 7.00E-06 9.00E-06 1.10E-05 0 100 200 300 400 500 600 M (A m 2/k g) T (ºC) DMB2-5-1 -2.00E-06 3.00E-06 8.00E-06 1.30E-05 1.80E-05 2.30E-05 2.80E-05 3.30E-05 0 100 200 300 400 500 600 M (A m 2/k g) T (ºC) DMB6-6-1 (a) DMB (b) (c) DMB KRS SIO (f) T [ºC] Tc = 518ºC 357ºC Tc = 569ºC Tc = 568ºC Tc = 564ºC (d) SIO5F SIO Tc = 608ºC KRS (e) Tc = 559ºC k (SI) 0 100 200 300 400 500 600 700 90 80 70 60 50 40 0 200 400 600 -200 -400 -600 -600 -400 -200 0 200 400 600 -600 -400 -2000.00 200 400 600 0.00001 0.00002 0.00003 0.00004 -0.00002 -0.00004 (a) (b) (c) 0 200 400 600 -200 -400 -600 0.0 0.00002 0.00004 0.00006 -0.00002 -0.00004 -0.00006 0 200 400 600 -200 -400 -600 0.0 0.00001 0.00002 -0.00001 -0.00002 (d) (e) DMB DMB SIO KRS KRS DMB6-6-1 DMB5-3-1 SIO4C KRS28-4F KRS35-5D
M [Am2/kg] M [Am2/kg] M [Am2/kg] M [Am2/kg]
B [m T] M [Am2/kg] Ms = 54.8 x 10⁻⁶ Am2/kg Mrs = 185.0 x 10⁻⁷ Am2/kg Bc = 18.5 mT Ms = 3.8 x 10⁻⁶ Am2/kg Mrs = 13.1 x 10⁻⁷ Am2/kg Bc = 14.4 mT Ms = 37.0 x 10⁻⁶ Am2/kg Mrs = 85.5 x 10⁻⁷ Am2/kg Bc = 14.5 mT Ms = 13.2 x 10⁻⁶ Am2/kg Mrs = 35.1 x 10⁻⁷ Am2/kg Bc = 14.3 mT Ms = 5.2 x 10⁻⁶ Am2/kg Mrs = 23.8 x 10⁻⁷ Am2/kg Bc = 18.5 mT
Fig. S3: Examples of backfield curves corresponding to the above shown hysteresis curves of (a-b) Doumbala (DMB), (c) Siola (SIO) and (d-e) Korsimoro (KRS).
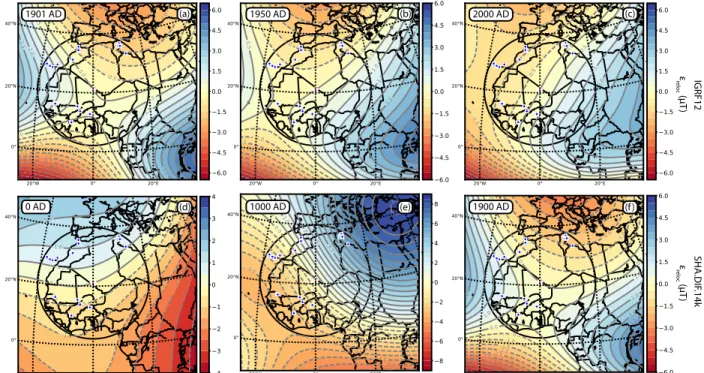
Fig. S4: Maps of the relocation error calculated using the IGRF121 (a-c) and the SHA.DIF.14k2 (d-f) for different time slots. Also shown is the central relocation point (star), the locations of the data used for the reference curves (dots) and the circular area with a radius of about 2100 km.
-5.00E-04 0.00E+00 5.00E-04 1.00E-03 1.50E-03 2.00E-03 2.50E-03 -400.0 -300.0 -200.0 -100.0 0.0 M (A m 2/k g) B (mT) -3.00E-03 -2.00E-03 -1.00E-03 0.00E+00 1.00E-03 2.00E-03 3.00E-03 4.00E-03 -400 -300 -200 -100 0 M (A m 2/k g) B (mT) -8.00E-03 -6.00E-03 -4.00E-03 -2.00E-03 0.00E+00 2.00E-03 4.00E-03 6.00E-03 8.00E-03 -400 -300 -200 -100 0 M (A m 2/k g) B (mT) -2.00E-07 0.00E+00 2.00E-07 4.00E-07 6.00E-07 8.00E-07 1.00E-06 1.20E-06 1.40E-06 -400 -300 -200 -100 0 M (A m 2/k g) B (mT) -2.00E-05 -1.50E-05 -1.00E-05 -5.00E-06 0.00E+00 5.00E-06 1.00E-05 1.50E-05 2.00E-05 -400 -300 -200 -100 0 M (A m 2/k g) B (mT) (a) DMB (b) (c) (d) (e) DMB SIO KRS KRS Bcr = 257.1 mT Bcr = 32.6 mT Bcr = 47.7 mT Bcr = 67.1 mT Bcr = 291.0 mT DMB6-6-1 DMB5-3-1 SIO4C KRS28-4F KRS35-5D ε reloc (µ T) 1950 AD 2000 AD 1901 AD (a) (b) (c) 0 AD (d) 1000 AD (e) 1900 AD (f) ε reloc (µ T) SHA.DIF .14k IGRF12
Fig. S5: Virtual Axial Dipole Moments (VADMs) of the data used for the West African reference curves. Blue (filled) dots indicate data from the Northern part of the circular area around the relocation point (Canary Islands, Morocco, Tunisia, Libya) and white (empty) dots indicate data from the Southern part (Senegal, Mali, Burkina Faso, Ivory Coast).
References:
1. Thébault, E. et al. International Geomagnetic Reference Field: the 12th generation.
Earth, Planets Sp. 67, 19 (2015).
2. Pavón-Carrasco, F. J., Osete, M. L., Torta, J. M. & De Santis, A. A geomagnetic field model for the Holocene based on archaeomagnetic and lava flow data. Earth Planet.
Sample Tc ( C) Rev. Ms (10 6 Am2/kg) Mrs(10 7 Am2/kg) Bc (mT) Bcr(mT) Mrs/Ms Bcr/Bc DMB1-4-1* 507/309 yes 1.9 5.0 12.7 55.3 0.27 4.36 DMB2-5-1* 518/357 yes 17.7 69.8 25.8 67.6 0.39 2.62 DMB3-4-1* 520 nearly 2.6 6.1 7.0 27.6 0.24 3.92 DMB4-3-1* 573 nearly 8.3 19.0 7.3 20.4 0.22 1.20 DMB5-3-1* 524/133 yes 3.8 13.1 14.4 257.1 0.34 17.87 DMB6-6-1* 569 nearly 54.8 185.0 18.5 32.6 0.34 1.77 Average 535 14.8 49.7 14.3 76.8 0.30 5.29 Stdev. 28 20.4 70.6 7.1 90.1 0.07 6.28 SIO1B 560/638 yes SIO1C 593 nearly SIO1D* 568 yes 34.2 93.7 12.6 35.8 0.27 2.86 SIO1D 590 no SIO1E 595 no SIO2B 635/218 nearly SIO2E 563/633 no SIO2G 587 nearly SIO3A 583 no SIO3C 632 nearly SIO3D 560 no SIO4B 597 yes SIO4C* 572 no 37.0 85.5 14.5 47.7 0.23 3.29 SIO4C 595 no SIO4E 584 yes SIO5D* 564 no 101.0 220.0 11.4 28.4 0.22 2.50 SIO5E 561 yes SIO5F 608 no SIO5G 526 yes SIO6G 596 no SIO6H 605 no SIO6I 626 no SIO7B 558 no SIO7D 562 no SIO7G 588 no SIO20* 559 yes 0.7 1.2 9.2 21.5 0.18 2.33 Average 583 43.2 100.1 11.9 33.4 0.23 2.75 Stdev. 26 41.9 90.2 2.2 11.2 0.04 0.43 KRS28-4F* 559 no 13.2 35.1 14.3 67.1 0.27 4.69 KRS34-4C* 584 yes 7.4 18.2 9.4 63.0 0.25 6.72 KRS35-5D* 564 no 5.2 23.8 18.5 291.0 0.46 15.75 Average 569 8.6 25.7 14.1 140.3 0.33 9.05 Stdev. 13 4.1 8.6 4.6 130.5 0.12 5.89
Tab. S1: Rock magnetic properties of Doumbala (DMB), Siola (SIO) and Korsimoro (KRS) samples. Shown are the Curie temperature Tc, Rev. indicates the reversibility of the heating and cooling curve in the thermomagnetic experiment; Msthe
saturation magnetization; Mrsthe remanence; Bc the coercivity and Bcr the coercivity of remanence. Samples with a star were measured on the Curie Balance, while the others were measured on the kappabridge.
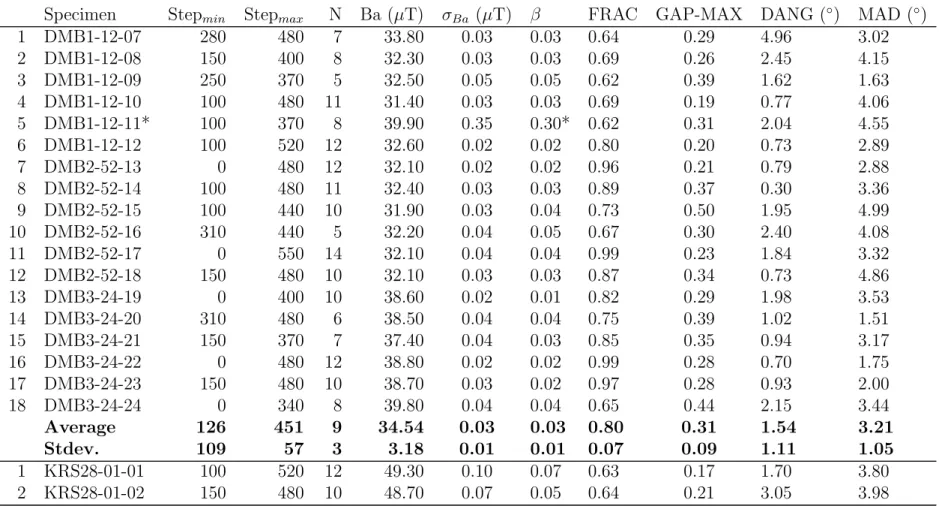
Tab. S2: Results of the Thellier-Coe intensity experiment of Doumbala (DMB), Korsimoro (KRS) and Siola (SIO)
specimen. Stepmin and Stepmax are the beginning and endpoint of the best fit slope, N is the number of points used for the
best fit. Ba is the archaeointensity obtained from the best fit and Ba is the standard error of the slope. Furthermore, is
the ratio of the standard error of the slope to the absolute value of the slope; FRAC the fraction of remanence; GAP-MAX the maximum gap statistic between two consecutive data points; DANG the deviation of the angle, as to ensure that the characteristic component was chosen; and MAD the maximum angular deviation. Rejected specimens are marked with a star.
Specimen Stepmin Stepmax N Ba (µT) Ba (µT) FRAC GAP-MAX DANG ( ) MAD ( )
1 DMB1-12-07 280 480 7 33.80 0.03 0.03 0.64 0.29 4.96 3.02 2 DMB1-12-08 150 400 8 32.30 0.03 0.03 0.69 0.26 2.45 4.15 3 DMB1-12-09 250 370 5 32.50 0.05 0.05 0.62 0.39 1.62 1.63 4 DMB1-12-10 100 480 11 31.40 0.03 0.03 0.69 0.19 0.77 4.06 5 DMB1-12-11* 100 370 8 39.90 0.35 0.30* 0.62 0.31 2.04 4.55 6 DMB1-12-12 100 520 12 32.60 0.02 0.02 0.80 0.20 0.73 2.89 7 DMB2-52-13 0 480 12 32.10 0.02 0.02 0.96 0.21 0.79 2.88 8 DMB2-52-14 100 480 11 32.40 0.03 0.03 0.89 0.37 0.30 3.36 9 DMB2-52-15 100 440 10 31.90 0.03 0.04 0.73 0.50 1.95 4.99 10 DMB2-52-16 310 440 5 32.20 0.04 0.05 0.67 0.30 2.40 4.08 11 DMB2-52-17 0 550 14 32.10 0.04 0.04 0.99 0.23 1.84 3.32 12 DMB2-52-18 150 480 10 32.10 0.03 0.03 0.87 0.34 0.73 4.86 13 DMB3-24-19 0 400 10 38.60 0.02 0.01 0.82 0.29 1.98 3.53 14 DMB3-24-20 310 480 6 38.50 0.04 0.04 0.75 0.39 1.02 1.51 15 DMB3-24-21 150 370 7 37.40 0.04 0.03 0.85 0.35 0.94 3.17 16 DMB3-24-22 0 480 12 38.80 0.02 0.02 0.99 0.28 0.70 1.75 17 DMB3-24-23 150 480 10 38.70 0.03 0.02 0.97 0.28 0.93 2.00 18 DMB3-24-24 0 340 8 39.80 0.04 0.04 0.65 0.44 2.15 3.44 Average 126 451 9 34.54 0.03 0.03 0.80 0.31 1.54 3.21 Stdev. 109 57 3 3.18 0.01 0.01 0.07 0.09 1.11 1.05 1 KRS28-01-01 100 520 12 49.30 0.10 0.07 0.63 0.17 1.70 3.80 2 KRS28-01-02 150 480 10 48.70 0.07 0.05 0.64 0.21 3.05 3.98
Specimen Stepmin Stepmax N Ba (µT) Ba (µT) FRAC GAP-MAX DANG ( ) MAD ( ) 3 KRS28-01-03 150 550 12 43.40 0.05 0.04 0.64 0.15 1.74 3.38 4 KRS28-01-04 150 550 12 47.40 0.06 0.05 0.63 0.16 1.04 3.55 5 KRS28-01-05 0 580 15 52.10 0.08 0.05 0.95 0.13 1.25 4.66 6 KRS28-01-06 0 550 14 54.00 0.07 0.05 0.77 0.15 3.21 3.80 Average 92 538 13 49.15 0.07 0.05 0.71 0.16 2.00 3.86 Stdev. 74 34 2 3.70 0.02 0.01 0.13 0.03 0.92 0.44 1 SIO1BA-25* 150 480 10 53.60 0.15 0.10* 0.64 0.23 5.19* 6.13* 2 SIO1BA-26* 370 520 5 58.90 0.1 0.06 0.42* 0.58 1.91 2.91 3 SIO1BA-27 340 580 8 45.90 0.07 0.05 0.61 0.27 1.04 2.59 4 SIO1BA-28 150 550 12 51.40 0.07 0.05 0.88 0.26 0.61 4.62 5 SIO1BA-29 250 520 9 38.50 0.07 0.06 0.63 0.22 3.29 4.87 6 SIO1BA-30* 250 550 10 47.90 0.11 0.08 0.58* 0.16 4.19 6.38* 7 SIO3CA-31* 150 440 9 39.20 0.11 0.10* 0.76 0.19 3.32 13.80* 8 SIO3CA-32* 150 440 9 37.20 0.12 0.11* 0.76 0.18 11.99* 18.30* 9 SIO3CA-33* 280 480 7 41.80 0.31 0.26* 0.61 0.31 2.65 13.38* 10 SIO3CA-34* 280 480 7 40.10 0.32 0.28* 0.54* 0.29 3.09 14.45* 11 SIO3CA-35* 250 440 7 36.70 0.16 0.16* 0.66 0.24 8.62* 16.97* 12 SIO3CA-36* 150 340 6 39.30 0.07 0.06 0.44* 0.39 11.35* 13.50* 13 SIO4BA-37 370 580 7 43.80 0.06 0.05 0.68 0.31 1.92 2.41 14 SIO4BA-38 400 580 6 48.10 0.09 0.06 0.64 0.28 2.00 4.10 15 SIO4BA-39 100 620 15 51.40 0.05 0.03 0.97 0.27 1.46 3.98 16 SIO4BA-40 310 580 9 48.30 0.06 0.04 0.72 0.25 2.51 4.95 17 SIO4BA-41 310 580 9 48.30 0.05 0.04 0.71 0.28 1.91 2.71 18 SIO4BA-42 200 550 11 55.00 0.04 0.02 0.68 0.25 1.35 4.37 19 SIO5GA-43* 100 480 11 52.00 0.09 0.06 0.59* 0.25 2.79 10.2 20 SIO5GA-44 340 620 9 43.50 0.05 0.04 0.80 0.23 3.88 4.68 21 SIO5GA-45 250 520 9 48.10 0.05 0.03 0.74 0.29 2.73 3.28 22 SIO5GA-46 370 620 8 45.40 0.08 0.06 0.64 0.27 1.99 4.01 23 SIO5GA-47 370 520 5 46.60 0.06 0.04 0.61 0.34 1.87 2.85 24 SIO5GA-48 310 520 7 44.80 0.07 0.05 0.64 0.29 3.78 4.99
Specimen Stepmin Stepmax N Ba (µT) Ba (µT) FRAC GAP-MAX DANG ( ) MAD ( ) 25 SIO5GC-49* 280 520 8 37.20 0.09 0.08 0.45* 0.32 5.00 9.39* 26 SIO5GC-50 310 550 8 47.00 0.06 0.05 0.64 0.25 1.34 3.31 27 SIO5GC-51 310 550 8 43.10 0.08 0.06 0.61 0.31 0.10 3.90 28 SIO5GC-52 400 550 5 40.40 0.08 0.07 0.76 0.55 0.36 0.40 29 SIO5GC-53* 340 520 6 38.10 0.12 0.11* 0.51* 0.5 5.79* 4.84 30 SIO5GC-54* 340 550 7 33.20 0.04 0.04 0.21* 0.32 7.10* 15.75* Average 299 564 9 46.54 0.06 0.05 0.70 0.29 1.89 3.65 Stdev. 85 35 2 4.07 0.01 0.01 0.10 0.07 1.10 1.20
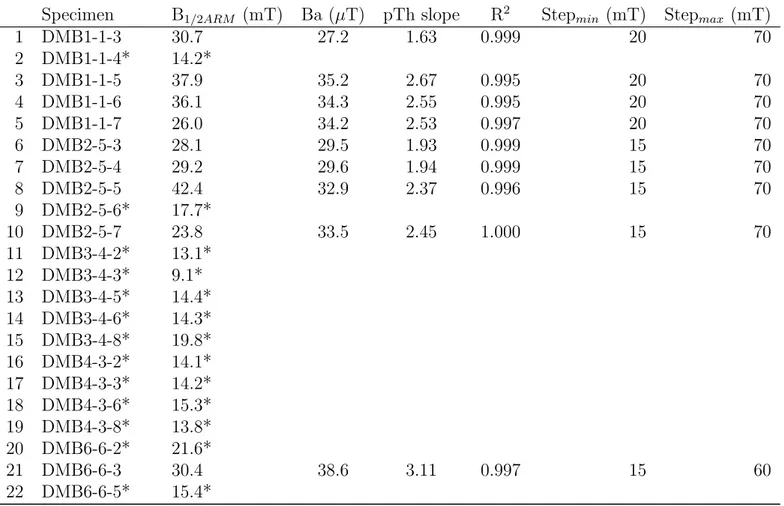
Tab. S3: Results of the pseudoThellier intensity experiment of Doumbala (DMB), Korsimoro (KRS) and Siola (SIO)
specimen. B1/2ARM is the alternating field strength that imparts half of the saturated anhysteretic remanent magnetization
(ARM); Ba is the archaeointensity obtained from the linear fit to the pseudoThellier (pTH) slope and by calibration; the pTh slope wass obtained from an Arai plot of the natural remament magnetization (NRM) remaining against the ARM acquired;
R2 indicates the goodness of the fit; and Step
min and Stepmax define the beginning and endpoint pTh slope of the linear fit
slope. Rejected specimens are marked with a star. The specimen marked with ’1’ was rejected because its Arai diagram is curved. Specimens marked with ’2’ were measured in Zurich.
Specimen B1/2ARM (mT) Ba (µT) pTh slope R2 Stepmin (mT) Stepmax (mT)
1 DMB1-1-3 30.7 27.2 1.63 0.999 20 70 2 DMB1-1-4* 14.2* 3 DMB1-1-5 37.9 35.2 2.67 0.995 20 70 4 DMB1-1-6 36.1 34.3 2.55 0.995 20 70 5 DMB1-1-7 26.0 34.2 2.53 0.997 20 70 6 DMB2-5-3 28.1 29.5 1.93 0.999 15 70 7 DMB2-5-4 29.2 29.6 1.94 0.999 15 70 8 DMB2-5-5 42.4 32.9 2.37 0.996 15 70 9 DMB2-5-6* 17.7* 10 DMB2-5-7 23.8 33.5 2.45 1.000 15 70 11 DMB3-4-2* 13.1* 12 DMB3-4-3* 9.1* 13 DMB3-4-5* 14.4* 14 DMB3-4-6* 14.3* 15 DMB3-4-8* 19.8* 16 DMB4-3-2* 14.1* 17 DMB4-3-3* 14.2* 18 DMB4-3-6* 15.3* 19 DMB4-3-8* 13.8* 20 DMB6-6-2* 21.6* 21 DMB6-6-3 30.4 38.6 3.11 0.997 15 60 22 DMB6-6-5* 15.4*
Specimen B1/2ARM (mT) Ba (µT) pTh slope R2 Stepmin (mT) Stepmax (mT) 23 DMB6-6-7 30.9 36.4 2.82 0.999 15 60 24 DMB6-6-8 27.0 39.6 3.23 0.996 15 60 Average 31.1 33.7 2.48 0.997 17 67 Stdev. 5.6 3.8 0.50 0.002 3 5 1 KRS05-03-O* 19.6* 2 KRS05-04-M* 18.0* 3 KRS05-09-I* 11.6* 4 KRS05-09-R* 14.6* 5 KRS06-05-D 29.6 47.8 4.31 0.996 15 80 6 KRS06-05-G* 16.9* 7 KRS06-07-D* 15.0* 8 KRS06-07-N*2 -23.8* 37.8 2.50 0.982 10 170 9 KRS06-07-T* 16.4* 10 KRS10-02-C* 21.1* 11 KRS10-04-H2 39.7 32.0 1.81 0.986 10 170 12 KRS10-06-F* 19.4* 13 KRS13-02-F* 15.7* 14 KRS13-04-C* 17.2* 15 KRS13-05-F* 15.3* 16 KRS13-05-G* 14.9* 17 KRS21-02-C* 87.2* 18 KRS21-02-H 46.3 22.6 1.04 0.989 15 100 19 KRS21-09-B* 87.7* 20 KRS21-09-C 47.0 29.6 1.94 0.995 15 100 21 KRS23-04-B2 59.7 37.6 2.48 0.998 10 170 22 KRS23-04-C 32.0 23.9 1.20 1.000 15 80 23 KRS23-05-C 47.0 31.9 2.24 0.995 15 80 24 KRS23-06-A 27.4 38.6 3.11 1.000 15 80 25 KRS23-06-C*2 8.7* 44.0 3.23 0.999 10 170 26 KRS23-06-G 35.6 32.9 2.37 0.998 15 80
Specimen B1/2ARM (mT) Ba (µT) pTh slope R2 Stepmin (mT) Stepmax (mT) 27 KRS23-07-J 34.3 30.9 2.12 0.997 15 80 28 KRS28-01-I 27.1 33.8 2.49 0.999 15 100 29 KRS28-01-H* 12.6* 30 KRS28-01-N* 12.3* 31 KRS28-03-M* 11.9* 32 KRS28-04-L* 18.1* 33 KRS30-04-B* 12.5* 34 KRS30-04-C* 13.0* 35 KRS30-08-B 37.3 28.4 1.78 0.995 15 80 36 KRS30-08-F 30.6 27.0 1.61 0.999 15 80 37 KRS30-08-G* 18.7* 38 KRS30-08-M2 27.9 51.2 4.09 0.997 10 170 39 KRS33-01-E* 16.3* 40 KRS33-01-F* 16.3* 41 KRS33-01-G* 20.4* 42 KRS33-03-C* 13.9* 43 KRS33-04-A* 14.9* 44 KRS34-03-D* 21.2* 45 KRS34-05-A*2 10.6* 25.7 1.06 0.992 10 170 46 KRS34-06-A* 21.4* 47 KRS34-06-B* 20.7* 48 KRS34-06-G2 12.1* 26.7 1.20 0.979 10 170 49 KRS34-06-M* 17.8* 50 KRS34-06-N* 17.7* 51 KRS35-01-B*1 54.0 25.8 1.45 0.950 15 80 52 KRS35-02-B* 21.8* 53 KRS35-02-C* 14.2* 54 KRS35-05-H 28.2 20.6 0.77 0.998 15 80 55 KRS35-08-D 62.9 24.0 1.22 0.998 15 80 Average 39.2 31.7 2.12 0.994 14 99
Specimen B1/2ARM (mT) Ba (µT) pTh slope R2 Stepmin (mT) Stepmax (mT) Stdev. 12.0 8.6 1.02 0.012 2 35 1 SIO1A-1 32.8 28.3 1.77 0.984 10 60 2 SIO1B-1 23.2 27.1 1.62 0.998 10 60 3 SIO1B-2* 21.0* 4 SIO1B-3* 18.1* 5 SIO1C-1* 21.2* 6 SIO3B-1 27.9 44.2 3.84 0.999 10 100 7 SIO3B-2* 18.6* 8 SIO3C-1* 18.6* 9 SIO3E-1* 16.1* 10 SIO4B-1* 19.5* 11 SIO4B-2* 20.2* 12 SIO4B-3* 21.7* 13 SIO4C-1* 18.7* 14 SIO4E-1* 21.8* 15 SIO5A-1 39.3 38.8 3.14 0.998 15 100 16 SIO5D-1* 15.2* 17 SIO5G-1* 13.2* 18 SIO5G-2* 12.8* 19 SIO5G-3* 13.8* 20 SIO20-1-2* 15.0* 21 SIO20-1-3* 16.3* 22 SIO20-1-4* 15.1* 23 SIO20-1-5* 15.8* 24 SIO20-1-8* 15.7* Average 30.8 34.6 2.59 0.995 11 80 Stdev. 6.9 8.3 1.07 0.007 3 23
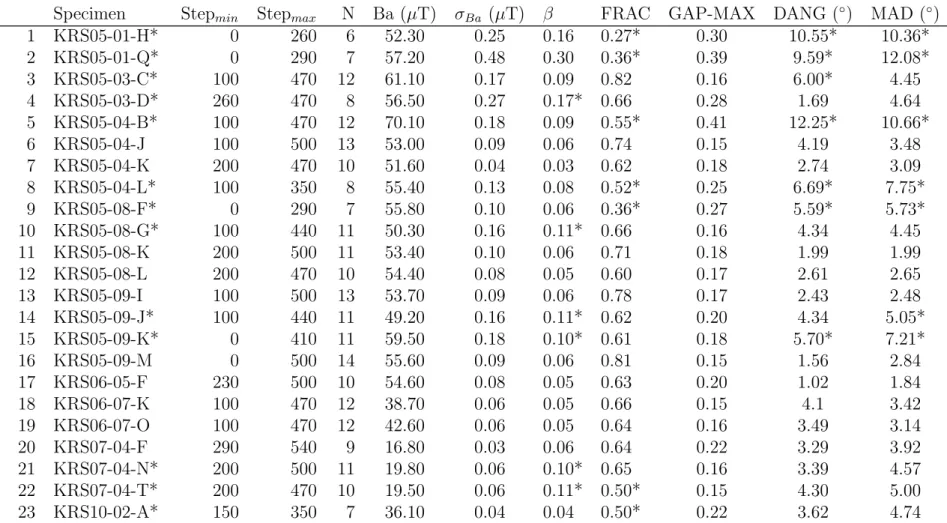
Tab. S4: Reanalysis of Korsimoro (KRS) specimens from Kapper et al1. Step
min and Stepmax are the beginning and
endpoint of the best fit slope, N is the number of points used for the best fit. Ba is the archaeointensity obtained from the
best fit and Ba is the standard error of the slope. Furthermore, is the ratio of the standard error of the slope to the
absolute value of the slope; FRAC the fraction of remanence; GAP-MAX the maximum gap statistic between two consecutive data points; DANG the deviation of the angle, as to ensure that the characteristic component was chosen; and MAD the maximum angular deviation. Specimens with a star were rejected.
Specimen Stepmin Stepmax N Ba (µT) Ba (µT) FRAC GAP-MAX DANG ( ) MAD ( )
1 KRS05-01-H* 0 260 6 52.30 0.25 0.16 0.27* 0.30 10.55* 10.36* 2 KRS05-01-Q* 0 290 7 57.20 0.48 0.30 0.36* 0.39 9.59* 12.08* 3 KRS05-03-C* 100 470 12 61.10 0.17 0.09 0.82 0.16 6.00* 4.45 4 KRS05-03-D* 260 470 8 56.50 0.27 0.17* 0.66 0.28 1.69 4.64 5 KRS05-04-B* 100 470 12 70.10 0.18 0.09 0.55* 0.41 12.25* 10.66* 6 KRS05-04-J 100 500 13 53.00 0.09 0.06 0.74 0.15 4.19 3.48 7 KRS05-04-K 200 470 10 51.60 0.04 0.03 0.62 0.18 2.74 3.09 8 KRS05-04-L* 100 350 8 55.40 0.13 0.08 0.52* 0.25 6.69* 7.75* 9 KRS05-08-F* 0 290 7 55.80 0.10 0.06 0.36* 0.27 5.59* 5.73* 10 KRS05-08-G* 100 440 11 50.30 0.16 0.11* 0.66 0.16 4.34 4.45 11 KRS05-08-K 200 500 11 53.40 0.10 0.06 0.71 0.18 1.99 1.99 12 KRS05-08-L 200 470 10 54.40 0.08 0.05 0.60 0.17 2.61 2.65 13 KRS05-09-I 100 500 13 53.70 0.09 0.06 0.78 0.17 2.43 2.48 14 KRS05-09-J* 100 440 11 49.20 0.16 0.11* 0.62 0.20 4.34 5.05* 15 KRS05-09-K* 0 410 11 59.50 0.18 0.10* 0.61 0.18 5.70* 7.21* 16 KRS05-09-M 0 500 14 55.60 0.09 0.06 0.81 0.15 1.56 2.84 17 KRS06-05-F 230 500 10 54.60 0.08 0.05 0.63 0.20 1.02 1.84 18 KRS06-07-K 100 470 12 38.70 0.06 0.05 0.66 0.15 4.1 3.42 19 KRS06-07-O 100 470 12 42.60 0.06 0.05 0.64 0.16 3.49 3.14 20 KRS07-04-F 290 540 9 16.80 0.03 0.06 0.64 0.22 3.29 3.92 21 KRS07-04-N* 200 500 11 19.80 0.06 0.10* 0.65 0.16 3.39 4.57 22 KRS07-04-T* 200 470 10 19.50 0.06 0.11* 0.50* 0.15 4.30 5.00 23 KRS10-02-A* 150 350 7 36.10 0.04 0.04 0.50* 0.22 3.62 4.74
Specimen Stepmin Stepmax N Ba (µT) Ba (µT) FRAC GAP-MAX DANG ( ) MAD ( ) 24 KRS10-03-D 100 440 11 35.10 0.06 0.06 0.73 0.27 0.97 3.53 25 KRS10-03-G 200 440 9 34.10 0.03 0.03 0.60 0.19 1.10 1.76 26 KRS10-03-H 100 350 8 33.90 0.03 0.03 0.64 0.26 3.06 2.48 27 KRS10-04-F 150 500 12 29.00 0.02 0.03 0.65 0.14 2.39 2.45 28 KRS10-04-G 100 470 12 31.10 0.02 0.02 0.60 0.16 3.81 2.54 29 KRS10-04-I* 150 410 9 33.60 0.06 0.07 0.37* 0.24 3.49 3.58 30 KRS10-06-G* 200 440 9 36.00 0.11 0.11* 0.51* 0.42 0.83 2.91 31 KRS13-06-E 0 410 11 53.80 0.10 0.07 0.71 0.14 0.69 3.49 32 KRS13-06-F 0 380 10 53.50 0.12 0.08 0.65 0.17 3.55 4.68 33 KRS13-06-G* 150 380 8 52.90 0.16 0.10* 0.52* 0.20 1.21 7.10* 34 KRS17-04-E* 150 410 9 39.90 0.11 0.10* 0.52* 0.22 4.28 3.37 35 KRS17-04-F 0 440 12 39.30 0.08 0.07 0.68 0.12 4.96 3.72 36 KRS17-04-G* 100 380 9 39.00 0.08 0.07 0.52* 0.17 5.06* 3.85 37 KRS1A-01-B* 100 350 8 62.30 0.34 0.19* 0.41* 0.29 27.60* 4.00 38 KRS1A-02-A* 100 540 14 63.30 0.32 0.18* 0.92 0.17 12.27* 4.78 39 KRS1A-03-A* 150 540 13 61.60 0.43 0.24* 0.86 0.18 17.93* 3.55 40 KRS1B-03-A* 150 410 9 28.80 0.19 0.23* 0.43* 0.20 18.89* 4.15 41 KRS1D-04-A* 100 410 10 30.70 0.08 0.09 0.54* 0.16 12.39* 10.48* 42 KRS1E-03-A* 100 410 10 34.00 0.08 0.08 0.64 0.15 10.09* 6.37* 43 KRS1E-05-A* 100 440 11 38.40 0.13 0.12* 0.66 0.16 7.45* 4.40 44 KRS1F-01-B* 100 380 9 11.30 0.08 0.23* 0.18* 0.20 29.33* 11.99* 45 KRS1F-02-A* 100 350 8 13.00 0.06 0.17* 0.17* 0.24 14.60* 14.92* 46 KRS21-02-A* 100 500 13 38.50 0.14 0.12 0.65 0.66 1.84 1.16 47 KRS21-02-E* 100 580 15 35.00 0.15 0.15* 0.54* 0.62* 1.61 1.29 48 KRS21-02-F* 100 540 14 36.00 0.16 0.15 0.42 0.53 2.27 1.72 49 KRS21-09-A 100 580 15 33.80 0.06 0.06 0.69 0.28 1.12 1.95 50 KRS21-09-F* 0 320 8 32.20 0.11 0.12* 0.96 0.56 3.63 5.84* 51 KRS21-09-H* 100 320 7 46.30 0.41 0.31* 0.29* 0.72* 3.00 1.29 52 KRS23-04-A 150 540 13 32.60 0.01 0.01 0.73 0.34 3.86 4.12 53 KRS23-04-C 150 540 13 36.00 0.02 0.02 0.81 0.32 1.44 2.06
Specimen Stepmin Stepmax N Ba (µT) Ba (µT) FRAC GAP-MAX DANG ( ) MAD ( ) 54 KRS23-04-H* 100 440 11 43.90 0.12 0.09 0.36* 0.21 7.76* 4.06 55 KRS23-04-I 0 350 9 37.70 0.03 0.03 0.70 0.40 2.89 2.59 56 KRS23-05-A 290 540 9 26.20 0.06 0.08 0.70 0.28 1.29 2.60 57 KRS23-05-F 0 380 10 39.80 0.04 0.04 0.69 0.22 1.85 3.04 58 KRS23-06-D 380 620 8 45.00 0.02 0.02 0.70 0.20 0.37 1.49 59 KRS23-06-I 350 580 8 44.00 0.03 0.03 0.63 0.21 1.35 1.43 60 KRS23-06-N* 150 440 10 39.50 0.12 0.10* 0.61 0.21 4.45 9.02* 61 KRS23-06-S* 150 470 11 40.40 0.11 0.09* 0.72 0.22 4.21 3.45 62 KRS23-07-G* 150 540 13 39.00 0.09 0.08 0.86 0.15 5.45* 6.05* 63 KRS23-07-I 0 350 9 46.80 0.06 0.04 0.64 0.19 1.74 4.96 64 KRS24-02-K* 100 410 10 37.60 0.05 0.05 0.61 0.18 4.25 9.44* 65 KRS24-02-L* 100 350 8 44.60 0.10 0.08 0.51* 0.21 3.51 12.24* 66 KRS24-05-F* 200 500 11 24.70 0.07 0.10 0.68 0.27 21.53* 12.02* 67 KRS24-05-G* 100 410 10 43.60 0.07 0.05 0.35* 0.22 6.58* 5.89* 68 KRS24-05-K* 100 350 8 41.40 0.07 0.06 0.34* 0.33 14.13* 4.12 69 KRS24-05-V 290 580 10 45.60 0.05 0.04 0.64 0.18 1.39 3.25 70 KRS24-05-Y 0 500 14 45.30 0.04 0.03 0.68 0.14 4.16 3.79 71 KRS24-06-I* 0 410 11 42.50 0.06 0.05 0.42* 0.26 2.26 3.05 72 KRS24-06-J* 100 380 9 42.60 0.08 0.07 0.38* 0.23 3.60 8.19* 73 KRS2A-03-A* 150 440 10 44.30 0.12 0.10* 0.51* 0.15 4.85 5.60* 74 KRS2A-04-B* 100 380 9 35.60 0.08 0.08 0.40* 0.17 5.16* 8.59* 75 KRS2A-05-A* 150 440 10 49.80 0.16 0.11* 0.59* 0.19 1.50 4.89 76 KRS2B-04-B* 150 410 9 40.50 0.10 0.09* 0.49* 0.17 4.14 6.49* 77 KRS2B-05-A* 200 350 6 24.00 0.15 0.23* 0.27* 0.32 23.75* 15.95* 78 KRS2D-01-A* 100 380 9 35.50 0.12 0.12* 0.54* 0.23 5.98* 6.66* 79 KRS2D-02-B* 150 440 10 33.80 0.13 0.14* 0.49* 0.22 3.65 8.57* 80 KRS30-08-A* 100 230 4* 45.40 0.19 0.14* 0.21* 0.40 7.58 3.94 81 KRS30-08-C 0 350 9 45.80 0.06 0.05 0.69 0.21 3.47 3.13 82 KRS30-08-D 0 290 7 41.20 0.03 0.03 0.62 0.24 2.07 1.72 83 KRS33-01-A 100 500 13 59.30 0.06 0.03 0.68 0.15 1.72 2.19
Specimen Stepmin Stepmax N Ba (µT) Ba (µT) FRAC GAP-MAX DANG ( ) MAD ( ) 84 KRS33-01-B 0 440 12 68.20 0.04 0.02 0.61 0.15 2.40 3.13 85 KRS33-01-C 260 540 10 78.90 0.07 0.03 0.62 0.29 0.11 0.91 86 KRS34-03-B* 100 440 11 39.50 0.07 0.07 0.39* 0.17 11.91* 10.29* 87 KRS34-03-C* 200 470 10 39.40 0.06 0.06 0.56* 0.35 6.69* 4.42 88 KRS34-05-C* 150 500 12 28.90 0.08 0.10* 0.62 0.15 7.16* 15.37* 89 KRS34-05-D* 100 410 10 38.00 0.09 0.08 0.51* 0.16 3.97 9.00* 90 KRS34-05-E 200 620 14 40.70 0.04 0.03 0.78 0.23 3.91 3.39 91 KRS34-05-F 290 620 11 38.60 0.04 0.04 0.63 0.16 3.07 2.77 92 KRS34-05-N 380 620 8 40.70 0.06 0.06 0.60 0.40 2.10 0.79 93 KRS34-06-C* 150 440 10 40.70 0.07 0.06 0.66 0.16 2.06 5.75* 94 KRS34-06-D 0 500 14 40.80 0.03 0.03 0.79 0.11 3.26 4.99 95 KRS34-06-E* 150 440 10 40.60 0.10 0.09* 0.63 0.19 3.40 7.33* 96 KRS34-06-F 0 470 13 41.70 0.03 0.02 0.63 0.14 0.73 2.34 97 KRS34-06-I 0 440 12 42.30 0.02 0.02 0.67 0.12 4.04 4.88 98 KRS35-01-A 0 380 10 39.40 0.05 0.05 0.68 0.36 4.91 4.06 99 KRS35-01-C* 100 410 10 32.80 0.07 0.07 0.30* 0.23 1.87 3.89 100 KRS35-01-D 150 540 13 34.70 0.03 0.03 0.62 0.36 0.32 1.26 101 KRS35-01-E 100 540 14 34.60 0.02 0.02 0.82 0.21 1.70 2.86 102 KRS35-02-D* 0 410 11 34.50 0.05 0.05 0.52* 0.28 4.60 6.55* 103 KRS35-02-G* 100 410 10 34.80 0.07 0.07 0.40* 0.22 0.96 7.74* 104 KRS35-05-A 100 620 16 36.90 0.06 0.06 0.74 0.57 1.52 1.41 105 KRS35-05-B 100 540 14 33.20 0.04 0.04 0.76 0.22 0.88 1.65 106 KRS35-05-E* 0 350 9 30.30 0.04 0.05 0.48* 0.37 4.47 3.37 107 KRS35-05-F 0 260 6 34.90 0.04 0.04 0.71 0.44 2.32 2.75 108 KRS35-05-I 100 580 15 35.30 0.04 0.04 0.72 0.23 0.43 1.17 109 KRS35-07-A* 100 380 9 35.90 0.10 0.10* 0.34* 0.28 7.71 9.11* 110 KRS35-07-F 0 410 11 37.00 0.05 0.05 0.61 0.26 3.44 3.68 111 KRS3A-04-A* 100 410 10 36.00 0.10 0.09 0.64 0.21 6.27* 5.97 112 KRS3B-04-A* 100 410 10 35.40 0.13 0.12* 0.62 0.31 5.03* 4.72 113 KRS3B-05-B* 100 410 10 34.10 0.11 0.11* 0.65 0.22 8.22* 5.09*
Specimen Stepmin Stepmax N Ba (µT) Ba (µT) FRAC GAP-MAX DANG ( ) MAD ( ) 114 KRS3D-03-A 0 410 11 36.20 0.07 0.07 0.75 0.21 4.78 3.54 115 KRS3E-02-B* 100 470 12 51.90 0.09 0.06 0.50* 0.19 10.07* 4.19 116 KRS3E-04-A* 100 350 8 24.30 0.04 0.06 0.33* 0.18 17.90* 7.06* 117 KRS4B-01-A 100 580 15 45.60 0.03 0.02 0.69 0.23 2.65 4.34 118 KRS4B-02-B* 100 380 9 45.20 0.10 0.08 0.35* 0.56 2.58 5.32* 119 KRS4D-04-A* 100 410 10 43.00 0.10 0.08 0.41* 0.35 4.22 11.82* 120 KRS4E-05-A* 0 580 16 34.70 0.02 0.03 0.84 0.16 1.77 5.72* Average 115 483 11 42.46 0.05 0.04 0.68 0.22 2.38 2.83 Stdev. 114 89 2 10.73 0.03 0.02 0.06 0.09 1.32 1.07
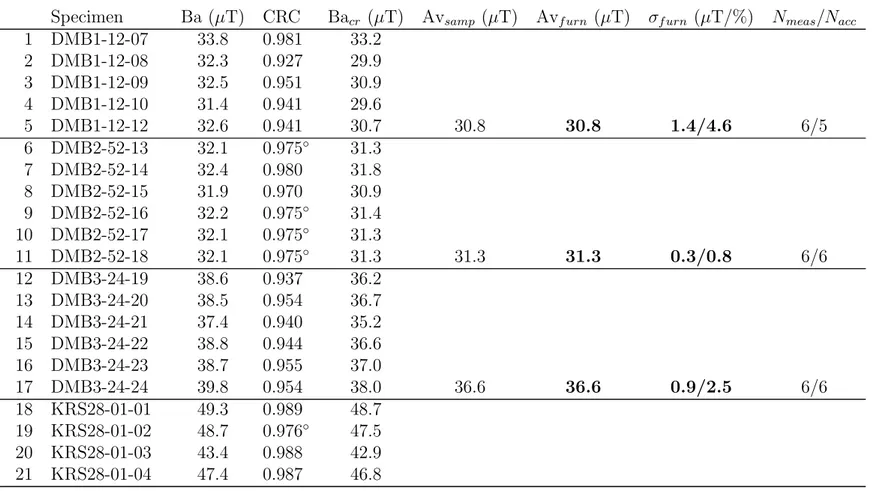
Tab. S5: Calculation of the furnace averages with cooling rate correction of Korsimoro (KRS), Doumbala (DMB) and
Siola (SIO) specimens. Ba is the specimen archaeointensity; CRC the cooling rate correction factor; Bacr is the cooling
rate corrected intensity; Avsamp is the (cooling rate corrected) sample average; Avf urn is the (cooling rate corrected) furnace
average and f urn is its corresponding standard deviation in µT and in %; and Nmeas/Nacc is the ration between the number
of specimens measured and accpeted. CRCs with a are averaged, whereas those without * are specimens correction factors. Specimens with a star were rejected because there was only one specimen available for the average. Number 1 to 40 were
obtained with the Thellier-Coe protocol, number 41 to 90 are from Kapper et al.1. Numbers 91 to 121 were obtained with
the pseudoThellier protocol. Pseudo-Thellier specimens marked with ’2’ were measured in Zurich.
Specimen Ba (µT) CRC Bacr (µT) Avsamp (µT) Avf urn (µT) f urn (µT/%) Nmeas/Nacc
1 DMB1-12-07 33.8 0.981 33.2 2 DMB1-12-08 32.3 0.927 29.9 3 DMB1-12-09 32.5 0.951 30.9 4 DMB1-12-10 31.4 0.941 29.6 5 DMB1-12-12 32.6 0.941 30.7 30.8 30.8 1.4/4.6 6/5 6 DMB2-52-13 32.1 0.975 31.3 7 DMB2-52-14 32.4 0.980 31.8 8 DMB2-52-15 31.9 0.970 30.9 9 DMB2-52-16 32.2 0.975 31.4 10 DMB2-52-17 32.1 0.975 31.3 11 DMB2-52-18 32.1 0.975 31.3 31.3 31.3 0.3/0.8 6/6 12 DMB3-24-19 38.6 0.937 36.2 13 DMB3-24-20 38.5 0.954 36.7 14 DMB3-24-21 37.4 0.940 35.2 15 DMB3-24-22 38.8 0.944 36.6 16 DMB3-24-23 38.7 0.955 37.0 17 DMB3-24-24 39.8 0.954 38.0 36.6 36.6 0.9/2.5 6/6 18 KRS28-01-01 49.3 0.989 48.7 19 KRS28-01-02 48.7 0.976 47.5 20 KRS28-01-03 43.4 0.988 42.9 21 KRS28-01-04 47.4 0.987 46.8
Specimen Ba (µT) CRC Bacr (µT) Avsamp (µT) Avf urn (µT) f urn (µT/%) Nmeas/Nacc 22 KRS28-01-05 52.1 0.940 49.0 23 KRS28-01-06 54.0 0.976 52.7 47.9 47.9 3.2/6.7 6/6 24 SIO1BA-27 45.9 0.939 43.1 25 SIO1BA-28 51.4 0.884 45.4 26 SIO1BA-29 38.5 0.912 35.1 41.2 41.2 5.4/13.2 6/3 27 SIO4BA-37 43.8 0.975 41.9 28 SIO4BA-38 48.1 0.899 43.3 29 SIO4BA-39 51.4 0.977 50.2 30 SIO4BA-40 48.3 0.973 47.0 31 SIO4BA-41 48.3 0.978 47.2 32 SIO4BA-42 55.0 0.960 52.8 47.1 47.1 4.1/8.7 6/6 33 SIO5GA-44 43.5 0.983 42.7 34 SIO5GA-45 48.1 0.983 47.3 35 SIO5GA-46 45.4 0.983 44.6 36 SIO5GA-47 46.6 0.983 45.8 37 SIO5GA-48 44.8 0.983 44.0 44.9 38 SIO5GC-50 47.0 0.969 45.5 39 SIO5GC-51 43.1 0.971 41.8 40 SIO5GC-52 40.4 0.974 39.3 42.2 43.6 1.9/4.3 12/8 41 KRS05-04-J 53.0 0.950 50.4 42 KRS05-04-K 51.6 0.950 49.0 49.7 43 KRS05-08-K 53.4 0.950 50.7 44 KRS05-08-L 54.4 0.950 51.7 51.2 45 KRS05-09-I 53.7 0.950 51.0 46 KRS05-09-M 55.6 0.950 52.8 51.9 50.9 1.1/2.2 16/6 47 KRS06-05-F 54.6 0.950 51.9 51.9 48 KRS06-07-K 38.7 0.950 36.8 49 KRS06-07-O 42.6 0.950 40.5 38.6 45.3 9.4/20.7 3/3 50 KRS07-04-F* 16.8 0.950 16.0 3/1
Specimen Ba (µT) CRC Bacr (µT) Avsamp (µT) Avf urn (µT) f urn (µT/%) Nmeas/Nacc 51 KRS10-03-D 35.1 0.938 32.9 52 KRS10-03-G 34.1 0.948 32.3 53 KRS10-03-H 33.9 0.948 32.1 32.5 54 KRS10-04-F 29.0 0.948 27.5 55 KRS10-04-G 31.1 0.948 29.5 28.5 30.5 2.8/9.2 8/5 56 KRS13-06-E 53.8 0.950 51.1 57 KRS13-06-F 53.5 0.950 50.8 51.0 51.0 0.2/0.4 3/2 58 KRS17-04-F* 39.3 0.950 37.3 3/1 59 KRS21-09-A* 33.8 0.969 32.7 6/1 60 KRS23-04-A 32.6 0.970 31.6 61 KRS23-04-C 36.0 0.970 34.9 62 KRS23-04-I 37.7 0.964 36.3 34.3 63 KRS23-05-A 26.2 1.166 30.5 64 KRS23-05-F 39.8 0.902 35.9 33.2 65 KRS23-06-D 45.0 0.970 43.7 66 KRS23-06-I 44.0 0.970 42.7 43.2 67 KRS23-07-I 46.8 0.901 42.2 42.2 38.2 5.2/13.6 12/8 68 KRS24-05-V 45.6 0.939 42.8 69 KRS24-05-Y 45.3 0.939 42.5 42.7 42.7 0.2/0.5 9/2 70 KRS30-08-C 45.8 0.950 43.5 71 KRS30-08-D 41.2 0.950 39.1 41.3 41.3 3.1/7.6 3/2 72 KRS33-01-A 59.3 0.950 56.3 73 KRS33-01-B 68.2 0.950 64.8 74 KRS33-01-C 78.9 0.950 75.0 65.4 65.4 9.3/14.3 3/3 75 KRS34-05-E 40.7 0.940 38.3 76 KRS34-05-F 38.6 0.940 36.3 77 KRS34-05-N 40.7 0.940 38.3 37.6 78 KRS34-06-D 40.8 0.940 38.3 79 KRS34-06-F 41.7 0.940 39.2
Specimen Ba (µT) CRC Bacr (µT) Avsamp (µT) Avf urn (µT) f urn (µT/%) Nmeas/Nacc 80 KRS34-06-I 42.3 0.940 39.8 39.1 38.3 1.1/2.8 12/6 81 KRS35-01-A 39.4 0.922 36.3 82 KRS35-01-D 34.7 0.922 32.0 83 KRS35-01-E 34.6 0.922 31.9 33.4 84 KRS35-05-A 36.9 0.922 34.0 85 KRS35-05-B 33.2 0.922 30.6 86 KRS35-05-F 34.9 0.972 33.9 87 KRS35-05-I 35.3 0.922 32.5 32.8 88 KRS35-07-F 37.0 0.881 32.6 32.6 32.9 0.4/1.3 13/8 89 KRS3D-03-A* 36.2 0.952 34.5 90 KRS4B-01-A* 45.6 0.930 42.4 91 DMB1-1-3 27.2 92 DMB1-1-5 35.2 93 DMB1-1-6 34.3 94 DMB1-1-7 34.2 32.7 32.7 3.7/11.4 5/4 95 DMB2-5-3 29.5 96 DMB2-5-4 29.6 97 DMB2-5-5 32.9 98 DMB2-5-7 33.5 31.4 31.4 2.1/6.8 5/4 99 DMB6-6-3 38.6 100 DMB6-6-7 36.4 101 DMB6-6-8 39.6 38.2 38.2 1.6/4.2 5/3 102 KRS06-05-D* 47.8 5/1 103 KRS10-04-H*2 32.0 3/1 104 KRS21-02-H 22.6 105 KRS21-09-C 29.6 26.1 26.1 4.9/18.9 4/2 106 KRS23-04-B2 37.6 107 KRS23-04-C 23.9 30.7 108 KRS23-05-C 31.9 31.9
Specimen Ba (µT) CRC Bacr (µT) Avsamp (µT) Avf urn (µT) f urn (µT/%) Nmeas/Nacc 109 KRS23-06-A 38.6 110 KRS23-06-G 32.9 35.7 111 KRS23-07-J 30.9 30.9 32.3 2.3/7.2 7/6 112 KRS28-01-I* 33.8 5/1 113 KRS30-08-B 28.4 114 KRS30-08-F 27.0 115 KRS30-08-M2 51.2 35.5 35.5 13.6/38.3 6/3 116 KRS35-05-H 20.6 117 KRS35-08-D 24.0 22.3 22.3 2.5/11.0 5/2 118 SIO1A-1 28.3 119 SIO1B-1 27.1 27.7 27.7 0.8/3.0 5/2 120 SIO3B-1* 44.2 4/1 121 SIO5A-1* 38.8 5/1
Tab. S6: Data compilation used for the reference curves. Age and Age are the age and age uncertainty, respectively. Ba
and Ba are the intensity and its standard error, and Barl (µT) is the relocated intensity. Lat and Lon are latitude and
longitude. The di↵erent countries are indicated as follows: MA = Mali, SE = Senegal, LI = Libya, MO = Morocco, TU = Tunisia, BF = Burkina Faso, CI = Canary Islands, IC = Ivory Coast. GEOM in the ’Reference’ column indicates that the
data was obtained from the Geomagia50.v3.22 database. KRS, DMB and SIO are results from this study or from Kapper
et al.1 from Korsimoro, Doumbala and Siola, respectively. TT and PT indicate results from Thellier or pseudoThellier
experiment.
Nr. Age (yr AD) Age (yrs) Ba (µT) Barl (µT) Ba (µT) Lat ( ) Lon ( ) Country Reference
1 27.0 47.0 40.1 43.6 2.5 13.71 -4.51 MA 3, GEOM 2 124.0 73.0 38.9 41.3 3.1 16.01 -13.61 SE 4, GEOM 3 125.0 25.0 55.0 47.2 0.0 32.80 13.10 LI 3, GEOM 4 125.0 48.0 41.9 45.6 0.4 13.71 -4.51 MA 5, GEOM 5 150.0 50.0 53.3 44.2 4.2 35.50 -6.00 MO 6 6 150.0 150.0 86.6 72.0 14.1 35.38 11.03 TU 6 7 200.0 100.0 71.0 58.8 8.8 35.67 10.87 TU 3, GEOM 8 221.0 70.0 36.2 38.4 1.6 16.01 -13.61 SE 5, GEOM 9 250.0 50.0 58.1 49.0 4.8 34.10 -5.50 MO 7 10 262.0 160.0 60.4 50.2 5.3 35.26 11.00 TU 3, GEOM 11 271.0 58.0 35.9 38.4 1.5 15.31 -5.51 MA 3 12 315.5 94.5 34.9 37.1 1.2 16.01 -13.61 SE 6 13 436.5 83.5 95.5 78.5 15.1 36.25 10.40 TU 5, GEOM 14 450.0 50.0 54.5 46.0 4.1 34.10 -5.50 MO 8 15 450.0 50.0 63.9 52.4 10.6 36.44 10.72 TU 3, GEOM 16 485.0 75.0 36.4 38.7 2.7 16.01 -13.61 SE 3, GEOM 17 502.0 72.0 35.3 37.6 3.3 15.81 -13.31 SE 8 18 550.0 50.0 37.5 30.8 8.0 36.48 10.78 TU 3 19 563.0 61.0 38.8 41.2 1.3 15.81 -13.31 SE 3, GEOM 20 624.0 52.0 42.2 45.0 1.5 15.81 -13.31 SE 3, GEOM 21 664.0 31.0 43.4 47.2 3.5 13.71 -4.51 MA KRS33, TT 22 720.0 60.0 65.4 71.8 9.3 12.81 -0.99 BF KRS05, TT
Nr. Age (yr AD) Age (yrs) Ba (µT) Barl (µT) Ba (µT) Lat ( ) Lon ( ) Country Reference 23 800.0 90.0 50.9 56.0 1.1 12.81 -1.06 BF KRS06, TT 24 800.0 90.0 45.3 49.7 9.4 12.81 -1.06 BF 3, GEOM 25 815.0 81.0 37.0 39.3 4.1 15.81 -13.31 SE 9, GEOM 26 852.0 52.0 65.2 54.0 6.2 35.60 10.06 TU 8 27 863.0 88.0 51.4 42.5 5.9 35.78 10.83 TU 3, GEOM 28 899.0 56.0 39.6 42.4 1.0 15.31 -5.51 MA 10 29 925.0 50.0 43.6 39.6 4.4 28.51 -17.83 CI 9, GEOM 30 1028.0 28.0 62.8 52.0 12.7 35.66 10.10 TU 9, GEOM 31 1028.0 28.0 62.7 51.9 5.7 35.66 10.10 TU 9, GEOM 32 1028.0 28.0 58.0 48.0 4.5 35.66 10.10 TU 9, GEOM 33 1028.0 28.0 58.6 48.5 4.3 35.66 10.10 TU 11 34 1055.0 155.0 57.9 52.7 6.4 28.27 -16.73 CI 12 35 1058.0 0.0 81.6 74.3 0.1 28.27 -16.63 CI KRS35, TT 36 1100.0 75.0 32.9 36.2 0.4 12.81 -1.06 BF KRS35, PT 37 1100.0 75.0 22.3 24.5 2.5 12.81 -1.06 BF KRS24, TT 38 1120.0 90.0 42.7 46.9 0.2 12.79 -1.09 BF 8 39 1200.0 25.0 44.1 36.6 2.5 35.51 11.08 TU 8 40 1200.0 25.0 46.1 38.3 4.7 35.51 11.08 TU 8 41 1200.0 25.0 48.6 40.3 1.6 35.51 11.08 TU 8 42 1200.0 25.0 46.6 38.7 3.7 35.51 11.08 TU KRS34, TT 43 1290.0 20.0 38.3 42.1 1.1 12.81 -1.06 BF KRS10, TT 44 1340.0 55.0 30.5 33.5 2.8 12.79 -1.09 BF 9, GEOM 45 1350.0 60.0 45.7 38.5 4.4 34.31 -5.93 MO DMB6, PT 46 1350.0 65.0 38.2 43.1 1.6 9.88 -7.41 IC KRS21, PT 47 1400.0 100.0 26.1 28.7 4.9 12.79 -1.09 BF KRS23, TT 48 1430.0 20.0 38.2 42.0 5.2 12.79 -1.09 BF KRS23, PT 49 1430.0 20.0 32.3 35.5 2.3 12.79 -1.09 BF 13 50 1470.0 0.0 41.5 37.9 7.4 28.00 -15.60 CI 10 51 1481.0 0.0 36.0 32.6 11.3 28.65 -17.86 CI SIO4, TT 52 1545.0 55.0 47.1 53.1 4.1 9.86 -7.45 IC 11
Nr. Age (yr AD) Age (yrs) Ba (µT) Barl (µT) Ba (µT) Lat ( ) Lon ( ) Country Reference 53 1550.0 110.0 71.5 65.1 16.5 28.28 -16.77 CI DMB3, TT 54 1550.0 100.0 36.6 41.3 0.9 9.88 -7.41 IC 10 55 1585.0 0.0 46.4 42.1 18.0 28.58 -17.89 CI 14, GEOM 56 1595.0 7.0 42.2 37.1 3.6 31.00 -8.00 MO 10 57 1646.0 0.0 44.2 40.1 0.4 28.52 -17.82 CI KRS13, TT 58 1650.0 150.0 51.0 56.0 0.2 12.81 -1.06 BF KRS28, TT 59 1650.0 50.0 47.9 52.7 3.2 12.79 -1.09 BF KRS30, TT 60 1650.0 50.0 41.3 45.4 3.1 12.79 -1.09 BF KRS30, PT 61 1650.0 50.0 35.5 39.0 13.6 12.79 -1.09 BF 10 62 1677.0 0.0 46.6 42.3 0.0 28.48 -17.87 CI 13 63 1704.0 0.0 43.1 39.2 4.9 28.25 -16.60 CI 13 64 1705.0 0.0 37.3 34.0 2.1 28.25 -16.60 CI 12 65 1706.0 0.0 39.4 35.9 0.9 28.27 -16.63 CI 11 66 1706.0 0.0 49.9 45.4 3.9 28.36 -16.76 CI 10 67 1712.0 0.0 45.4 41.2 2.8 28.55 -17.87 CI 15 68 1733.5 0.0 40.2 36.2 1.7 29.01 -13.76 CI SIO1B, TT 69 1815.0 135.0 41.2 46.5 5.4 9.86 -7.45 IC SIO1B, PT 70 1815.0 135.0 27.7 31.3 0.8 9.86 -7.45 IC 15 71 1824.0 0.0 41.4 37.3 2.3 29.01 -13.75 CI SIO5, TT 72 1870.0 60.0 43.6 49.2 1.9 9.86 -7.45 IC DMB1, TT 73 1895.0 80.0 30.8 34.8 1.4 9.88 -7.41 IC DMB1, PT 74 1895.0 80.0 32.7 36.9 3.7 9.88 -7.41 IC DMB2, TT 75 1895.0 80.0 31.3 35.3 0.3 9.88 -7.41 IC DMB2, PT 76 1895.0 80.0 31.4 35.4 2.1 9.88 -7.41 IC 13 77 1909.0 0.0 42.6 38.8 4.0 28.25 -16.60 CI 10 78 1949.0 0.0 34.7 31.4 8.1 28.59 -17.88 CI 16 79 1949.0 0.0 40.5 36.6 0.0 28.89 -17.87 CI 10 80 1971.0 0.0 35.8 32.5 7.9 28.46 -17.85 CI 10
References
1. Kapper, L. et al. Reconstructing the Geomagnetic Field in West Africa: First Absolute Intensity Results from Burkina Faso. Sci. Rep. 7, 12 (2017).
2. Brown, M. C. et al. GEOMAGIA50.v3: 1. general structure and modifications to the archeological and volcanic database. Earth, Planets Sp. 67, 67–83 (2015).
3. Mitra, R., Tauxe, L., Keech McIntoshf, S. Two thousand years of archeointensity from West Africa. Earth Planet. Sci. Lett. 364, 123–133 (2013).
4. Odah, H. Using the Thellier Method. J. Geomagn. Geoelectr. 47, 41–58 (1995).
5. Kovacheva, M. A. Some Archaeomagnetic Conclusions from 3 Archaeological Localities in Northwest Africa. Dokladi na Bolgarskata Akademiya na Naukite 37(2), 171-174 (1984).
6. Fouzai, B., Casas, L., Laridhi Ouazaa, N., Fantar, M., ´Alvarez, A. Archaeomagnetic data from three Roman sites in
Tunisia. J. Archaeol. Sci. 40, 1703–1714 (2012).
7. Fouzai, B., Casas, L., Laridhi Ouazaa, N., Fantar, M., ´Alvarez, A. Archaeomagnetic data from three Punic sites in
Tunisia. J. Archaeol. Sci. 40, 1703–1714 (2013).
8. Casas, L. et al. New Archaeomagnetic Data from Tunisia: Dating of Two Kilns and New Archaeointensities from Three Ceramic Artifacts. Geoarchaeology 31, 564–576 (2016).
9. G´omez-Paccard, M. et al. Archaeomagnetic and rock magnetic study of six kilns from North Africa (Tunisia and Morocco). Geophys. J. Int. 189, 169–186 (2012).
10. Monster, M. W. L., de Groot, L. V., BIGGIN, A. J., Dekkers, M. J. The performance of various palaeointensity techniques as a function of rock magnetic behaviour – A case study for La Palma. Phys. 242, 36–49 (2015).
11. Kissel, C. et al. Holocene geomagnetic field intensity variations: Contribution from the low latitude Canary Islands site. Earth Planet. Sci. Lett. 430, 178–190 (2015).
12. de Groot, L. V. et al. High paleointensities for the Canary Islands constrain the Levant geomagnetic high. Earth Planet. Sci. Lett. 419, 154–167 (2015).
13. Sherwood, G. J. Evaluation of a multi-specimen approach to palaeointensity determination. J. Geomagn. Geoelectr. 43, 341–349 (1991).
14. Casas, L., Brians´o, J. L., ´Alvarez, A., Benzzi, K., Shaw, J. Archaeomagnetic intensity data from the Saadien Tombs
(Marrakech, Morocco), late 16th century. Phys. Chem. Earth 33, 474–480 (2008).
15. Calvo-Rathert, M., Morales-Contreras, J., Carrancho, ´A., Goguitchaichvili, A. A comparison of Thellier-type and
multispecimen paleoinetnsity determinations on Pleistocene and historical lava flows from Lanzarote (Canary Islands, Spain). Geochemistry Geophys. Geosystems 17, 2825–2834 (2016).
16. Valet, J. P., Herrero-Bervera, E., Carlut, J., Kondopoulou, D. A selective procedure for absolute paleointensity in lava flows. Geophys. Res. Lett. 37, 1–7 (2010).