CORPORATE VALUE CREATION FOR JAPAN'S CONSTRUCTION FIRMS IN THE SHRINKING AND CHANGING DOMESTIC MARKET
by
Masahiko Kanari
B. Eng., Department of Architecture Waseda University, Tokyo, Japan
(1991)
Submitted to the Department of Civil and Environmental Engineering in Partial Fulfillment of the Requirements for the Degree of
MASTER OF SCIENCE
in Civil and Environmental Engineering at the
Massachusetts Institute of Technology June 2003
© 2003 Masahiko Kanari, All right reserved.
MASSACHUSETS INSTITUTE OF TECHNOLOGY
JUN 0 2 2003
LIBRAR IES
The author hereby grants to MIT permission to reproduce and distribute publicly paper and electronic copies of this thesis document in whole or in part.
Signature of Author
Certified by
Department of Civil and Environmental Engineering May 1, 2003
#lred Moavenzadeh James Mason Crafts Professor of Engineering Systems
Professor of 9ivil and Environmental Engineering Thesis Supervisor Accepted by
CORPORATE VALUE CREATION FOR JAPAN'S CONSTRUCTION FIRMS IN THE SHRINKING AND CHANGING DOMESTIC MARKET
by
Masahiko Kanari
Submitted to the Department of Civil and Environmental Engineering on May 1, 2003 in Partial Fulfillment of the requirements for the Degree of Master of Science in Civil and Environmental Engineering. ABSTRACT
As Japan's bubble economy collapsed, the time when the economy was surely growing was finished. In this high economic growth period, the social system such as Keiretsu (a network of Japan's firms organized around main bank), the seniority system, and lifetime employment, had formed centering on harmony. But now this system is disappearing. In addition, the introduction of International Accounting Standards (IAS) ruthlessly discloses the real financial conditions of Japan's firms and drives the firms to adverse circumstances. The firms have to sustain these changes and compete to survive in the shrinking market.
It is the time also for Japan's construction firms to change their business policy. The time when keeping a constant share always brought promised profits and the all firms coexisted in harmony has ended. The firms now have to pay attention to their profit rates and promote shareholders' interests as a top priority. At last, the firms have started to take serious approach to create their corporate value.
The main purpose of this thesis is to find ways for the construction firms to create corporate value in Japan's shrinking construction market. To accomplish this purpose, the thesis studies the following three points: (1) the profit structure of Japan's construction firms, (2) the effect of introduction of IAS, especially introduction of cash flow statements, and (3) valuation methods. These three points lead the following three factors to value firms: (1) Invested capital, (2) Free cash flows, and (3) Weighted average cost of capital. The discounted cash flow model including EVA and MVA uses these three factors to value firms. Moreover, the real option method can add the value of the firms' management flexibilities. Real options are becoming crucial for corporate valuation in this uncertain market.
In the end of the thesis, it verifies these valuation methods by using the financial data of Japan's construction firms in fiscal 2001. These valuation methods allow the firms to find right directions in which they should follow in order to create their value in the changing and shrinking construction market.
ACKNOWLEDGEMENTS
I would like to express my gratitude, first, to Professor Moavenzadeh, who was my academic and thesis advisor. His encouragement and suggestions were invaluable for me to finish my research.
I also would like to express my appreciation to Obayashi Corporation for generously supporting my research and giving me the opportunity to study at MIT. Moreover, during his stays in Boston, Mr. Takeo Obayashi, a vice chairman of Obayashi Corporation, gave me a lot of insightful suggestions and ideas for my research. His clear and acute perspective on the construction industry impressed me very much.
I also would like to express my thanks to my colleagues whom I worked with at Obayashi. They understood my desire to study abroad, and supported me greatly before I came here. Without their supports, I could not have been here.
I am grateful to my classmates in the Construction Engineering and Management program, who gave me friendship, warm supports, and fun throughout two years at MIT. They also spared their precious time for my research. Their valuable comments and advice always pulled my research back onto the right track.
I wish to thank my father Tsunetomo, my mother Michiko, and my support, help, and encouragement was indispensable during my research.
Finally, I wish to thank Ko-Hsin, my fiancee. this work could not have been completed.
sister Yoko whose
Without your love, support, and fun,
Masahiko Kanari Boston, Massachusetts May, 2003
TABLE OF CONTENTS
TITLE ... ... ...- 1
ABSTRACT ... ...- .. 3
ACKNOW LEDGEM ENT ... 5
TABLE OF CONTENTS ... 7
LIST OF FIGURES ... 11
LIST OF TABLES ... 13
CHAPTER 1 INTRODUCTION ... 15
1.1 Need for Value Creation ... 15
1.2 Value Creation for the Construction Industry ... 15
1.3 Purpose of the Thesis ... 15
1.4 Scope of the Thesis ... 16
CHAPTER 2 BACKGROUND ... 17
2.1 Changing the Driving Force of Japan's Economy ... 17
2.1.1 Harmony ... 17
2.1.2 Competition ... 23
2.2 Interests of Shareholders ... 25
2.3 Struggles for Survival ... 28
2.4 Construction Industry Revitalization Program ... 30
CHAPTER 3 SALES, COSTS, AND PROFITS ... 33
3.1 Characteristics of the Construction Industry ... 33
3.2 Financial Structure Analysis ... 34
3.2.1 Financial Structure ... 34
3.2.2 Ratio Analysis for Financial Structure ... 37
3.3.2 Process of Construction and Accounting Treatments ... 41
3.4 Profit Structure Analysis ... 42
3.4.1 Profit Structure ... 42
3.4.2 Ratio Analysis for Profit Structure ... 45
3.5 Break-even Analysis ... 48
3.6 Declining in Profitability ... 53
CHAPTER 4 CASH FLOW S ... 55
4 .1 C ash F lo w s ... 5 5 4.1.1 Changes in Business Environment ... 55
4.1.2 Definition of Cash Flows ... 56
4.1.3 Relation between Income Statements and Cash Flows ... 58
4.2 International Accounting Standard Setting ... 61
4.2.1 Introduction of IAS ... 61
4.2.2 New Consolidated Accounting Rule ... 62
4.2.3 Fair Value Accounting ... 64
4.2.4 Retirement Benefit Accounting ... 64
4.3 Statement of Cash Flows ... 66
4.3.1 Cash Flow from Operating Activities (CFO) ... 67
4.3.2 Cash Flow from Investing Activities (CFI) ... 68
4.3.3 Cash Flow from Financing Activities (CFF) ... 68
CHAPTER 5 CASH FLOW ANALYSIS ... 69
5.1 Relation among Statement of Cash Flows and Other Financial Statements ... 69
5.2 Cash Flow Analysis ... 71
5.2.1 Solvency Assessment ... 71
5.2.2 Cash Flow Profile Analysis ... 73
5.2.3 Ratio Analysis for Cash Flows ... 77
5.3 M anagement of Cash Flows ... 80
5.3.1 M anagement of CFO ... 80
5.3.3 M anagement of CFF ... 88
5.4 Contractor Rating System for Public Works and Cash Flows ... 89
5.4.1 New indexes of business condition analysis ... 89
5.4.2 Indexes by Cash Flows ... 93
CHAPTER 6 INVESTED CAPITAL, RETURN AND COST OF CAPITAL ... 95
6.1 Free Cash Flows ... 95
6.1.1 Free Cash Flows (FCF) ... 95
6.1.2 Free Cash Flow and Other Cash Flow M easures ... 97
6.1.3 Use of Free Cash Flows ... 98
6.2 Cost of Capital ... 100
6.2.1 W eighted Average Cost of Capital (W ACC) ... 100
6.2.2 W ACC and Capital Structure ... 103
6.3 Return on Invested Capital ... 105
6.3.1 Return on Invested Capital (ROIC) ... 105
6.3.2 Disaggregating ROIC ... 106
CHAPTER 7 VALUATION ... 109
7.1 Discounted Cash Flow M odel (DCF) ... 109
7.1.1 Net Present Value (NPV) ... 109
7.1.2 Economic Value Added (EVA) ... 111
7.1.3 M arket Value Added (M VA) ... 112
7.2 Real Options Value (ROV) ... 113
CHAPTER.8 VALUE CREATION ... 115
8.1 Value of Firm s in the Construction Industry ... 115
8.1.1 M easuring Value of Firm ... 115
8.1.2 Cash Flow M anagement ... 116
8.1.6 Return on Invested Capital ... 129
8.1.7 EVA and M VA ... 131
8.1.8 Real Option Value ... 133
8.2 Value Creation ... 139
8.3 Corporate Value ... 143
CHAPTER.9 CONCLUSIONS ... 145
LIST OF FIGURES Figure 2.1-1: Figure 2.2-1: Figure 2.2-2: Figure 2.3-1: Figure 2.3-2: Figure 3.2-1: Figure 3.3-1: Figure 3.4-1: Figure 3.5-1: Figure 3.5-2: Figure 3.5-3: Figure 3.5-4: Figure 3.6-1: Figure 4.1-1: Figure 4.1-2: Figure 4.1-3: Figure 4.1-4: Figure 4.1-5: Figure 4.3-1: Figure 5.1-1: Figure 5.2-1: Figure 5.2-2: Figure 5.3-1: Figure 5.3-2: Figure 5.3-3: Figure 5.3-4: Figure 5.3-5:
Trend of Construction Investments ... 24
Ratio of Mutual Shareholding ... 25
Equity Ratio of Construction Industry ... 26
Trend of Bankruptcy in Construction Industry ... 28
Trend of Market Share in Construction Industry ... 29
Financial Structure of Obayashi in 2002 ... 36
Construction Process and Accounting Treatments ... 41
The Process of Construction and Revenue Recognition ... 44
B reak-E ven Point ... 48
Marginal Profit & Break-Even Point ... 49
Income Structure of Japan's Major Construction Firms in 2002 ... 50
Profit M axim ization ... 51
Declining Profitability of Construction Industry ... 53
Difference between Profit and Cash ... 57
Difference between Cash Flows and Income Statements ... 58
Relation between Sales and Cash Flows ... 59
Relation between COGP and Cash Flows ... 59
Net Income and Cash Flow with Capital Expenditure ... 60
Three Categories of the Statement of Cash Flows ... 66
Relationship among Financial Statements ... 70
Important Factors in Solvency Assessment ... 72
Relationship of Income Flows and Cash Flows ... 76
Cash Inflows from Construction of Completion ... 81
Computing for Cash Inflows from Construction of Completion ... 82
Cash Outflows for Costs of Construction ... 85
Computing for Cash Outflows for Costs of Construction ... 86
Cash Inflows from Investing Activities ... 87 88
Figure 6.1-2: Figure 6.1-3: Figure 6.2-1: Figure 6.2-2: Figure 6.2-3: Figure 7.1-1: Figure 8.1-1: Figure 8.1-2: Figure 8.1-3: Figure 8.1-4: Figure 8.1-5: Figure 8.1-6: Figure 8.1-7: Figure 8.1-8: Figure 8.1-9: Figure 8.1-10: Figure 8.1-11: Figure 8.1-12: Figure 8.1-13: Figure 8.1-14: Figure 8.2-1:
FCF and Other M easures ... 97
U se of FCF ... 99
CAPM (Risk & Return) ... 102
Beta ... 102
W ACC & Capital Structure ... 103
EVA and M VA ... 112
Cash flows from Operating Activities ... 116
Interest Bearing Debt Ratio of Japan's Construction Firms in 2002 ... 118
Beta and ROE (1) ... 121
Beta and ROE (2) ... 123
Beta and D/Capital ... 123
Yield Curve in D ecem ber 2002 ... 124
Stock Price, Rating, and Yield Curve of JD C Corporation ... 125
W ACC and ROE ... 127
W ACC and Interest Bearing Debt Ratio ... 128
W ACC and Return on Invested Capital ... 130
Growth Option Payoff Diagram ... 134
Option to Alter Operating Scale Payoff Diagram ... 135
Option to Abandon Payoff Diagram ... 136
Public Construction Investments and Construction Stock Price Index ... 138
LIST OF TABLES Table 2.1-1: Table 2.1-2: Table 2.1-3: Table 2.2-1: Table 4.2-1: Table 4.2-2: Table 5.2-1: Table 5.2-2: Table 5.2-3: Table 5.3-1: Table 5.4-1: Table 5.4-2: Table 8.1-1: Table 8.1-2: Table 8.1-3: Table 8.1-4: Table 8.1-5: Table 8.1-6: Table 8.1-7: Table 8.1-8:
Top 32 Japan's Construction Firms in 2002 ... 18
ENR Top 30 Global Contractors ... 19, 20 Construction Firms and M ain Banks ... 21
Awards for Excellence in Corporate Disclosure ... 27
Schedule of the introduction of IAS ... 62
The Number of Consolidated Subsidiaries ... 63
Cash Flow Assessment ... 73
Cash Flow Profiles ... 74
Cash Flow Profiles of Japan's Construction Firms ... 75
Ratio of Cash Received to Expenditure of Japan's Top 35 Construction Firms ... 83
New Indexes of Business Condition Analysis ... 91
Indexes of Business Condition of Construction Firms in 2002 ... 92
Beta of Japan's Construction Firms ... 120
Beta and ROE ... 122
Beta and D/Capital ... 124
Rating and Interest Bearing Debt Rate ... 126
W ACC and ROE ... 127
W ACC and Interest Bearing Debt Ratio ... 128
W ACC, ROIC and EVA ... 132
CHAPTER 1
INTRODUCTION
1.1 Need for Value Creation
Shrinking demands in Japan's construction market force Japan's construction firms to enter the fierce competition. Japan's economy centering on "harmony," which could hold because of sharp economic growth, came to an end and genuine competition has begun. The construction firms have started to explore how they create the corporate value in this competition. Sales-oriented management deteriorated the firms' capital structure, because it lowered the profit rate and escalated the interest bearing debt ratio. After all, the firms lost their value and some of them went bankrupt one after another.
It became high priority for the firms to create their value in this changing market.
1.2 Value Creation for the Construction Industry
The time when growing sales always brought promised profits has ended. It became necessary for the construction firms to have the strategy to withdraw from unprofitable projects and to invest management resources intensively into profitable projects. It was also necessary to find efficient investment strategies and to monitor how the strategies affect the company value. Applying the finance theory and evaluating the strategies with numerical values helped the firms to find ways to maximize their value. The era in which the construction firms need to keep in mind how they create corporate value has come.
1.3 Purpose of the Thesis
The main purpose of this thesis is to find ways for construction firms to create company value in shrinking Japan's construction market. To accomplish this purpose, the thesis studies the following three points: (1) the profit structure of Japan's construction firms, (2) the effect of introduction of new accounting standards, especially introduction of cash flow statements, and (3) valuation methods. These three points lead the following three factors to value firms: (1)
method can value the management flexibility. This method is becoming critical for corporate valuation. In the end, the valuation methods allow firms to find directions in which they should follow in order to create their value in the changing industry.
1.4 Scope of the Thesis
The valuation methods for Japan's construction firms can be applicable to other industry and firms. However, the thesis limits its scope to Japan's construction market by Japan's
construction firms and shows its applicability to the defined scope through data analyses in Chapter 8.
CHAPTER 2
BACKGROUND
In this chapter, we explore the background of this thesis. In the first section, we examine how Japan's market has changed after bursting Japan's bubble economy. And in the subsequent two sections, we study the effects of the market changes on the construction industry and the current situation of the construction firms. In the last section of this chapter, we review the Construction Industry Revitalization Program released by Ministry of Land, Infrastructure
and Transport and further analyze the current situation of the industry.
2.1 Changing the Driving Force of Japan's Economy 2.1.1 Harmony
When we think of what drives the capitalistic economy, we definitely arrive at the word, "competition." In the intensely competitive society, firms make every effort to (1) increase the market share as far as possible and (2) decrease fixed costs and expenses and raise profit rates. In the end, the firms make maximum returns to their shareholders and extend their business.
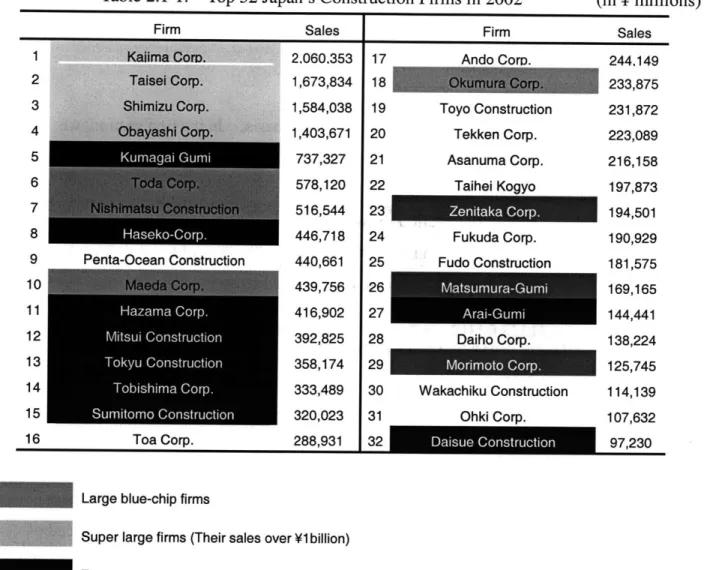
As we look over the sales ranking of Japan's large construction firms from the end of the 1980s to the present time (Figure 2.1-1 and Figure 2.1-2), we find that the sales ranking did not change significantly until the middle of the 1990s. What does this unchanged trend of ranking for nearly ten years tell us? One possibility is that there could be no real sense of competition during this period. Of course, there are no ways to prove it.
As we examine the trend of sales ranking of overseas construction firms in Figure 2.1-2, not only did their ranking considerably change but also many firms no longer exist now.
Then, how can Japan's firms harmonize their share with each other without competition?
Table 2.1-1: Top 32 Japan's Construction Firms in 2002 Firm Sales 1 2 3 4 5 6 7 8 9 10 11 12 13 14 15 16 Toa Corp. Firm Ando CorD. Toyo Construction Tekken Corp. Asanuma Corp. Taihei Konvo 2,060.353 1,673,834 1,584,038 1,403,671 737,327 578,120 516,544 446,718 440,661 439,756 416,902 392,825 358,174 333,489 320,023 288,931 17 18 19 20 21 22 23 24 25 26 27 28 29 30 31 32
Large blue-chip firms
Super large firms (Their sales over V1 billion) Firms receiving financial supports
Firms listed only on the Osaka Stock Exchange
Source: Annual Reports and Financial Statements of FY 2002
Penta-Ocean Construction Sales 244.149 233,875 231,872 223,089 216,158 197,873 194,501 190,929 181,575 169,165 144,441 138,224 125,745 114,139 107,632 97,230 Fukuda Corp. Fudo Construction Wakachiku Construction Ohki Corp. , (in Y millions) Sales
Table 2.1-2: ENR Top 30 Global Contractors (in dollar millions)
1989
1 Shinizu onst. Co. Wt. Japn
2 12,169.4 3 Kfm or pn 11,790.7 4 10,870.0 5 Tals4l Coras 10,667.1 6 Takwnak ,pa 9,971.4 7 9,303.9
8 Obavashl Corp. Japan 8,905.4
9 Bouygues France 8,100.0 10 Kumagal Gumi CO. Ltd Japan 7,797.7
11 MitsubisN Heavy Industrie Ltd 6,280.0
12 6,177.6
13 SGE Group France 5,802.0
14 Philipp Holzmann AG Germany 5,652.6
15 5,430.0
16 5,170.0
17 Fujn Cop apan 4,914.0
18 Davy Corp. plc UK 4,819.1
19 DUMEZ France 4,329.9
20 Hazama-Gumni Ltd. Japan 4,139.1
21 To-da Const. Co. Ltd, Japan 4,136.0
22 SAE France 3,926.0
23 3,875.0
24 George Wimpey plc UK 3,803.5
25 Nishimatsu Const. Co. Ltd., aa 3,716.1
26 3,668.1
27 Balfour Beatty Ltd. UK 3,654.5 28 Spie Batignolles France 3,587.0
29 Mitsui Const. Co. Ltd, Japan 3,513.0 30 Bovis Int'l. Ltd. UK 3,459.4
1995
Philipp Holzmann AG Bouygues SA
Trafalgar House Eng&Con.
Kumagai GumGo. Ltd. GTM-Entrepose,
Hochtief AG
Bilfinger+Berger Bau AG
Konolke Construction Go. Ltd.
STRABAG AG Chiyoda Corp Skanska AB JFan 17,914.0 Fane 17,765.0 16,742.0 16,083.0 15309.0 12,792.0 Germany 11,716.1 France 11,224.0 UK 9,044.0 jawa 8,615.0 France 7,948.0 5apan 7,096.0 jawe 6,922.7 Germany 6,751.0 6,638.0 6,553.0 Gan 6,274.0 6,257.0 japw 6,144.0 Japan 5,954.0 Japan 5,836.0 Jpn 5,646.6 -Japa 5,622.0 Japan 5,312.0 Japan 5,162.3 Germany 4,411.4 jawa 4,250.0 Germany 3,928.2 Japan 3,853.0 Sweden 13,758.0 I
1999 1 2 3 4 5 6 7 8 9 10 11 12 13 14 15 16 17 18 19 20 21 22 23 24 25 26 AMEC PLC Toda Corp. Bilfinger+Berger Bau AG HBG Kandenko Co, Ltd. Chn .tate sr EgCr. Kinden Corp. Hazama Corp.
Hyundai Eng'g & Constr. Co. Ltd. Maeda Corp, Fomento de Construcciones y Grupo Dragados TA"se Corp. -r July 13, 1989 August 28, 1995 August 16, 1999 August 26, 2002 SGE
Kurmagai Gumi Co. Ltd,
Groupe GTM Philipp Holzmann AG Skanska AB Hochtief AG 27 28 29 30 Japah 13,238.0 France 12,517.0 Jawn 11,775.0 11,285.7 Japan 11,190.0 Jgpan 10,117.3 9,771.0 9,640.0 France 9,348.0 Japan 7,676.0 France 7,430.0 Germany 7,205.0 Sweden 6,939.0 Germany 6,914.0 6,835.0 France 5,985.0 Japan 5,829.0 UK 5,350.-0 Japan 5,246.0 Germany 5,121.9 Netherland 4,697.0 6 Japan 4,695.7 -1 4,693.3 Japan 4,652.0 Japa .n 4,471.0 Japan 4,372.0 S Korea 4,169.0 Japan 3,923.3 Spain 3,864.7 Spain 3,647.0 EIFF AGE
Nishimatsu Construction Go. Ltd.
2002
VINCI France 15,378.0
Skanska AB Sweden 14,342.0 Bouygues, Guyancourt, France France 12,830.0 12,171.0
Hochtief, Germany 11,682.0 11,299.0
Talsi Cop. Jpan 11,279.0
Obayashl Corp. Japan 9,972.0
Shirizu Corp. Japan 9,893.7
Takenaka Corp. Japan 8,803.0
7,194.3
6,284.9 5,858.0
Chin Stte onst. Eg Cina 5,815.0
EIFFAGE France 5,642.0
Kumagai Gum-0 Co. Ltd. Japan 5,396.0
AMEC plc UK 5,241.9
China Rilway Construc"4,941.8
Bovis Lend Lease UK 4,785.0
.hn .. a.iwa Egineen Cor China. 4,781.8
FCC SA Spain 4,632.9
Grupo Dragados Spain 4,582.1
Toda Corp. Japan 4,254.0
Hyundai Eng'g & Constr. Co. Ltd. S Korea 4,245.0 Grupo Ferrovial Spain 4,240.0 Balfour Beatty plc UK 4,050.0 3,850.4 Bilfinger Berger AG Germany 3,785.1
Nishimatsu Construction Co. Ltd, Japan 3,745.7
Kandenko Co. Ltd. Japan 3,684.3
Before bursting the bubble economy, Japan's economy consisted of some "Keiretsu's", which were large networks of companies, organized around main banks. There were long standing business relationships between group companies. The bank and other financial institutions at the center owned shares in most of the group companies. These companies in turn held the bank's share or each other's shares. Most debt financing came from the Keiretsu's banks. The construction firm became also one of the members of Keiretsu, and received a considerably large percentage of private orders from other keiretsu's members (Table 2.1-3). Japan's economy formed by the Keiretsu system was based not on "competition" but on "harmony."
Table 2.1-3: Construction Firms and Main Banks (Banks' name before M&A)
Main Bank Firm
I
Main Bank FirmTraditionally, Japan's employment system was also developed by a sense of harmony. When Japan's firms hired employees, the firms guaranteed them lifetime job security and asked them to swear their absolute loyalty to the firms. In addition, promotions and pay were
determined by the length of the service to the company. It was called seniority ranking system. These systems, in which employees cooperate with each other harmoniously, played an
important role only at the time of Japan's high economic growth period in the 1970s and 1980s. Furthermore, in the public works, selective competitive bidding had been mainly adopted for one hundred years for public bidding. Depending on the scale of project, selective competitive bidding system chose qualified firms that were allowed to bid the project. Because of this, large firms were able to receive large projects and also small firms were able to receive small projects. There was no severe competition between different scales of firms and they could be segregated from each other. Moreover, the Dango system, whereby public projects are divided among certain preselected contractors in a "share the wealth" scheme, still sometimes exists. The Dango system could be the product of the contractors' seeking for not competition but harmony.
2.1.2 Competition
Following the collapse of Japan's bubble economy, Japan's growing economy was forced into negative growth (Figure 2.1-1).
At the same time, the information revolution by the Internet happened, economic activities across national boarders and expanding business overseas became common, and, finally it became required to introduce the International Accounting Standards (IAS) to Japan. Under this situation, Japan's original economic system, the harmony-oriented system, reached its limit of existence.
IAS includes (1) the introduction of the statement of cash flows that reflects the real flows of funds, (2) the new consolidated financial statements that show the financial condition of a parent company and its subsidiaries, (3) the fair value accounting that valuates the fair value of securities holdings, (4) the accounting for retirement benefits that place retirement benefits on balance sheets, (5) accounting for impairment of assets that will be adopted in 2005. Japan's conventional accounting rule was able to absorb some changes in the financial conditions to maintain Japan's inflexible systems, such as the lifetime employment system, the seniority ranking system, and the Keiretsu system. However, the new IAS has disclosed all fluctuations of the financial conditions of Japan's firms.
In the construction industry, the construction firms have started to lay off their
employees to reduce their fixed costs and expenses. The introduction of fair value accounting has forced the firms to sell off valueless equity stakes the firms have long held under the
cross-shareholding system. Moreover, the firms are ending the seniority ranking system and putting more emphasis on merit-based promotion systems. To receive new construction orders, the firms cannot help entering new markets beyond the Keiretsu system. New Accounting Standards force the construction industry to enter from the harmony-oriented economic system to the competitive market.
At the same time, in the procurement of public construction projects, Japan's
government aimed to accelerate competitiveness, fairness, and accountability for the construction industry. The government adopted (1) general competitive bidding corresponding to Agreement on Government Procurement of WTO, (2) introduced an electronic bidding system by using the
GDP & Construction Investments In V billions
600,000 - - 22.0%
Construction Investments
-+- The Ratio of Construction Investments
500,000 -\ - 20.0% d' o\o 400,000 A 1 - 18.0% 200,000 \14.0% 200,000o 6\ 140 o k' 100,000 12.0% 0 10.0%
00
O O 00 00 O O 00 00 O CO W CO ( W CO CO CO CO CO CO --. 0 M - 0.n CO 0 - N) W -P .n M -4 00 CO 0Figure 2.1-1: Trend of Construction Investments
2.2 The Interests of Shareholders
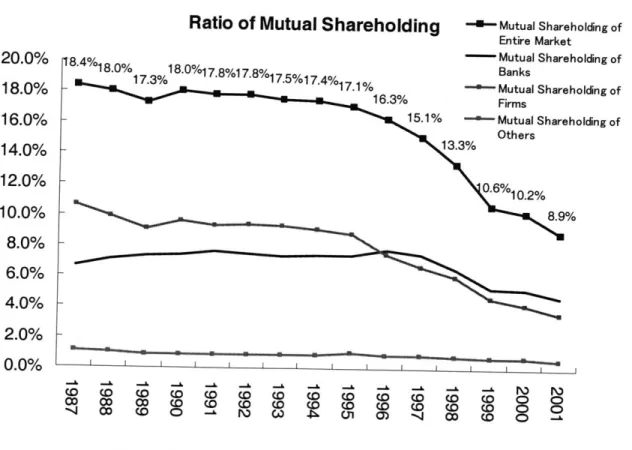
Cross shareholding in the Keiretsu system had never traded. The firms in the Keiretsu kept cross shareholding, and they, as investors, had never expected returns and never sold them off. The system protected the firms from mergers and acquisitions, even though their stock price fell. The firms thought their shareholders, called "silent stockholders" did not expect returns so that the cost of stock was zero. Moreover, conventional accounting rules did not ask to use the fair value method for securities holding, but used the book value method. At the high economic growth period, only when the firms faced financial difficulties, inflated value of the cross holding was sold. This capital gain was used for covering the losses or shortage of funds. Furthermore, rigid cross holding reduced the real number of exchangeable stocks in the market, thus this could maintain the high stock price.
Ratio of Mutual Shareholding -Mutual Shareholding of Entire Market 20- Mutual Shareholding of 20.0% 11.4% .% 7.8%17.8%j7.5%17.4% Banks 13% 17.1% - Mutual Shareholding of 18.0% -16.3% Firms 16.0% 15.1% - Mutual Shareholding of 13.3% 14.0% -12.0% -0.6%10.2% 10.0% - 8.* 8.0% -6.0% -4.0% 2.0% -0.0% ' ' ' ' D r 2- W C W Co M a C a(CD Wn CD CD 0 a WO 4 W CO CW (0 0 W C -~ (D(W N\ W~ (0 . to M7 (0 M -4 W 0W t (0 D W 0 0 0
However, Japan's economy has deteriorated. And new accounting rule was introduced. Then, the Keiretsu system collapsed. Finally, the ratio of cross holding has started to decline and stocks have moved freely around the market since the late 1990s (Figure 2.2-1). All at once, the main bank at the Keiretsu's center lost its financial power and could not play a fund-raising role for other Keretsu's firms. Under this circumstance, corporate managers cannot help attaching more importance to their firm's stock price than ever before, because they need to collect funds from the stock markets and keep the stock price high.
Under the new accounting rule, the corporate managers are striving to disclose their firm's financial conditions and improve the investor relations (Table 2.2-1). Now, they are exploring how they can increase the value of the firm. Every firm has started to disclose its financial and operating information to the public.
Equity Ratio 30 -25 J 20-15 -p Industry-wide 10-Construction Industry 5-0 PO O CO -Pi - N LO 40k -0 -0-0 00 0 00 0 00 00 00 0 1999 2000 2001 2002
Table 2.2-1: Awards for Excellence in Corporate Disclosure Firm 2002 2001 2000 1999 Penta-Ocean Const. 1st 2 4 4 Taisei Corp. 2 3 7 7 Maeda Corp. 3 1st 3 6 Kajima Corp. 4 5 2 3 Obayashi Corp. 5 4 1st 1st Shimizu Corp. 6 8 5 8 Nishimatsu Const. 7 7 6 2 Toda Corp. 8 6 8 5
2.3 The Struggle for Survival
Shrinking Japan's construction market also forces the construction firms to competition. Fierce competition for receiving orders lowers the profitability of projects. Unprofitable
projects increase debt ratio of the firm even more and, finally, raises the number of corporate bankruptcies (Figure 2.3-1). As their stored cash is reducing year by year, the construction firm that only focused on the amount of sales started to pay attention to the profit rates and real cash flows. This is the major change from the high growth period when the firms kept away from real competition and could get high profits. After that, because of the introduction of the new accounting rules, the firms are required to prepare the statement of cash flows to add to
conventional income statements and balance sheets. Although, for nearly ten years the construction firms had kept the same market share, their share is slightly changing. Figure 2.3-2 shows that the share of two groups of the top twenty-three Japan's contractors in sales. One is the top four firms and four semi-large blue chip firms. The other is six semi-large firms that are receiving financial supports and nine middle-sized firms. The former has increased its market share by nine percent since 1997. The latter has decreased by six percent.
Trend of Bankruptcy in Construction Industry
In yen billions 3000 - 7000 2500 aggregate amount of - 6000 indebtedness 2000 --- Number of Bankruptcy - 5000 - 4000 1500 - 000 1000 - 000 500 - 1000 0 0 90 91 92 93 94 95 96 97 98 99 00 01 02
Trend of Market Share in Construction Industry 24% -23% 23% 0 3% 22% 2% 22% -% 22 21% 63% 61% 2 1% 58% -7% 7% 19%
55% -- Firms receiving financial
supports
--- Super large and large
24% 23% 22% 21% 20% 19% 18% 17% 16%
Firms receiving financial supports: Super large firms : Kajima, Taisei, Large blue-chip firms : Nishimatsu,
W .% 01 0) -1
Kumagai, Tobishima, Mitsui,
Shimizu, Obayashi
Maeda, Okumura, Toda
cc Co co Co 00 co Sumitomo, INa !3 % oD 0D o oD 0 o -Hazama, Tokyu
Figure 2.3-2: Trend of Market Share in Construction Industry
Source: Morgan Stanley Research
blue-chip firms ' ' ' ' ' ' ' ' ' 68% 64% 62% 60% 58% 56% 54% 50% ' 'I
2.4 The Construction Industry Revitalization Program
In July 1999, the Ministry of Construction (the current Ministry of Land, Infrastructure and Transport (MLIT)) made up the Construction Industry Revitalization Program as a new strategic approach for the construction industry. In the current stagnation of Japan's economy, the construction industry is being required to find urgent restructuring to revive itself again. The revitalization program mentioned, "Through fair competition among firms, the construction industry will revitalize its creativity and strength to meet the needs of economic society of the 2 1st century."(Translation mine) Moreover, the program suggests four main directions of the corporate strategy that could critically influence the management of construction firms:
a) Concentrate the management resources on core business
Analyzing the profit structure and concentrating the management resources on core business. This strategy suggests the promotion of restructuring the profit structure by reducing debts and cutting personnel costs that have increased during the bubble economy.
b) Strategic investment in growth areas
Investing the management resources in growing areas in which firms could have future competitive advantages.
c) Clarification of the cost structure
Strengthen the cost competitive power. It is necessary to examine the cost structure of construction firms and reduce the costs. Disclosing the cost structure is essential.
d) Strengthen the competitive power
Strengthen and differentiate the competitive power with quality, software, and engineering.
Then, in December 2002, the Ministry of Land, Infrastructure and Transport released the basic policy for the construction industry revitalization. The first part of the policy says that the construction market keeps shrinking, and the construction firms lost their balance between the
earning power and the debt ratio. The policy also refers to two basic directions for the
revitalization: (1) the curtailment of unprofitable departments and shifting management resources to profitable departments, and (2) the improvement of profitability by changing from
sales-oriented to profit-oriented management (Translation mine).
In order to implement those management reforms, it is essential for the construction firms to analyze their profit structures and clarify the current management conditions. And then, by using cash flows, the firm analyzes and evaluates its departments. Moreover, the changes in the accounting standards, such as new consolidated financial statements rule, fair value
accounting, and the statement of cash flows also help clarify the advantage and profitability of the construction firms.
CHAPTER 3
SALES, COSTS, AND PROFITS
In this chapter, we elucidate the characteristics of the construction industry and examine its financial and profit structures. Ratio analyses are useful for capturing these structures. This chapter introduces some of useful ratio analyses. These ratio analyses are based on
finance and accounting books (Palepu, Bernard and Healy, 1999, Pratt, 2003, Myers and Brealey, 1999, Adrian, 1999). This chapter also explains two types of revenue recognition methods, the percentage of completion method and the completed contract method. Depending on these methods, accounted revenues are varied. This is the one of the reasons why the statement of cash flows that discloses the firm's real financial condition is becoming important now. In the end, we analyze profit creation ways by using financial and profit structures.
3.1 Characteristics of the Construction Industry
Each firm has its profit structure that has been developed for a long period. We can read the structure's characteristics from the trend of the numbers in the financial statements. The process of making profits and the level of the profits are unique because the profit structure is made up of the firm's system and model. Whether the profitability of the firm is high or low
depends on the nature and features of the firm's profit structure. The precise understanding of the profit structure will lead to some clear solutions to improve the profitability.
The construction firms have several different characteristics from those of other firm in the manufacturing industry. The unique characteristics of the construction firms are the
following:
a) The construction industry is the general assembling production industry.
b) Each project a construction firm employs is somewhat unique as to its design and required construction methods.
c) Often the construction project takes more than one year to complete.
3.2 Financial Structure Analysis 3.2.1 Financial Structure
Unique external factors tend to shape the total financial structure of the construction firm. These characteristics of the financial structure can be gathered from the financial statements:
a) The percentage of the fix assets is relatively small:
Because the construction projects are implemented out of doors by single production, the construction firm does not need to own the large amount of fixed assets. Compared to the manufacturing firm, the construction firm has a relatively small percent of fixed assets.
b) The expenditure for uncompleted projects is huge:
The expenditure of construction costs is, at first, treated as the expenditure for uncompleted projects. The expenditure shown on the balance sheets is the results of subtracting the cost of completed construction at the end of the fiscal year from the total expenditure of construction in the fiscal year.
The expenditure deals with the current assets and it corresponds to the inventory in the balance sheet. In the manufacturing industry, the large amount of work-in-process is considered bad inventory and likely to be reduced. In the construction industry, however, each project has its owner and fixed contract price so that the inventory is the promised sales for the next fiscal years.
c) The advanced received for uncompleted projects is huge:
Under a contract for a construction project, the owner often makes payments to a contractor as a deposit paid on the construction project along with its progress. The received payments are, at first, recorded as the advanced received for uncompleted projects and after the project is completed, the payments transfer to the construction of completion.
In Japan, public projects pay forty percent of the total contract price as an advance payment before starting the projects. The payments are also the advanced received.
liabilities, the firm has a roughly corresponding expenditure for executed work to subcontractors.
d) The percentage of equity capital is relatively small:
Because the construction industry does not need to own the large amount of fixed assets, its equity capital is usually small. The industry's equity ratio is smaller than that of the manufacturing industry.
e) The percentage of subcontract costs among the cost of completion is high: The construction industry is the general assembling production industry. The materials that are the main components of the buildings are processed by the subcontractors. The labors and machines that assembled the materials in the construction sites are also subcontractors.
f) The percentage of marketing costs and the administrative costs is small: The construction industry adopts the job order cost system so that the personnel expenditures in the sites and the overhead expenditures for construction are included in the cost of construction.
g) The component percentage of the depreciation expenses is small:
The ratio of the fixed assets is small so that the depreciation expenses are also small.
Balance Sheets Current Assets Fixed Assets Current Liabilities Long-term Investment
J
Equity Cost of Sales Administrative Revenue Income Figure 3.2-1: Financial Structure of Obayashi Corporation in FY2002Source: Obayashi Corporation Annual Reports FY 2002
3.2.2 Ratio Analysis for Financial Structure
Ratio analysis is among the most popular and widely used tools of financial analysis. Numerous financial ratios' can be developed by dividing one of the many different items in a firm's income or balance statement by another item. The firm can then compare the values of its ratios to the average values of the ratios for its industry and perhaps decide to make an adjustment in its financial structure.
Each industry and firm is somewhat unique as to its product, its objectives, and its financial structure. It follows that each firm is somewhat unique as to the values of its ratios. Basing a firm's policies on a specific growth objective may result in variation between its ratios
and those accepted as average for the industry, although the firm may have a very sound financial structure.
A difficulty somewhat unique to the construction industry's use of financial ratios has to do with alternative accounting methods used by construction firms. Using alternative
accounting methods, such as the completed-contract method versus the percentage-of-completion method, results in different values for certain ratios:
a) Liquidity (Short-term Analysis)
An important liquidity ratio is the current ratio reflecting current assets available to satisfy current liabilities. The current ratio of a firm is derived as follows.
Current Ratio = Current Assets Current Liabilities
Current Ratio =Current Assets -Expenditure for Uncompleted Projects
Current Liabilities -Cash Recieved for Uncompleted Projects
Whereas the current ratio includes inventories in determining assets, they are excluded in determining quick assets. Theoretically, the quick ratio is an even more severe test of a firm's solvency. The quick ratio is derived as follows:
Current Ratio = Quickt Assets (Cash + Cash equivalents+ Marketable securities + AR) Current Liabilities
Current Ratio -Quick Assets - Expenditure for Uncompleted Projects
Current Liabilities -Cash Recieved for Uncompleted Projects
While the quick ratio might be considered as a more critical analysis of a firm's ability to generate cash over a short period of time, as to the construction firm, the difference between the current ratio and quick ratio losses some of its significance, because the construction firm is not heavily invested in inventories. In other words, each inventory item (construction project) has its owner already.
b) Capital Structure and Solvency (Long-term Analysis)
When a firm borrows money, it promises to make a series of fixed payments.
Because the shareholders get only what is left over after the debt holders have been paid, debt is said to create financial leverage.
Financial leverage is usually measured by the ratio of long-term debt to total long-term capital. Since long-term lease agreements also commit the firm to a series of fixed payments, it makes senses to include the value of lease obligations with the long-term debt.
Debt Ratio = (Long - term debt + Value of leases)
(Long - term debt + Value of leases + Equity)
Another way to describe the same relationship is:
Debt to equity ratio = (Long - term debt + Value of leases)
Equity
Another measure of financial leverage is the extent to which interest is covered by earnings before interest and taxes (EBIT) plus depreciation.
Times interest earned - (EBIT + depereciation)
Interest
The regular interest payment is a hurdle that companies must keep jumping if they are to avoid default. The times-interest-earned ratio measures how much room there is between hurdle and hurdler.
3.2.3 Off-Balance-Sheet
Financing that does not add debt on a balance sheet and thus does not affect borrowing capacity as it would be determined by financial ratios is called off-balance financing. The most common example would be a lease structured as an operating lease rather than a capital lease and where management's intent is to acquire an asset and corresponding liability without reflecting either on its balance sheet. In efficient capital markets investors will see through the firm's
3.3 Process of Construction and Revenue Recognition
3.3.1 Percentage of Completion Method and Completed Contract Method
Current accounting principles for business enterprise allow use of the both the
percentage of completion method on an accrual basis and the completed contract method on a realization basis. The major accounting difference between the two methods is the point in time at which the revenue or expense is recognized.
The percentage of completion method is generally the preferable method for recording income on long duration projects. Its major advantage is that it recognizes income on a current basis and, as such, results in a more regular flow income. On the other hand, the method has the disadvantages of dependence on cost estimates, which are subjects to uncertainties, and spending time and money to estimate costs.
When the completed contract method of recognizing revenue and expense is used, the construction firm recognizes no revenue or expense (or resulting profit or loss) until the
completion of the construction project. During construction all costs incurred by the construction firm for building a project are accumulated in the expenditure for uncompleted projects (a construction in progress account), which is an asset account.
The gross profits of construction are varied by the revenue recognition method that the companies choose.
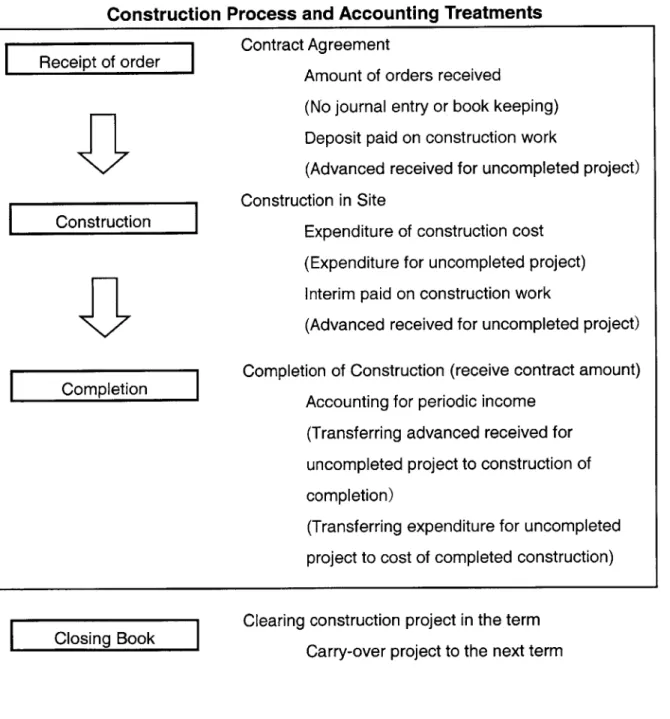
3.3.2 Process of Construction and Accounting Treatments
Some construction projects take more than one year to complete, and the process can be divided into three phases. The accounting treatments of each phase are shown in Figure 3.3-1.
Construction Process and Accounting Treatments
Receipt of order
Construction
Completio
I
Closing BookContract Agreement
Amount of orders received
(No journal entry or book keeping) Deposit paid on construction work
(Advanced received for uncompleted project)
Construction in Site
Expenditure of construction cost (Expenditure for uncompleted project) Interim paid on construction work
(Advanced received for uncompleted project) Completion of Construction (receive contract amount)
Accounting for periodic income (Transferring advanced received for uncompleted project to construction of completion)
(Transferring expenditure for uncompleted project to cost of completed construction)
Clearing construction project in the term Carry-over project to the next term
Figure 3.3-1: Construction Process and Accounting Treatments I
3.4 Profit Structure Analysis 3.4.1 Profit Structure
The profit structure of the construction industry can be represented by the following equation.
Construction Gross Profit (Gross Margin) = Construction of Completion (Contract Cost)
- Completed Construction Prime Cost (Cost of Completed Construction)
The margin is the main source of the construction firm's earnings and its size can determine whether the profit structure is good or bad.
Because the construction project needs long time for completion and the cost per project is huge, the specific order system is used for accounting. During the construction schedule, the construction project enters basically three phases, the receipt of orders, the execution of works, and completion of the project. The uncompleted projects that are brought over to the next fiscal period or from the previous period are called carry-over projects. The following items are titles of account for the construction industry:
a) Amount of orders received in this term:
This is also called as the amount of contracts in this term. The construction of completion, the costs of construction, and the gross profits, all come from the orders received. The amount has significant impact on the construction business.
b) Total amount of receipt of order:
Generally, this is also called as total amount of receipt order the firm keeps during this term. The amount represents that the carry-over projects from the previous term plus the amount of orders received in this term, or the sum of the construction
completion and carry-over projects to the next term.
c) Construction of Completion:
This is the total contract prices of completed projects in the term and used as sales in the completed contract method.
d) Carry-Over Project:
This is the contract price of uncompleted projects to the next term.
e) Total Amount of Executed Work:
The amount of executed works of the all projects at the end of the term, no matter if a whole project is completed or not. This is used as sales in the percentage of
completion method
f) Carry-Over Gross Profit:
The profits are included in the carry-over executed projects to the next term.
g) Cost of Completed Project:
This is the sum of the cost of completed projects. In the completed contract method, the cost of completed projects is used as the cost. In the percentage of completion method, the sum of the cost of completed construction and the expenditure for uncompleted work is used.
The Process of Construction and Revenue Recognition
Cost of completed projects Expenditure for
uncompleted
projects
completed projects
Gross profii of Gssprofit of carry-over 'rojects to the next term
G I'ls I I I I I
I
I I I ITotal Amount of Executed Works
bac ti
Total Amount of Receipt of Orders
...
...
a, tr ''-.b, V i r id't' 't i i 6' x' t 't e' tr' p pjp. . ... ...' - ... ...... ...-...* ... ... ... ...... ......4 ...I ... ., ......... ......t ...... ...4 ... ...... ... . . . .. . . .. . . . .. . . . .qrry qver p qjqcf .I rom:th
...
e9 Wev
_10US...
...*
...
...
...
...
...
...
...
...
...
...
...
...
...
...
...
...
...
...
...
Figure 3.4-1: The Process of Construction and Revenue Recognition
Reference: Hiroshi, Sugiura, ed., 2001
>M
I
3.4.2 Ratio Analysis for Profit Structure a) Trends in Orders Received
Figure 3.4-1 tells that the increase in the total amount of orders received year by year makes the size of the profit structure larger. This is the favorable situation unless the projects are unprofitable.
Growth Rate of Order Receivedt = (Order Received, -Order Received. 1)
Order Received. 1
The trend percentage method is a simple way to represent continuous trends in numbers over several periods. The method uses a number in a certain year as the benchmark and finds change ratio to numbers in other years. The equation is as follows.
Number ya
Percentage Changet year =Number year Numberbenchmark year
b) Total Amount of Receipt of Order and Total Amount of Construction
Although it is important to catch the trends of the current term's orders received and construction of completion year-on year, the factor with the most influence on the profit structure is the company's total amount of receipt of orders and executed works in the end of the term. The total amount of receipt of orders is related with the amount of orders received in the term and the carry-over projects from the previous term. The following equations represent the relation.
Total Amount of Receipt of Orderst = CarryOver Projectst-1 + Orders Receivedt
= Constructon of Completion + CarryOver Proectst+1
CarryOver Projectst±1
= CarryOver Executed Works in Uncompleted Projectst+1 + CarryOver Backlogged Workst+1
The total amount of receipt of order is considered the most important number because it could show the scale or capacity of the construction firm. Moreover, when the profit was promised from any projects, the increase in the amount of orders means the increase in profits. The increase ratio and trend of the number can considerably influence the profit structure.
The ratio of the total amount of the executed works to the total amount of receipt of orders is called the execution rate and is represented by the following formula.
Execution Rate = Total amount of executed works Total amount of receipt of orders
Usually, the ratio does not fluctuate significantly unless the size and type of the received orders change significantly. If the ratio moves drastically during a certain period, there should be some particular reasons in the firm.
c) Total Amount of Executed Works and Construction of Completion The construction of completion is the sum of the contract prices of completed projects. When the project is completed and delivered to the owner, the contract price of the construction is entered the construction of completion. The ratio of the
construction of completion to the total amount of executed works is called the completion rate and is obtained by the following formula.
Completion rate = Construction of completion
d) Gross Profit
The total gross profit is the total profit of the firm at the end of the term. In the completed contract method, the gross profit is the construction of completion minus the total cost of completed projects. In the percentage completion method, the gross profit is the total amount of executed works minus the total cost of executed works.
Gross profit (Completed contract method)
= Construction of Completion - Total cost of completed projects
= Gross profit of completed projects
Total Gross profit (Percentage completion method)
= Total amount of executed works -Total cost of executed works
3.5 Break-even Analysis
The cost-accounting concepts of the break-even analysis provide another way to
understand profits. This analysis mainly uses revenues, variable expenses, and fixed expenses. The basic equation for the break-even analysis is as follows:
Profit = Revenue - Variable expenses - Fixed expenses
Using the equation, it is possible to calculate a break-even amount of sales for a construction firm, usually referred to as the firm's break-even point. The break-even point is the amount of sales at which the firm's revenue exactly equals its total costs. At this point the construction firm neither makes profits nor losses. See Figure 3.5-1.
Variable costs are costs that vary directly with changes in activity. Examples of
variable costs are costs of material and labor used in the production process and equipment hours expended in the manufacturing process. Fixed costs are those that vary with the passage of time despite changes in the level of activity. It should be noted that a fixed cost may vary if the level of activity changes substantially. Thus, when speaking about a fixed cost, we have to recognize the existence of the relevant range of business activity. The relevant range is that level of activity for which the firm budgets and expects to operate. As such, the definition of fixed cost is valid only for the firm's relevant range of activity. To understand the problem of
Sales, cost, profit & loss Sale [in
Jptal cost line
rof it Break-Even Variable cost Loss Fixed cost Sales
fixed costs not being fixed over unexpected activity levels, the term semifixed is introduced. Break-even analysis is a useful method for the construction firm to determine what level of sales is needed to cover its planned overhead expenses. In order to perform this analysis, we usually assume that a construction firm's costs of sales are variable expenses, and its general and administrative costs are fixed costs. While there are exceptions to these assumptions, most construction costs are variable, and most operating costs may be considered fixed within a given range of volume.
Establishing a required volume needed to cover overhead effectively sets a minimum goal for the firm. Setting a goal often motivates the firm to achieve it and also serves as the basis for justifying certain marketing plans and expenditures. Periodically the break-even point should be recalculated to recognize charges in overhead expenditures and modifications in the gross margin.
The concept of marginal profits is also useful in profit analysis. Marginal profit is defines as follows:
Marginal profit = Revenue - Variable expenses
Sales, cost, profit & loss , Sales linl
ales Marginal Profit In
(Marginal pro w this line)
Br k- ven
A specific construction project yields the construction firm a positive marginal profit as long as the dollar contract amount is greater than the cost of construction (in this case, the cost of construction is defined as mainly a variable cost). As long as a project has positive marginal profit, it contributes to covering some of the firm's overhead.
Having introduced the concept of marginal profits, we can understand the common practice of some construction firms occasionally signing a contract to build a project for less than total costs. The above figure (Figure 3.5-2) shows this case. By total costs is meant the costs
of construction and an allocated percentage of the firm's overhead costs.
A construction firm's success is measured by its profitability. The objective or accomplishments of construction firm might include improving its public image and serving a community and employees. However, these seemingly non-monetary objectives are usually tied to making money.
Figure 3.5-3 illustrates how the construction firms used their costs and took net losses in
2002.
*Total amount of major 25 firms in 2002
Variable Costs
Sales Total Costs
R&D F ed Costs
Net Loss Operating Income
*In this year, most of firms declared net losses
Figure 3.5-3: Income Structure of Japan's Major Construction Firms in 2002
Increased Volume Approach
Sales, cost, profit & loss Sales lir.
P fit maximization
Total cost lin
.. irefis'ed Gross Margin Approach
- ' Variable cost
Loss -ixed cost
Control of Overhead Approach Sales
Figure 3.5-4: Profit Maximization
Given the construction firm's objective of increasing net profits, there are essentially three different approaches taken to improve the profits. Figure 3.5-4 illustrates the three
approaches:
a) Increased volume approach
Most construction firms take the increased volume approach as their means to increase their profits. The firm assumes that receiving more orders, it can generate more profits. It should be noticed that their gross margin is reduced by competition and semifixed costs increase along with increases in the volume of construction.
b) Increased gross margin approach
The increased gross margin approach to increasing profits can return significant net income. As noted earlier, the gross margin is controlled by competition. In reality, gross margins for construction firms vary significantly.
Gross margin = Gross profit
Revenue
One means of increasing gross margin is for the construction firm to decrease its cost of doing a given volume of work. Instead of merely seeking greater volume, the construction firm should look for volume that includes significant gross margin. But the competitive nature of the normal lump sum construction contract weakens the construction firm's ability to secure contracts with an improved profit margin.
c) Control of overhead approach
Many of the construction firm's overhead costs tend to be fixed costs. Examples include cost of maintaining the company office, cost of the clerical staff, and marketing expense. The controlling overhead costs approach to increase total profits requires keeping the firm's overhead costs less than the gross profits. The smaller the overhead costs are relative to the firm's gross profits, the larger the total profits.