HAL Id: hal-03203907
https://hal.archives-ouvertes.fr/hal-03203907
Submitted on 21 Apr 2021
HAL is a multi-disciplinary open access
archive for the deposit and dissemination of
sci-entific research documents, whether they are
pub-lished or not. The documents may come from
teaching and research institutions in France or
abroad, or from public or private research centers.
L’archive ouverte pluridisciplinaire HAL, est
destinée au dépôt et à la diffusion de documents
scientifiques de niveau recherche, publiés ou non,
émanant des établissements d’enseignement et de
recherche français ou étrangers, des laboratoires
publics ou privés.
Gout and pseudo-gout-related crystals promote
GLUT1-mediated glycolysis that governs NLRP3 and
interleukin-1β activation on macrophages
Felix Renaudin, Lucie Orliaguet, Florence Castelli, François Fenaille, Aurelie
Prignon, Fawaz Alzaid, Christèle Combes, Aurélie Delvaux, Yasmina Adimy,
Martine Cohen-Solal, et al.
To cite this version:
Felix Renaudin, Lucie Orliaguet, Florence Castelli, François Fenaille, Aurelie Prignon, et al.. Gout
and pseudo-gout-related crystals promote GLUT1-mediated glycolysis that governs NLRP3 and
interleukin-1β activation on macrophages. Annals of the Rheumatic Diseases, BMJ Publishing Group,
2020, 79 (11), pp.1506-1514. �10.1136/annrheumdis-2020-217342�. �hal-03203907�
OATAO is an open access repository that collects the work of Toulouse
researchers and makes it freely available over the web where possible
Any correspondence concerning this service should be sent
to the repository administrator:
tech-oatao@listes-diff.inp-toulouse.fr
This is an author’s version published in:
http://oatao.univ-toulouse.fr/27609
To cite this version:
Renaudin, Felix and Orliaguet, Lucie and Castelli, Florence [et al.]. Gout and
pseudo-gout-related crystals promote GLUT1-mediated glycolysis that governs
NLRP3 and interleukin-1β activation on macrophages. (2020) Annals of the
Rheumatic Diseases, 79 (11). 1506-1514. ISSN 0003-4967
an nrheumd
(http://dx.doi.org/10.1136/
is-2020-217342).
Correspondence to
Pr
Rheumatology, Hang-Korng Ea , Lariboisiere
To cite: Renaudin F, Orliaguet L, Castelli F, et al.
Ann Rheum Dis Epub ahead of pri nt: fplease include Day Month Year). doi:10.1136/ an nrheumdis-2020-217342
Aurelie Prignon, Fawaz Alzaid,
•Gout and pseudo-gout-related crystals promote
GLUT1-mediated glycolysis that governs NLRP3 and
interleukin-1 � activation on macrophages
Felix Renaudin,
1• 52
Lucie Orliaguet
1 3
•
,
�-3
Florence CaJtelli,� :rançois Fe�aille,
4Chnstele Combes, Aurelle Del�a
2ux,
Yasmina Adimy
' 4Martine Cohen-Solal
•
,
u
Pascal Richette
O
, ·
1 3
I
f 1 3 ,d , ·
L' ,
1 2Thomas Bardin
e,
1·2Jean-Pierre Riveline, · Nicolas Ventec e , · Fre enc 1ote, ·
Laure Campillo-Gimenez,
1•2Hang-Korng Ea
1•2ABSTRACT
Objective
Macrophage activation by monosodium
urate (MSU) and calcium pyrophosphate (CPP)
crystals mediates an interleukin (IL)-1 �-de pendent
inflammation during gout and pseudo-gout tiare,
respectively. Since metabolic reprogramming of
macrophages goes along with inflammatory responses
dependently on stimuli and tissue environment, we
aimed to decipher the role of glycolysis and oxidative
phosphorylation in the IL-l !3-induced microcrystal
response.
Methods
Briefly, an in vitro study (metabolomics
and real-time extracellular flux analysis) on MSU and
CPP crystal-stimulated macrophages was performed to
demonstrate the metabolic phenotype of macrophages.
Then, the role of aerobic glycolysis in IL -113 production
was evaluated, as well in vitro as in vivo using
18F
fluorodeoxyglucose positron emission tomography
imaging and glucose uptake assay, and molecular
approach of glucose transporter 1 (GLUT1) inhibition.
Results
We observed that MSU and CPP crystals
led to a metabolic rewiring toward the aerobic
glycolysis pathway explained by an increase in GLUT1
plasma membrane expression and glucose uptake on
macrophages. Also, neutrophils isolated from human
synovial fluid during gout tiare expressed GLUT1
at their plasma membrane more frequently than
neutrophils isolated from bloodstream. Both glucose
deprivation and treatment with either 2-deoxyglucose
or GLUTl inhibitor suppressed crystal-induced NLRP3
activation and IL-113 production, and microcrystal
inflammation in vivo.
Conclusion ln conclusion, we demonstrated that
GLUT1-mediated glucose uptake is instrumental during
the inflammatory IL -1 � response induced by MSU and
CPP crystals. These findings open new therapeutic
paths to modulate crystal-related inflammation.
INTRODUCTION
Monosodium urate (MSU) and monoclinic calcium pyrophosphate dihydrate (m-CPPD) crystals are responsible for gout and m-CPPD deposition diseases, respectively. Both crystals activate the innate immune system and induce recurrent and painful flares, which are interleukin (IL)-1 �- driven
Key messages
What is already known about this subject?
►
A switch of cell metabolism from oxidative
phosphorylation to aerobic glycolysis in order
to support energy demand is a hallmark of
inflammatory phenotype of macrophages
and multiple immune-mediated inflammatory
diseases such as cancer or autoimmune
diseases.
►
Gout and pseudo-gout tiare depend on
monosodium urate (MSU) and calcium
pyrophosphate crystal-induced interleukin
(IL)-1 � production, respectively, by macrophages.
What does this study add?
►
MSU and monoclinic calàum pyrophosphate
dihydrate (m-CPPD) crystal stimulation leads to
a metabolic reprogramming of macrophages in
faveur of aerobic glycolysis.
►
MSU and m-CPPD crystal-induced NLRP3
inflammasome activation and IL-113 production
by macrophages, as well as microcrystal
mediated inflammation in vivo, rely on a
de novo glucose uptake through glucose
transporter 1.
How might this impact on clinical practice or
future developments?
►
This study demonstrated the key role of
inflammatory cell metabolism and glucose
availability in the inflammatory process
of microcrystal-related pathology. lt thus
highlights a potential new therapeutic path for
acute and chronic patients' arthritis care.
inflammations caused by macrophage-mediated neutrophil infiltt·ation and activation in joints.1 2 IL-1� production is a two- step process which can both be activated by MSU and m-CPPD crys tals. The first step involves nuclear factor-KB and mitogen-activated protein kinase pathways,3 leading to pro-IL-1� synthesis, and the second one relies on the nucleotide-binding oligomerisation domain (NOD)-like receptor family, pyrin (NLRP) domain-containing 3 inflammasome complex and
Renaudin F, et al. Ann Rheum Dis 2020;0:1–9. doi:10.1136/annrheumdis-2020-217342
gives rise to the secretion of active IL-1β.1 Activated NLRP3
stimulates speck formation of the adaptor protein apoptosis- associated speck- like containing a CARD (ASC) and recruits pro- caspase-1 into the NLRP3/ASC complex through homo-typic domain–domain interactions.4 5 Assembly of pro- caspase-1
within the NLRP3 inflammasome allows its autoproteolysis and the release of active caspase-1, which cleaves its substrates pro- IL-1β and pro- IL-18 into their mature forms.4 NLRP3- deficient
macrophages are unable to produce mature IL-1β under MSU and m- CPPD crystal stimulation.1 3 Blocking IL-1β abrogates
MSU- induced and m- CPPD- induced inflammation and consti-tutes an efficient therapeutic option in gout flare.6 7 However,
long- term inhibition of IL-1β may increase infection risk. Thus, understanding mechanisms of NLRP3 activation by MSU and m- CPPD crystals might offer a safer way to modulate IL-1β effects.
NLRP3 can be activated through several mechanisms, including reprogramming of cell metabolism.8–11 First described
in cancer cells, the so- called Warburg effect characterised by an increase in glucose uptake and aerobic glycolysis, along with a reduction of the mitochondrial respiration (oxidative phosphorylation (OXPHOS)), and an inhibition of tricarbox-ylic acid (TCA) cycle plays a critical role in host defence and inflammation and is a metabolic hallmark of activated immune
cells and proinflammatory macrophages.8–10 Thus, high
concen-trations of glucose increase IL-1β production through the NLRP3- dependent pathway, while inhibition of glycolysis with 2- deoxyglucose (2- DG) suppresses IL-1β production by macro-phages stimulated with the TLR-4 agonist lipopolysaccha-ride (LPS) or ATP.12 13 LPS- induced glycolysis stimulates IL-1β
production through hexokinase (HK) 1, hypoxia- inducible factor 1α (HIF-1α) and pyruvate kinase muscle (PKM) 2 activa-tion, three molecules of the glycolysis pathway directly involved in NLRP3 activation and IL-1β production.14–16 In parallel,
TLR4 activation induces TCA cycle alteration stimulating IL-1β production through cytosolic accumulation of succinate, which prevents degradation of HIF-1α by prolylhydroxylase enzyme.12
Stabilised HIF-1α then enhances the expression of genes encoding IL-1β and proteins involved in glycolysis pathways, such as glucose transporter 1 (GLUT1) and HK, which further amplify glucose uptake and glycolysis.12 15 17 Interestingly,
glucose uptake quantified with 18F- fluorodeoxyglucose ([18
F]-FDG) positron emission tomography (PET) is increased in joints with gout flare and in soft- tissue surrounding MSU or m- CPPD crystal deposition, suggesting that glucose consumption plays an important role in crystal- induced inflammation.18 19 Moreover,
the ketone body β-hydroxybutyrate produced during starvation or low- carbohydrate ketogenic diet inhibits IL-1β production
Figure 1 Crystal- induced inflammation depends on glucose availability. Primed THP-1 cells were stimulated with either PBS or MSU or m- CPPD crystals. (A,B) IL-1β production was quantified by ELISA in supernatants of cell culture in the (A) absence or presence of glucose (n=9). Multiple t- test with false discovery rate (FDR) correction between +glucose and –glucose (*): #p<0.05, ##p<0.01, ###p<0.001. (B) In the absence (PBS) or presence of
2- DG (20 mM, n=4). Data are presented in % of inhibition of IL-1β production compared with PBS (100%). Kruskal- Wallis test with FDR correction (*): *p<0.05, **p<0.01, ***p<0.001. (C,D) ASC speck formation was observed with confocal microscopy and quantified in cells cultured with medium containing or not containing glucose. (C) Imaging representative of three independent experiments and (D) quantification of cells expressing at least one speck complex (n=3). Multiple t- test with FDR correction between +glucose and –glucose (#): #p<0.05, ##p<0.01, ###p<0.001. (E–J) Mouse
air pouch model of microcrystal inflammation: IL-1β concentration (E), cell infiltration (F), proportion of neutrophils and macrophages (F,G) in the air pouch lavages of mice injected by either PBS, MSU or m- CPPD crystals and treated with 2- DG or PBS (n=12/group); H&E staining of air pouch membranes (I) and scoring of the inflammation (J) (n=5). Two- way analysis of variance test with FDR correction (#): #p<0.05, ##p<0.01, ###p<0.001.
2- DG, 2- deoxyglucose; ASC, apoptosis- associated speck- like containing a CARD; IL, interleukin; m- CPPD, monoclinic calcium pyrophosphate dihydrate; MSU, monosodium urate; NS, not significant.
by macrophages and inflammation in a mouse gout model.20 21
Nevertheless, whether macrophage metabolism reprogramming is involved in MSU and m- CPPD crystal- induced IL-1β produc-tion remains unknown.
In this study, we aimed to assess the metabolic phenotype of macrophages and the role of glucose uptake in the NLRP3- dependent IL-1β production in response to MSU and m- CPPD crystals. We observed that MSU and m- CPPD crystals induced metabolic modifications in macrophages towards an increase in glycolytic activity. Upregulation of glycolysis corroborated with a de novo glucose uptake mediated by the glucose transporter (GLUT) GLUT1, in response to microcrystals. Interestingly, glucose deprivation or glycolysis inhibition by knock- down of GLUT1 prevented ASC oligomerisation (NLRP3 activation) and IL-1β secretion induced by both crystals. Moreover, both inhi-bition of GLUT1 and glycolysis inhiinhi-bition by 2- DG decreased MSU and m- CPPD crystal- induced inflammation in an in vivo mouse model. Finally, in patients with gout flare, neutrophils isolated from the inflamed joint expressed more frequently GLUT1 at their surface membrane than circulating neutrophils, which highlights a promising specific approach for GLUT1 targeting as a gout flare therapy.
RESULTS
MSU and m-CPPD crystal-induced inflammation depends on glucose metabolism
To assess the role of glucose metabolism in crystal- induced inflammation, we stimulated cells with media containing
increasing concentrations of glucose (0–4 g/L) or supplemented with the glucose analogue 2- DG, an inhibitor of glycolysis. Both glucose deprivation and glycolysis inhibition drastically decreased IL-1β production by primed THP-1 cells or mouse bone marrow- derived macrophages (BMDMs) stimulated by either MSU or m- CPPD crystals (glucose deprivation decreased by more than 90% the crystal- induced IL-1β production by BMDMs) (figure 1A,B; online supplementary figure S1A,B). In contrary, increasing concentrations of glucose- enhanced IL-1β production (see online supplementary figure 1C). Neverthe-less, prostaglandin E2 and CXCL1 production, two proin-flammatory mediators involved in crystal inflammation, did not depend on glucose availability (see online supplementary figure S1E–F). Suppression of IL-1β production is secondary to the inhibition of NLRP3 inflammasome.1 3 Here, we
demon-strated that glucose deprivation suppressed ASC oligomerisa-tion and speck formaoligomerisa-tion induced by either MSU or m- CPPD crystals (figure 1C,D). We confirmed, in vivo, the central role of glycolysis and observed that mice treated with 2- DG displayed mild inflammatory response compared to untreated mice 6 hours after MSU or m- CPPD crystal stimulation. Indeed, 2- DG abrogated crystal- induced IL-1β production and prevented crystal- induced neutrophil infiltration assessed in the air pouch lavages (figure 1E–H). Histology analysis of air pouch membranes after H&E staining further evidenced that glycolysis inhibition suppressed neutrophil infiltration with a major decrease in inflammation score in mice treated by 2- DG (figure 1I,J).
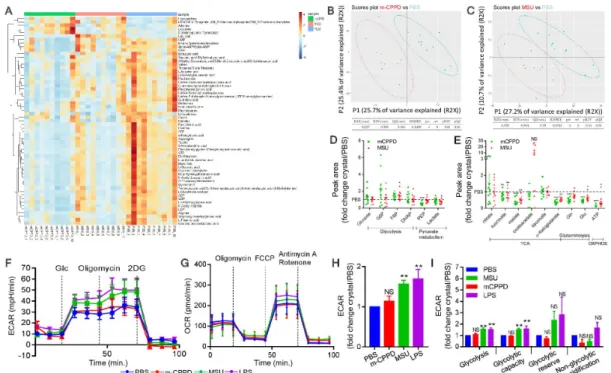
Figure 2 MSU and m- CPPD crystals induce metabolic changes in the glycolysis pathway and the TCA cycle. (A–E) Metabolomics analysis was performed by mass spectrometry in primed THP-1 cells treated by either PBS, MSU or m- CPPD crystals. (A) Heatmap analysis and (B,C) principal component analysis of MSU and m- CPPD crystals versus PBS (n=10). Relative quantification (ratio of MSU or m- CPPD to PBS) of the different metabolites related to glycolysis (D) and Krebs cycle or OXPHOS (E). Kruskal- Wallis test with FDR correction (*): *p<0.05, **p<0.01, ***p<0.001. (F–H) Real- time extracellular flux analysis on LPS- primed BMDMs stimulated with either MSU or m- CPPD. (F) Time course of real- time changes in the ECAR after Glycolysis Stress Assay (n=6). (G) Time course of real- time changes in the OCR after Cell Mito Stress Assay (n=4). (H) Mean of basal ECAR (ratio of crystals over PBS). (I) Glycolysis Stress Assay (n=6): each rate was determined according to the SeaHorse Agilent Guide and described in the Materials and methods section. Kruskal- Wallis test with FDR correction (*): *p<0.05, **p<0.01, ***p<0.001. 2- DG, 2- deoxyglucose; BMDM, bone marrow- derived macrophage; DHAP, dihydroxyacetone phosphate; ECAR, extracellular acidification rate; FCPP, carbonyl cyanide-4- (trifluoromethoxy) phenylhydrazone; LPS, lipopolysaccharide; m- CPPD, monoclinic calcium pyrophosphate dihydrate; MSU, monosodium urate; NS, not significant; OCR, oxygen consumption rate; OXPHOS, oxidative phosphorylation; PEP, phosphoenolpyruvate; TCA, tricarboxylic acid.
MSU and m-CPPD crystals induce modifications in the glycolysis and TCA cycle pathways
To better understand the involvement of glucose and cell metabolism in the microcrystal inflammatory response, we performed a metabolomics study and observed in partial least squares discriminant analysis that cells stimulated by either MSU or m- CPPD crystals had robust distinct metabolic profiles without overlap components compared with unstimulated cells. Metabolomics data are available in online supplementary table S1. Specifically, we observed modifications of the abun-dance of multiple metabolites (figure 2A–C). Crystals induced perturbation of multiple metabolic pathways, including amino acids and glucose metabolism (see online supplementary figure S2). We observed modifications in both glycolysis pathway and TCA cycle with a slight increase of fructose-6 phosphate and a strong decrease of phosphoenolpyruvate, α-ketoglutarate and malate (figure 2D,E). Beside glycolysis and TCA cycle components, there was also a decrease of glutamate and gluta-mine, two amino acids able to refuel the Krebs cycle in the absence of pyruvate.22 23 Interestingly, the intracellular ATP
was very low in crystal- stimulated cells, suggesting either an alteration of its production or an increased turnover. Then, we evaluated whether these crystals also modulated the expres-sion of genes encoding enzymes or transporters involved in the glycolysis pathway and Krebs cycle. We did observe vari-ations in expression of genes encoding HK-2, mitochondrial pyruvate carrier 1 and 2, monocarboxylate transporter 4, pyruvate dehydrogenase phosphatase 2, isocitrate dehydro-genase 1 and 2, and pyruvate dehydrodehydro-genase kinase 2 and 3
(see online supplementary figure S3A–D). Altogether, these results suggested that crystals altered glycolytic activity and mitochondrial function. We assessed this hypothesis with Seahorse experiments that permit analysis of real- time changes in the extracellular acidification rate (ECAR) (figure 2F) and oxygen consumption rate (OCR) (figure 2G), as surrogates of glycolysis and mitochondrial respiration, respectively. We observed that only MSU crystals increased macrophage basal glycolysis (figure 2H), glycolytic rate and glycolytic activity (figure 2I) while both MSU and m- CPPD crystals did not affect the OXPHOS (figure 2G; online supplementary figure S3E,F). Analysis of OCR suggested that MSU crystals increased only non- mitochondrial oxygen consumption (see online supple-mentary figure S3F).
MSU and m-CPPD crystals increase glucose uptake associated with GLUT1 expression at the cell surface
As crystal- induced IL-1β production relied on glucose avail-ability, we quantified the variation of glucose concentrations in cell culture media. By doing this, we observed that glucose concentrations were significantly lower in culture media of macrophages stimulated by either MSU or m- CPPD crystals than in culture media of unstimulated cells (figure 3A). Then, we confirmed the de novo glucose uptake by showing that MSU and m- CPPD crystals enhanced the intracellular level of radiolabelled [18F]-FDG by 152% and 148%, respectively (figure 3B). Glucose
uptake has been reported in gouty joint flare in patients18 19;
we reproduced this observation in the air pouch model using Figure 3 Crystal- induced inflammation is associated with an increase in glucose uptake. (A) Extracellular glucose concentration in cell culture media was quantified 6 hours after crystal stimulation (n=5). (B) [18F]-fluorodeoxyglucose ([18F]-FDG) was quantified in cell pellets to assess glucose uptake
after 1 hour of stimulation by either MSU or m- CPPD crystals (n=8). (C–E) Glucose uptake was quantified in air pouch (arrow) model using [18F]-FDG
PET/CT. (C) Imaging representative of 6 mice; (D) SUVmax of air pouch; and (E) proportion of injected [18F]-FDG dose detected in the air pouch (n=6
mice per group). (F) Ratio of [18F]-FDG per weight (g) of ex vivo isolated air pouch membranes. Kruskal- Wallis test with FDR correction (*): *p<0.05,
**p<0.01, ***p<0.001. (G) Correlation between IL-1β concentration (pg/mL) in the air pouch and the [18F]-FDG quantification (% dose/g) in the cell
infiltrate, Spearman test. [18F]-FDG, 18F- fluorodeoxyglucose; IL, interleukin; m- CPPD, monoclinic calcium pyrophosphate dihydrate; MSU, monosodium
[18F]-FDG. By PET/CT imaging, glucose uptake in response to
MSU and m- CPPD crystals was evidenced by a higher labelling of the air pouch where crystals were injected, as well as higher maximum standardised uptake value (SUVmax) and ratio of radio-labelled tracer found in air pouch compared with air pouch injected by saline solution (figure 3C–E). Moreover, after in vivo acquisition, quantification of the radiotracer showed that the level of [18F]-FDG was higher in air pouch membranes isolated
from crystal- stimulated mice than from saline- stimulated mice (figure 3F), which was strongly correlated with IL-1β production in the air pouch (figure 3G).
Glucose enters the cells through GLUTs that belong to solute carrier family 2 (SCL2A), which encompasses 14 members. SLC2A proteins are overexpressed in tumour cells, and SLC2A1 (GLUT1) is rapidly upregulated in inflammatory macrophages and contributes to glycolytic phenotype.24 GLUT6 has been
previously reported as not being involved in glucose uptake and glycolysis25; therefore, we focused on GLUT1 expression. We
first showed that both MSU and m- CPPD crystal stimulation in vitro upregulated the GLUT1 gene expression on BMDMs (see online supplementary figure S4B) and the GLUT1 protein expression on THP-1 cells (figure 4A–D; see also figure 5A). By confocal microscopy, we observed that microcrystals induced a higher expression of GLUT1 at the cell plasma membrane compared with unstimulated cells (figure 4A,B). Moreover, the analysis by flow cytometry showed that both crystals, as well as the NLRP3 activator LPS, induced an increase in mean of GLUT1 expression intensity at the cell surface (figure 4C,D). The increased GLUT1 expression in response to crystals was
confirmed in vivo (figure 4E–G). First, we observed by immu-nofluorescence an increased expression of GLUT1 in the air pouch membrane (figure 4E). Second, the infiltrated cells into the air pouch expressed a higher level of GLUT1 messenger RNA (mRNA) (figure 4F) after crystal injection compared with saline injection, and between 50% and 70% of the recruited cells were positive for GLUT1 (figure 4G). The percentage of GLUT1- positive cells was also correlated with the inflammatory response and glucose uptake measured by IL-1β concentration and SUVmax, respectively, in the air pouch (figure 4H1). Finally, we validated these in vivo data by GLUT1 expression analysis on inflammatory cells isolated from gout flare patients. We observed that the ratio of GLUT1- expressing cells among the neutro-phils was higher in the synovial fluid than in blood (figure 4J), suggesting that cells increased their GLUT1 expression at the site of inflammation where MSU crystals are present (MSU crystals were observed in 100% of the synovial fluid samples).
Altogether, these results suggested that MSU and m- CPPD crystal inflammation is supported by a de novo increase in GLUT1 expression and its relocalisation to the plasma membrane, required for glucose uptake and metabolic reprogramming. GLUT1 regulates crystal-induced inflammation
To assess the role of GLUT1 in MSU and m- CPPD crystal- induced inflammation, we adopted pharmacological (STF-31: iGLUT1) and genetic knock- down approaches (SLC2A1 small interfering RNA: siGLUT1; see validation in figure 5A) of GLUT1 inhibition. First, iGLUT1 suppressed the glucose Figure 4 MSU and m- CPPD crystals increase GLUT1 expression at the cell plasma membrane. (A–C) GLUT1 membrane localisation in primed- THP-1 cells stimulated by PBS, MSU or m- CPPD was assessed by immunofluorescence confocal microscopy. (A) Imaging representative of five experiments and (B) quantification of GLUT1 membrane expression. (C) Representative overlay (MFI) by FACS of GLUT1 cell surface expression, (D) quantification of the ratio of GLUT1 MFI (crystal over PBS, LPS used as a positive control of stimulation) (n=5). Kruskal- Wallis test with FDR correction (*): *p<0.05, **p<0.01, ***p<0.001. (E–I) GLUT1 expression was evaluated in mouse air pouch model of microcrystal inflammation. After PBS, MSU or m- CPPD injection (E) GLUT1 expression in the air pouch membranes was assessed by immunofluorescence confocal microscopy (representative images (n=5), (F) expression of GLUT1 gene was assessed by RT- qPCR using RNA isolated from infiltrated cells collected in air pouch lavages. Data are represented as a % of GLUT1 or GLUT6 mRNA expression compared with 18S mRNA expression in each condition of stimulation. (n=6). (G) Percentage of GLUT1- expressing cells was assessed by FACS using infiltrated cells collected in air pouch lavages (n=6). Kruskal- Wallis test with FDR correction (*): *p<0.05, **p<0.01, ***p<0.001. Correlation between GLUT1- positive cells in the air pouch lavages and (H) IL-1β production or (I) glucose uptake, Spearman test. (J) Plasma membrane expression of GLUT1 was evaluated FACS comparing neutrophils isolated from flaring joint and circulating neutrophils isolated from peripheral blood of the same patient at the same moment (n=7). Two- tailed paired t test (*): *p<0.05, **p<0.01, ***p<0.001. FACS, fluorescence activated cell sorting; GLUT1, glucose transporter 1; IL, interleukin; LPS, lipopolysaccharide; m- CPPD, monoclinic calcium pyrophosphate dihydrate; MFI, mean fluorescence intensity; mRNA, messenger RNA; MSU, monosodium urate; SUVmax, maximum standardised uptake value.
uptake induced by MSU and m- CPPD crystals (figure 5B), posi-tioning GLUT1 as the main GLUT involved in the microcrystal response. Then, we demonstrated that GLUT1 inhibition by either of the two technical approaches led to a 50% inhibi-tion of IL-1β producinhibi-tion in response to MSU and m- CPPD (figure 5C,D). This IL-1β reduction under iGLUT1 was due to an inhibition of the NLRP3 inflammasome activation as GLUT1 inhibition prevented by 75% the ASC speck formation (figure 5E). Partial inhibition of NLRP3 activation and subse-quently IL-1β production by iGLUT1 suggested that GLUT1 was involved in an amplification loop but not an initial signal of IL-1β production. Nevertheless, we observed that glucose depletion and GLUT1 inhibition decreased both NLRP3 and IL-1β gene expression and pro- IL-1β synthesis induced by phorbol myristate acetate (PMA) priming, suggesting that
glucose also played a role in the first signal (see online supple-mentary figure S5A,B).
Finally, we evaluated the iGLUT1 efficiency on microcrystal inflammation in vivo. iGLUT1 delivered by intraperitoneal injection allowed to drastically inhibit all signs of local inflam-mation induced by MSU and m- CPPD into the air pouch, namely, a decrease in IL-1β production (figure 5G), a reduc-tion of cell infiltrareduc-tion (figure 5H) associated with neutrophil recruitment (see online supplementary figure S5C,D) and a global alleviation of the inflammatory score observed from HE staining of air pouch membrane (figure 5I).
DISCUSSION
We found that MSU and m- CPPD crystal- induced macro-phage production of IL-1β, which orchestrated the recurrent Figure 5 GLUT1 drives crystal- induced inflammation. (A–F) PBS, MSU or m- CPPD crystal stimulation of primed THP-1 cells pretreated or not (PBS) with STF-31 (20 µM, iGLUT1) or transfected with GLUT1 siRNA (si). (A) Validation of GLUT1 expression knock- down by western blot, (B) Quantification of [18F]-FDG in the cell pellets. Data shown as fold change after crystal stimulation compared with PBS. (C,D) IL-1β concentration measured by
ELISA in the supernatants of cell culture (n=3). (D) Data are presented as % of inhibition compared with wild type THP-1 cells (n=3). (E,F) ASC speck formation was assessed by immunofluorescence confocal microscopy. (E) Imaging representative of four experiments. (F) Quantification of cells showing at least one ASC speck formation. Kruskal- Wallis test with FDR correction (*): *p<0.05, **p<0.01, ***p<0.001. (G–J) On air pouch model of crystal inflammation in mice treated or not with GLUT1 inhibitor STF-31 (iGLUT1, 10 mg/kg). (G) IL-1β concentration quantified by ELISA and (H) number of infiltrate cells in air pouch lavages (n=15 per group). H&E staining (PBS: n=8 mice per group, iGLUT1: n=5 mice per group) realised on air pouch membrane sections. (I) Representative images and (J) scoring of inflammation. Two- way analysis of variance test with FDR correction (*): *p<0.05, **p<0.01, ***p<0.001. [18F]-FDG, 18F- fluorodeoxyglucose; ASC, apoptosis- associated speck- like containing a CARD; GLUT1, glucose
inflammatory flares in gout and m- CPPD deposition disease, respectively, relied on glucose uptake through GLUT1 (figure 6). Glucose deprivation and glycolysis inhibition decreased NLRP3 and IL-1β gene expression and suppressed ASC speck formation (ie, NLRP3 activation), IL-1β production and neutrophil infil-tration induced by MSU and m- CPPD crystals. Crystals induced GLUT1 de novo expression and its localisation to plasma membrane, along with gene expression of enzymes involved in glycolysis such as HK-2. Increase glucose uptake during MSU and m- CPPD crystal- induced inflammation has been reported in patients using [18F]-FDG PET/CT.18 19 We reproduced these
observations in a mouse model, and we identified for the first time the key role of GLUT1 in both MSU and m- CPPD crystal- induced inflammation in mice and in human samples harvested during gout flare. Interestingly, we discovered that MSU crystal- induced glucose uptake favoured glycolytic activity, while m- CPPD crystals induced glucose uptake without modu-lation of glycolytic activity. Surprisingly, both microcrystals did not modulate OXPHOS. These results were distinct from the Warburg effect described in cancer cells and LPS- stimulated macrophages, where metabolic switch enhanced aerobic glycol-ysis at the expense of mitochondrial respiration.8–10 12 26 Also
reported, MSU crystals increased both OXPHOS and glyco-lytic activity on human neutrophils.27 These findings further
supported the complexity of cellular metabolic programmes and responses, which varied with the type and concentration of stimuli, cell type and cell species and tissue environment.13 28–30
For example, LPS stimulated Warburg- like metabolic repro-gramming in human monocytes at concentrations between 1 and 100 ng/mL but increased OXPHOS at a low dose of 0.1 ng/ mL.29 Likewise, monocytes stimulated with TLR2 agonist
Pam3CysSK4 (P3C) or by whole microorganisms activated both glycolysis pathway and OXPHOS.29 Finally, analysis of monocyte
transcriptomic responses under 28 different stimuli identified 10 clusters that represented distinct activation states with distinct metabolic responses.30 These data suggested that a specific
stimulus would trigger metabolic responses corresponding to a specific and functional requirement of the cells. For instance, MSU and m- CPPD crystal- induced metabolic reprogramming might increase either the phagocytosis capacity (as shown in monocytes stimulated by P3C) or the reactive oxygen species (ROS) production (as shown in neutrophils stimulated by MSU crystals),27 29 two well- known mechanisms of crystal- induced
NLRP3 activation.1 31 In parallel, we found that MSU crystals
activated macrophage glycolysis pathway to produce IL-1β as well described in macrophages stimulated by LPS, in activated T cells and cancer cells.8–10 12 17 26 28 However, how MSU-
induced and m- CPPD crystal- induced glucose uptake activates the NLRP3 inflammasome remained unknown. One explanation could come from the induction of HK-2 by MSU and m- CPPD. Indeed, in LPS- stimulated macrophages, IL-1β production can be modulated by metabolites and enzymes involved in the glycolysis pathway, including HK-1 and HK-2, which can both interact with mitochondrial voltage- dependent anion channel to activate NRLP3,32 glyceraldehyde 3- phosphate dehydrogenase33
and inactive PKM2.14 34 Cancer cells and LPS- stimulated
macro-phages overexpress inactive dimer PKM2, which promotes HIF-1α activation and transcription of HIF-1α-dependent genes, including IL-1β and glycolytic enzymes.14 34 Alternatively,
MSU and m- CPPD crystal- induced glucose uptake might stim-ulate IL-1β production through Akt pathway and ROS produc-tion.27 35 36 PI3K (phosphatidylinositol-3 kinase)/Akt pathway is
commonly activated by MSU and m- CPPD crystals.27 36 37 Akt
activation enhanced IL-1β production through induction of ROS and glucose metabolism. Akt promoted glycolysis through stimulation of HK-2 and glucose uptake via translocation of GLUT1 to cell surface membrane and activation of its down-stream mTORC1. This later stimulated HIF-1α, which enhanced expression of genes involved in glycolytic reprogramming, such as SLC2A1 (GLUT1).38
Glucose is a critical nutrient component for inflammatory macrophages, and GLUT1 is the main GLUT expressed in LPS- stimulated macrophages.24 Elevated GLUT1 expression
increased glucose metabolism and glycolysis, ROS produc-tion and expression of proinflammatory mediators, including IL-1β.24 Here, we found that MSU and m- CPPD crystals
trig-gered plasma membrane localisation of GLUT1, which drove glucose uptake, NLRP3 activation and IL-1β production. Furthermore, we observed in gouty patients that GLUT1 was more frequently expressed at the surface of neutrophils isolated from flaring joint than neutrophils isolated from peripheral blood of the same patient. These results added crystal- induced IL-1β production to the list of inflammatory conditions regu-lated by GLUT1- induced glucose uptake in macrophages, such as cancer, infection, autoimmune disease, diabetes and obesity.14 24 28 35 39 40 Interestingly GLUT1 also governed
post-prandial glucose uptake by peritoneal macrophages, leading to IL-1β production and, subsequently, insulin secretion.35
This might explain why gout flare frequently occurred after a feast. MSU and m- CPPD crystals enhanced both GLUT1 mRNA expression and GLUT1 plasma membrane localisa-tion by unknown mechanisms. GLUT1 activity is regulated by its membrane localisation and activation, kinetic of its inter-nalisation, endosomal sorting and recycling back to the cell membrane, which depends on retromer cargo complex.41 42
Cancer cells favour aerobic glycolysis by promoting GLUT1 plasma membrane localisation through the PI3K/Akt/mTORC Figure 6 GLUT1 and glycolysis regulate NLRP3 inflammasome
activation and IL-1β production induced by MSU and m- CPPD crystals. Crystals induced GLUT1 gene expression, GLUT1 production and its localisation in plasma membrane. NLRP3 activation and IL-1β production in response to MSU and m- CPPD crystals rely on glucose uptake through GLUT1 and glycolysis. In parallel, MSU and m- CPPD crystals induce gene expression of pro- IL-1β and NLRP3, along with enzymes involved in glycolysis and TCA pathways, including GLUT1, HK-2, MCT, PDP1 and PDK1/2. ECAR, extracellular acidification rate; GLUT1, glucose transporter 1; HK, hexokinase; IL, interleukin; m- CPPD, monoclinic calcium pyrophosphate dihydrate; MCP, mitochondrial carrier proteins; MCT, monocarboxylate transporter; PDP, pyruvate dehydrogenase phosphatase; PDK, pyruvate dehydrogenase kinase. TCA, tricarboxylic acid.
pathway.43–45 Akt activation promotes cell surface membrane
recycling of GLUT1 and reduces its internalisation.43 Inversely,
Akt inhibition by phosphatase TENsin homologue deleted on chromosome 10 (PTEN) prevented GLUT1 plasma membrane localisation45–47 Whether MSU and m- CPPD crystals
regu-lated GLUT1 membrane expression through the Akt pathway needs to be studied. Alternatively, MSU and m- CPPD crys-tals might induce GLUT1 membrane localisation through thioredoxin- interacting protein, which facilitated GLUT1 endocytosis via clathrin- coated pits, modulated PTEN activity and was involved in crystal- induced inflammation.31 48 Lastly,
crystal- induced glucose uptake might be due to an increase in GLUT1 transport activity. Indeed, the drastic decrease of cytosolic ATP observed after MSU and m- CPPD crystal stimu-lation might stimulate GLUT1 transport activity, as previously reported.49 50
Although SLC2A6 (GLUT6) gene expression in THP-1 cells was highly enhanced by either MSU or m- CPPD crystal stim-ulation, its exact role in crystal- induced inflammation and glucose uptake is currently unknown. Recent data suggested that GLUT6 was involved in neither glucose uptake nor glycolysis nor OXPHOS.25 51 52 GLUT6- deficient mice had normal glucose
metabolism51 and GLUT6- deficient BMDMs had similar ECAR
and OCR than wild- type cells.25 52 Moreover, expression of
proin-flammatory mediators such as IL-1β and TNF-α was unchanged in the absence of GLUT6.52 Further studies are needed to understand
how GLUT6 participates to crystal- induced inflammation. How MSU and m- CPPD crystals induced GLUT1 membrane localisation constituted the main limitation of our study. Although we did not identify the exact mechanisms involved in crystal effects, our results suggested that MSU and m- CPPD crystals increased, in THP-1 and mouse BMDM cells, GLUT1 gene expression, GLUT1 protein production and membrane location and GLUT1 activity. Whether crystals induced IL-1β production by primary human monocytes does also depend on glucose uptake need specific studies. Similarly, we did not assess in this study how hyperglycaemic modulated crystal- induced inflammation in vivo. We planned to address this question in type 2 and type 1 diabetes using Ob/Ob mice and streptozotocin mouse models, respectively. Interestingly, recent report supported our findings by showing that patients treated with metformin had less gout flare.53 Finally, metabolic
reprogramming during gout flare needed also to be confirmed in patients by doing metabolomics analysis in neutrophils isolated from inflamed joint.
Overall, metabolic changes characterised by GLUT1- mediated glucose uptake and increase in glycolysis governed MSU and m- CPPD crystal- activated IL-1β production. These findings open new therapeutic paths to modulate crystal- related inflammation.
MATERIALS AND METHODS
See a fully detailed Materials and methods in the online supple-mentary file.
Author affiliations 1Universite de Paris, Paris, France
2INSERM, UMR- S 1132, F-75010, Paris, France
3INSERM, Immunity and Metabolism in Diabetes Laboratory, Centre de Recherche
des Cordelier, Paris, France
4Service de Pharmacologie et immunoanalyse (SPI), Laboratoire d’Etude du
Métabolisme des Médicaments, CEA, INRAE, Université Paris Saclay, Gif- Sur- Yvette, France
5UMS28 Phénotypage du Petit Animal, Laboratoire d’Imagerie Moléculaire
Positonique (LIMP), F-75020, Sorbonne Université, Paris, France
6UMR 5085 INPT- UPS- CNRS, Université de Toulouse, ENSIACET, F-31000, Toulouse,
France
7Bone and Joint Laboratory, INSERM U1132, Paris, France Twitter Fawaz Alzaid @DrFAlzaid
Acknowledgements We thank Mylène Zarka Prost- Dumont, Morgane Bourmaud,
Yohan Jouan and Yetki Aslan (UMRS-1132) for their precious help during the in vivo experiments.
Contributors H- KE conceived the study. FR, LC- G and H- KE contributed to its
design and coordination, participated in data interpretation and cowrote the manuscript. LC- G and FR performed the laboratory experiments. CC synthesised calcium pyrophosphate crystals, characterised their physicochemical structure and contributed to writing the manuscript. LO, FA and NV performed the Seahorse experiments. FC and FF realised the metabolomics study. AP performed PET study. PR, TB, FR and H- KE collected the patient samples. H- KE, CC, PR, MC- S and FL secured the funding. All authors participated in the final approval of the manuscript.
Funding The study was funded by ANR (ANR- 126BS08-0022-01), ART Viggo, the
’Prevention et Traitement des Décalcifications (PTD)’ Association, Arthritis Courtin foundation (Arthritis R&D 2018-2019) and the French Society of Rheumatology (SFR 2017-2018, SFR 2018-2019). LC- G was financially supported by grants from ANR and ART Viggo, and FR by Paris Diderot University and ART Viggo, PTD.
Competing interests None declared.
Patient and public involvement Patients and/or the public were not involved in
the design, conduct, reporting or dissemination plans of this research.
Patient consent for publication Not required.
Provenance and peer review Not commissioned; externally peer reviewed. Data availability statement No data are available. All data relevant to the study
are included in the article or uploaded as supplementary information. All data are included in the article.
ORCID iDs
Lucie Orliaguet http:// orcid. org/ 0000- 0002- 3209- 457X
Martine Cohen- Solal http:// orcid. org/ 0000- 0002- 8582- 8258
Pascal Richette http:// orcid. org/ 0000- 0003- 2132- 4074
Thomas Bardin http:// orcid. org/ 0000- 0002- 5080- 4790
Hang- Korng Ea http:// orcid. org/ 0000- 0002- 2393- 7475 REFERENCES
1 Martinon F, Pétrilli V, Mayor A, et al. Gout- associated uric acid crystals activate the NALP3 inflammasome. Nature 2006;440:237–41.
2 Martin WJ, Walton M, Harper J. Resident macrophages initiating and driving inflammation in a monosodium urate monohydrate crystal- induced murine peritoneal model of acute gout. Arthritis Rheum 2009;60:281–9.
3 Campillo- Gimenez L, Renaudin F, Jalabert M, et al. Inflammatory potential of four different phases of calcium pyrophosphate relies on NF-κB activation and MAPK pathways. Front Immunol 2018;9:2248.
4 Martinon F, Burns K, Tschopp J. The inflammasome: a molecular platform triggering activation of inflammatory caspases and processing of proIL- beta. Mol Cell
2002;10:417–26.
5 Lu A, Magupalli VG, Ruan J, et al. Unified polymerization mechanism for the assembly of ASC- dependent inflammasomes. Cell 2014;156:1193–206.
6 Sivera F, Andrés M, Pascual E. Current advances in therapies for calcium pyrophosphate crystal arthritis. Curr Opin Rheumatol 2016;28:140–4. 7 Richette P, Doherty M, Pascual E, et al. 2018 Updated European League against
rheumatism evidence- based recommendations for the diagnosis of gout. Ann Rheum Dis 2020;79:31–8.
8 Warburg O, Wind F, Negelein E. The metabolism of tumors in the body. J Gen Physiol
1927;8:519–30.
9 Jha AK, Huang SC- C, Sergushichev A, et al. Network integration of parallel metabolic and transcriptional data reveals metabolic modules that regulate macrophage polarization. Immunity 2015;42:419–30.
10 Próchnicki T, Latz E. Inflammasomes on the crossroads of innate immune recognition and metabolic control. Cell Metab 2017;26:71–93.
11 Andrejeva G, Rathmell JC. Similarities and distinctions of cancer and immune metabolism in inflammation and tumors. Cell Metab 2017;26:49–70.
12 Tannahill GM, Curtis AM, Adamik J, et al. Succinate is an inflammatory signal that induces IL-1β through HIF-1α. Nature 2013;496:238–42.
13 Everts B, Amiel E, Huang SC- C, et al. TLR- driven early glycolytic reprogramming via the kinases TBK1- IKKɛ supports the anabolic demands of dendritic cell activation. Nat Immunol 2014;15:323–32.
14 Palsson- McDermott EM, Curtis AM, Goel G, et al. Pyruvate kinase M2 regulates HIF-1α activity and IL-1β induction and is a critical determinant of the Warburg effect in LPS- activated macrophages. Cell Metab 2015;21:65–80.
15 Moon J- S, Hisata S, Park M- A, et al. mTORC1- Induced HK1- Dependent glycolysis regulates NLRP3 inflammasome activation. Cell Rep 2015;12:102–15. 16 Hughes MM, O’Neill LAJ. Metabolic regulation of NLRP3. Immunol Rev
2018;281:88–98.
17 Mills EL, Kelly B, Logan A, et al. Succinate dehydrogenase supports metabolic repurposing of mitochondria to drive inflammatory macrophages. Cell
2016;167:457–70.
18 Steiner M, Vijayakumar V. Widespread tophaceous gout demonstrating avid F-18 fluorodeoxyglucose uptake. Clin Nucl Med 2009;34:433–4.
19 Shen G, Su M, Liu B, et al. A case of tophaceous pseudogout on 18F- FDG PET/CT imaging. Clin Nucl Med 2019;44:e98–100.
20 Youm Y- H, Nguyen KY, Grant RW, et al. The ketone metabolite β-hydroxybutyrate blocks NLRP3 inflammasome- mediated inflammatory disease. Nat Med
2015;21:263–9.
21 Goldberg EL, Asher JL, Molony RD, et al. β-Hydroxybutyrate Deactivates Neutrophil NLRP3 Inflammasome to Relieve Gout Flares. Cell Rep 2017;18:2077–87. 22 Yang C, Ko B, Hensley CT, et al. Glutamine oxidation maintains the TCA cycle and cell
survival during impaired mitochondrial pyruvate transport. Mol Cell 2014;56:414–24. 23 Palmieri EM, Menga A, Martín- Pérez R, et al. Pharmacologic or genetic targeting of
glutamine synthetase skews macrophages toward an M1- like phenotype and inhibits tumor metastasis. Cell Rep 2017;20:1654–66.
24 Freemerman AJ, Johnson AR, Sacks GN, et al. Metabolic reprogramming of macrophages: glucose transporter 1 (GLUT1)- mediated glucose metabolism drives a proinflammatory phenotype. J Biol Chem 2014;289:7884–96.
25 Caruana BT, Byrne FL, Knights AJ, et al. Characterization of glucose transporter 6 in lipopolysaccharide- induced bone marrow- derived macrophage function. J Immunol
2019;202:ji1801063.
26 O’Neill LAJ, Kishton RJ, Rathmell J. A guide to immunometabolism for immunologists.
Nat Rev Immunol 2016;16:553–65.
27 Rousseau L- S, Paré G, Lachhab A, et al. S100A9 potentiates the activation of neutrophils by the etiological agent of gout, monosodium urate crystals. J Leukoc Biol
2017;102:805–13.
28 Stienstra R, Netea- Maier RT, Riksen NP, et al. Specific and complex reprogramming of cellular metabolism in myeloid cells during innate immune responses. Cell Metab
2017;26:142–56.
29 Lachmandas E, Boutens L, Ratter JM, et al. Microbial stimulation of different Toll- like receptor signalling pathways induces diverse metabolic programmes in human monocytes. Nat Microbiol 2016;2:16246.
30 Xue J, Schmidt SV, Sander J, et al. Transcriptome- based network analysis reveals a spectrum model of human macrophage activation. Immunity 2014;40:274–88. 31 Zhou R, Tardivel A, Thorens B, et al. Thioredoxin- interacting protein links oxidative
stress to inflammasome activation. Nat Immunol 2010;11:136–40. 32 Moon HY, van Praag H. Muscle over mind. Cell Metab 2014;20:560–2. 33 Kornberg MD, Bhargava P, Kim PM, et al. Dimethyl fumarate targets GAPDH and
aerobic glycolysis to modulate immunity. Science 2018;360:449–53.
34 Luo W, Hu H, Chang R, et al. Pyruvate kinase M2 is a PHD3- stimulated coactivator for hypoxia- inducible factor 1. Cell 2011;145:732–44.
35 Dror E, Dalmas E, Meier DT, et al. Postprandial macrophage- derived IL-1β stimulates insulin, and both synergistically promote glucose disposal and inflammation. Nat Immunol 2017;18:283–92.
36 Tavares LD, Galvão I, Costa VV, et al. Phosphoinositide-3 kinase gamma regulates caspase-1 activation and leukocyte recruitment in acute murine gout. J Leukoc Biol
2019;106:619–29.
37 Liu- Bryan R, Pritzker K, Firestein GS, et al. TLR2 signaling in chondrocytes drives calcium pyrophosphate dihydrate and monosodium urate crystal- induced nitric oxide generation. J Immunol 2005;174:5016–23.
38 Lee KY, Gesta S, Boucher J, et al. The differential role of Hif1β/Arnt and the hypoxic response in adipose function, fibrosis, and inflammation. Cell Metab
2011;14:491–503.
39 Meireles P, Sales- Dias J, Andrade CM, et al. GLUT1- mediated glucose uptake plays a crucial role during Plasmodium hepatic infection. Cell Microbiol 2017;19. doi:10.1111/cmi.12646. [Epub ahead of print: 02 Aug 2016].
40 Loisel- Meyer S, Swainson L, Craveiro M, et al. Glut1- mediated glucose transport regulates HIV infection. Proc Natl Acad Sci U S A 2012;109:2549–54. 41 Roy S, Leidal AM, Ye J, et al. Autophagy- Dependent shuttling of TBC1D5 controls
plasma membrane translocation of GLUT1 and glucose uptake. Mol Cell
2017;67:84–95.
42 Steinberg F, Gallon M, Winfield M, et al. A global analysis of SNX27- retromer assembly and cargo specificity reveals a function in glucose and metal ion transport.
Nat Cell Biol 2013;15:461–71.
43 Wieman HL, Wofford JA, Rathmell JC. Cytokine stimulation promotes glucose uptake via phosphatidylinositol-3 kinase/Akt regulation of GLUT1 activity and trafficking. Mol Biol Cell 2007;18:1437–46.
44 Beg M, Abdullah N, Thowfeik FS, et al. Distinct Akt phosphorylation states are required for insulin regulated GLUT4 and GLUT1- mediated glucose uptake. Elife
2017;6:e26896.
45 Phadngam S, Castiglioni A, Ferraresi A, et al. Pten dephosphorylates Akt to prevent the expression of GLUT1 on plasmamembrane and to limit glucose consumption in cancer cells. Oncotarget 2016;7:84999–5020.
46 Morani F, Phadngam S, Follo C, et al. PTEN regulates plasma membrane expression of glucose transporter 1 and glucose uptake in thyroid cancer cells. J Mol Endocrinol
2014;53:247–58.
47 Shinde SR, Maddika S. PTEN regulates glucose transporter recycling by impairing SNX27 retromer assembly. Cell Rep 2017;21:1655–66.
48 Wu N, Zheng B, Shaywitz A, et al. AMPK- dependent degradation of TXNIP upon energy stress leads to enhanced glucose uptake via GLUT1. Mol Cell
2013;49:1167–75.
49 Ives A, Nomura J, Martinon F, et al. Xanthine oxidoreductase regulates macrophage IL1β secretion upon NLRP3 inflammasome activation. Nat Commun 2015;6:6555. 50 Blodgett DM, De Zutter JK, Levine KB, et al. Structural basis of GLUT1 inhibition by
cytoplasmic ATP. J Gen Physiol 2007;130:157–68.
51 Byrne FL, Olzomer EM, Brink R, et al. Knockout of glucose transporter GLUT6 has minimal effects on whole body metabolic physiology in mice. Am J Physiol Endocrinol Metab 2018;315:E286–93.
52 Maedera S, Mizuno T, Ishiguro H, et al. GLUT6 is a lysosomal transporter that is regulated by inflammatory stimuli and modulates glycolysis in macrophages. FEBS Lett
2019;593:195–208.
53 Vazirpanah N, Ottria A, van der Linden M, et al. mTOR inhibition by metformin impacts monosodium urate crystal- induced inflammation and cell death in gout: a prelude to a new add- on therapy? Ann Rheum Dis 2019;78:663–71.