HAL Id: hal-00563216
https://hal.archives-ouvertes.fr/hal-00563216
Submitted on 4 Feb 2011
HAL is a multi-disciplinary open access
archive for the deposit and dissemination of sci-entific research documents, whether they are pub-lished or not. The documents may come from teaching and research institutions in France or abroad, or from public or private research centers.
L’archive ouverte pluridisciplinaire HAL, est destinée au dépôt et à la diffusion de documents scientifiques de niveau recherche, publiés ou non, émanant des établissements d’enseignement et de recherche français ou étrangers, des laboratoires publics ou privés.
16O17O, 17O18O and 17O2 by CRDS at 80 K
Samir Kassi, Olga Leshchishina, I.E. Gordon, S.S. Yu, Alain Campargue
To cite this version:
Samir Kassi, Olga Leshchishina, I.E. Gordon, S.S. Yu, Alain Campargue. Hyperfine structure of the a1�g - X 3Σg – transitions of 16O17O, 17O18O and 17O2 by CRDS at 80 K. Chemical Physics Letters, Elsevier, 2011, 502, pp.37. �10.1016/j.cplett.2010.12.017�. �hal-00563216�
The CRDS spectrum of the a1g-X 3Σg −
band of 16O17O, 17O18O and 17O2 has been
recorded at 80 K.
The nuclear hyperfine structure of the transitions could be partly resolved. The hyperfine parameter coupling in the a1g state has been derived.
7888.55 7888.60 7888.65 0.0 0.1 0.2 0.3 Abs o rpti o n co effi ci en t (10 -6 cm -1 ) Wavenumber (cm-1) 16
O
17O
3
Σ
−
g
F'' N=1 N=2 F'1
Δ
g
0.5 1.5 2.5 3.5 4.5 1.5 2.5 3.5 J=2 J=11 2 3 4 5 6 7 8 9 10 11 12 13 14 15 16 17 18 19 20 21 22 23 24 25 26 27 28 29 30 31 32 33 34 35 36 37 38 39 40 41 42 43 44 45 46 47 48 49 50 51 52 53 54 55 56 57 58 59 60
Hyperfine structure of the a
1
g- X
3Σ
g −
transitions of
16O
17O,
17O
18O and
17O
2by CRDS at 80 K
Samir Kassia, Olga Leshchishinaa, b, Iouli E. Gordonc, Shanshan Yud, Alain Campargue a*
a
Université Joseph Fourier/CNRS, Laboratoire de Spectrométrie Physique, 38402 Saint-Martin-d’Hères, FRANCE
b
Laboratory of Theoretical Spectroscopy, Zuev Institute of Atmospheric Optics, 1 Akademicheskii av., 634021 Tomsk, RUSSIA
c
Harvard-Smithsonian Center for Astrophysics, Atomic and Molecular Physics Division, Cambridge MA 02138, USA
d
Jet Propulsion Laboratory, California Institute of Technology, Pasadena, CA 91109-8099, USA
*
Corresponding author: Tel.: +33 4 76 51 43 19; Fax: +33 4 76 63 54 95.
E-mail address: Alain.CAMPARGUE@ujf-grenoble.fr (Alain CAMPARGUE).
Keywords: Oxygen, O2, hyperfine structure, Cavity ring down spectroscopy, cryogenic cell
*The Manuscript
3 4 5 6 7 8 9 10 11 12 13 14 15 16 17 18 19 20 21 22 23 24 25 26 27 28 29 30 31 32 33 34 35 36 37 38 39 40 41 42 43 44 45 46 47 48 49 50 51 52 53 54 55 56 57 58 59 60 61 Abstract
The high sensitivity absorption spectrum of the a1g-X 3Σg −
band of 16O17O, 17O18O and 17O2
has been recorded by CW-Cavity Ring Down Spectroscopy near 1.27 μm. The spectra were obtained between 7640 and 7917 cm-1 with a 17O-enriched sample at room temperature and at 80 K. Due to the I= 5/2 nuclear spin of the 17O atom, the nuclear hyperfine structure of the transitions could be partly resolved at low temperature. The parameter coupling of the nuclear spin to the electronic angular momentum in the a1g state has been derived for the three studied
1 2 3 4 5 6 7 8 9 10 11 12 13 14 15 16 17 18 19 20 21 22 23 24 25 26 27 28 29 30 31 32 33 34 35 36 37 38 39 40 41 42 43 44 45 46 47 48 49 50 51 52 53 54 55 56 57 58 59 60 1. Introduction
Recent CRDS experiments carried out at the Grenoble University have allowed significant improvement of our knowledge of the spectral line parameters of the a1g - X 3Σg
−
band of oxygen. In Ref [1], the electric quadrupole line parameters were found to have sufficient intensities to be detected in the atmospheric spectrum and they were parameterized to complement magnetic dipole transitions provided in HITRAN database [2]. In Ref. [3], the measurements in 16O- and 18O- enriched mixtures of oxygen have allowed determination of the best to date spectroscopic constants in the a1g band for five most abundant isotopologues of
oxygen (16O2, 16O18O, 18O2, 16O17O and 17O18O). For the 17O-containing species significant
broadening of rotational lines due to unresolved hyperfine structure was observed [3].
Indeed, unlike other isotopes of oxygen 17O has a non-zero nuclear spin (I= 5/2) and the coupling of the nuclear spin to electron spin in the X 3Σg
−
state [3] and to the electronic angular momentum in the a1g state [4] gives rise to a magnetic hyperfine (hf) structure. As a result of
the Doppler broadening at room temperature, the magnetic hyperfine structure could not be resolved and it manifested itself only as a broadening of the 16O17O and 17O18O transitions.
The present study is devoted to a detailed experimental investigation of the hf structure of the 17O containing isotopologues of oxygen, on the basis of new CRDS spectra of the a1g - X 3Σ
g −
band recorded at room temperature and at liquid nitrogen temperature (about 80 K, see below). By using a 17O-enriched sample, the 16O17O, 17O18O and 17O2 isotopologues could be
simultaneously studied. As illustrated below, the narrowing by a factor of two of the Doppler width at 80 K compared to room temperature was decisive to (partly) resolve and interpret the hf structure.
After the description of the CRDS spectrometer in the next section, the obtained spectra and the analysis of the hf structure will be presented in Section 3. The coupling parameters will be determined and compared to the values available in the literature [4].
.
2. Experimental
Room temperature measurements
The high-sensitivity CW-CRDS absorption spectrum of the a1g - X 3Σg −
band was recorded
3 4 5 6 7 8 9 10 11 12 13 14 15 16 17 18 19 20 21 22 23 24 25 26 27 28 29 30 31 32 33 34 35 36 37 38 39 40 41 42 43 44 45 46 47 48 49 50 51 52 53 54 55 56 57 58 59 60 61
atomic composition of the sample (from Sigma Aldrich) was 17O: 55.8%, 16O: 43.4% and 18O: 0.8 %.
The fibered distributed feedback (DFB) laser CW-CRDS spectrometer used for the recordings at room temperature is the same as the one used for the study of the natural and 18 O-enriched samples [1, 3]. It has been described in details in Refs. [6-8]. Each DFB laser diode has a typical tuning range of about 40 cm-1 by temperature tuning from -10°C to 60°C. A total of nine DFB laser diodes were needed to cover the 7658-7917 cm-1 region. The electro-polished stainless steel ring down cell (l = 1.42 m, inner diameter = 11 mm) was fitted by a pair of super-mirrors. The reflectivity of these mirrors (about 99.997 %) corresponds to empty cell ring down times of about ~ 200 s. About 40 ring down events were averaged for each spectral data point; the complete temperature scan of one DFB laser (15000 spectral points) required about 70 minutes. The achieved noise equivalent absorption was about min~ 4×10-11 cm-1 over the whole spectrum.
The pressure measured by a capacitance gauge (MKS 100 Torr full range with 0.1% accuracy) and the ring down cell temperature were monitored during the recordings. The pressure value of the RT spectra was fixed to 30.0 Torr. Additional recordings were performed at 5 Torr in the 7839-7917 cm-1 region corresponding to the strongest transitions.
Measurements at low temperature
The cryogenic cell used for the CW-CRDS recordings at liquid nitrogen temperature (LNT) has been described in Refs. [9-12]. It was developed and extensively used to characterize the absorption spectrum of methane at low temperature in the 1.58 and 1.28 m methane transparency windows [9-12]. Briefly, it is based on an original design (see Fig. 1 of Ref. [9]) which dispenses with an external vacuum jacket by exploiting the fact that a low pressure gas sample constitutes itself a good thermal insulation. The cryostat is a 1.42 m long hollow cylinder both filled and completely surrounded by the sample gas volume. The liquid nitrogen filling tube constitutes its single suspension point which, combined with an almost perfect cylindrical geometry helps to eliminate stress normally present in a double-jacket cell configuration. Contrary to our previous setup [9], one of the mirrors was prealigned then glued on a piezo actuator allowing for cavity length modulation. Therefore a standard CW-CRDS data acquisition could be used with a spectral calibration fully relying on the wavemeter real time measurements. The distance between the high reflective mirrors and the cryostat ends is about 0.5 cm. A sensitivity comparable to that achieved at room temperature (min ~ 10-10 cm-1) was obtained.
1 2 3 4 5 6 7 8 9 10 11 12 13 14 15 16 17 18 19 20 21 22 23 24 25 26 27 28 29 30 31 32 33 34 35 36 37 38 39 40 41 42 43 44 45 46 47 48 49 50 51 52 53 54 55 56 57 58 59 60
Coinciding temperature values (80±2 K) were obtained from the Doppler profile of methane absorption lines [9,10] and the rotational intensity distribution of the 32 band of CH3D [12]. This
value of 80±2 K is what we refer to as “liquid nitrogen temperature” (LNT).
The LNT spectrum was recorded in the 7876-7893 cm-1 region corresponding to the low rotational transitions which exhibit the most resolved hyperfine structures of the 17O containing isotopologues. The pressure value was fixed to 1.5 Torr.
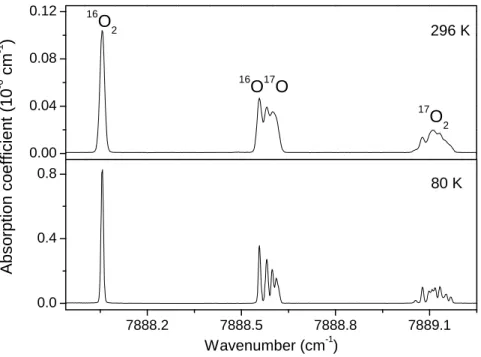
Fig. 1 shows the different line profiles obtained for the R1R1 transitions of the 16O2, 16O17O
and 17O2 isotopologues (Note that we use NN"JJ" notation where N and J are the quantum
numbers relative to the rotational angular momentum and total angular momentum, respectively). While the 16O2 line appears as single line with a Doppler limited profile, the 16O17O and 17O2
lines are split in different hf components. The comparison between the 296 K and 80 K spectra (Fig.1) illustrates the much better resolution of the hf structure at 80 K due to the reduction by a factor of two of the Doppler broadening (HWHM of 0.008 and 0.004 cm-1 at 296 K and 80 K, respectively).
Spectrum calibration
Each 40 cm-1 wide spectrum recorded with one DFB laser was calibrated independently on the basis of the wavelength values provided by a Michelson-type wavemeter (Bristol 621A, 60 MHz resolution and 100 MHz accuracy). The calibration was further refined by stretching the whole spectrum in order to match accurate positions of the transitions of the a1g - X 3Σg
−
band of
16
O2 provided in the recent HITRAN update [2]. The uncertainty in the absolute values of the
line positions is estimated to be 1×10⁻³ cm-1. It results from an equivalent contribution of the uncertainties in the HITRAN values and in the values measured in the present study.
3. Results
Transitions due to the 17O2, 16O17O, 16O2, 17O18O and 16O18O isotopologues were found to
contribute to the spectrum. The most abundant species are 17O2, 16O17O and 16O2 with relative
concentration on the order of 0.33, 0.47 and 0.18, respectively. Overall, more than one thousand transitions were measured in the RT spectrum. The global rovibrational analysis including the complete line list, description of the assignment procedure and derivation of the spectroscopic parameters from a global fit will be published in a separate contribution. In the present Letter, we limit the discussion to the hf structure of the 17O2, 16O17O and 17O18O species.
3 4 5 6 7 8 9 10 11 12 13 14 15 16 17 18 19 20 21 22 23 24 25 26 27 28 29 30 31 32 33 34 35 36 37 38 39 40 41 42 43 44 45 46 47 48 49 50 51 52 53 54 55 56 57 58 59 60 61
While 16O and 18O nuclei have a I= 0 nuclear spin, 17O has a I= 5/2 spin leading to the existence of an hyperfine structure in the 17O containing species. The hf structure affecting the X
3Σ g −
ground state of 17O2, 16O17O and 17O18O was previously reported from microwave and
millimeter spectroscopy measurements [5, 13-16]. The observation of the ground state hyperfine structure by absorption spectroscopy in the near infrared or visible is particularly difficult as the Doppler width is significantly larger than the hf splitting. Very recently, Long et al. [14] could measure the ground hyperfine structure from an excess of the broadening of some transitions of the b1g+- X 3Σg
−
band near 760 nm. The sub Doppler hyperfine structure could be evidenced from a detailed study of the line profile recorded by Frequency-stabilized CRDS [14]. It is important to note that the evidenced extra broadening of the b1g
+
- X 3Σg −
band transitions is due to the ground state hf structure as the b1g+ upper electronic state is a singlet state with
negligible hf structure. In the present study devoted to the a1g - X 3Σg −
band, the situation is different because the nuclear spin can couple to the electronic angular momentum of the a1g
upper state. Our spectra (Fig. 1 for instance) show that the observed hf splitting is significantly larger than the Doppler broadening and then that the hf structure of the a1g upper state is larger
than that of the ground state. This is consistent with earlier results of electron paramagnetic resonance (EPR) measurements of 16O17O and 17O18O species in the a1g state [4].
The general expression of the hyperfine structure Hamiltonian can be written as
) 1 2 ( 4 ) 3 ( e 3 1 z 2 2 z
)
(
q I I z F z z hfa
b
c
I IS
I
S
I
S
I
L
I
H
Q , (1)where the first term describes the interaction of the electronic orbital moment with the nuclear spin, the second and third terms represent the isotropic (Fermi contact interaction) and anisotropic parts of the electron spin-nuclear spin coupling, respectively. The forth term represents the electric quadrupole interaction due to asymmetric charge distribution around the nucleus.
In the X 3Σg −
ground state, Λ= 0 and therefore the first term vanishes. The two other magnetic terms lead to an hf splitting of each (N, J) rotational level in different components:
} 3) (2 2 { 1) ( N N c b N ) W(F1 F IJ ) 3 2 ( 1) (N b c N ) W(F2 F IJ
1 2 3 4 5 6 7 8 9 10 11 12 13 14 15 16 17 18 19 20 21 22 23 24 25 26 27 28 29 30 31 32 33 34 35 36 37 38 39 40 41 42 43 44 45 46 47 48 49 50 51 52 53 54 55 56 57 58 59 60 } 1 -2 2 2 { N N c -b N ) W(F3 F IJ , (2)
where IJ= 1/2[F(F+1)-I(I+1)-J(J+1)] with F= J+I, J+I-1, ...|J-I| and F1, F2 and F3:
corresponds to J=N+1, J=N and J=N-1, respectively. Note that Eq. 2 ignores small contribution due to quadrupole coupling.
In the case of the 16O17O and 17O18O species, I= 5/2 and then F= J±5/2, J±3/2 and J±1/2. The rotational levels are then split into six components for J>2.
In the case of the 17O2 isotopologue, the vectorial addition of the two nuclear spins
(I1=I2=5/2) leads to six values of the total nuclear spin Itot= I1+I2,...|I1-I2|= 5, 4, 3, 2, 1, 0. In the X 3Σ
g −
ground state because of the nuclear spin function symmetry, the even and odd values of N" can only be associated with odd and even values of Itot", respectively [13]. Thus each J" level is
split into F= J+Itot, J+Itot-1, ...|J-Itot| components with Itot=5, 3, 1 for even N" values and with
Itot=4, 2, 0 for odd N" values. For instance, for N=1 the number of components is seven, while
for N=2 the level splits into 13 components.
The a1g upper state is a singlet state (S=0), so that only the first and fourth interaction
terms remain in Eq. 1. This a1g state obeys the Hund’s electronic case (a) coupling and the
dominant magnetic part of the hyperfine operator simplifies to yield the hyperfine energy [17]:
W= a ΛΩ IJ / J(J+1). (3)
with =Σ, which in this case is equal to= 2. From this expression, it is obvious that the hyperfine component separations decrease with increasing J values i.e. that, in the different branches, transitions from the first rotational levels are expected to show the most resolved hf structure. As an example, Figs. 2 and 3 illustrate the evolution of the hf structure with an increasing rotational excitation for 16O17O and 17O2, respectively: the hf structure is partly
resolved for the first N, J rotational levels but shows up as a small extra broadening for N, J values larger than 10. It is worth mentioning that Λ-doubling could not be resolved in this experiment.
The selection rules for 16O17O, 17O18O and 17O2 magnetic dipole transitions are ΔJ=0, ±1
and ΔF =0, ±1. For the high J values, only the hyperfine transitions with ΔJ= ΔF are significant and the intensity of these transitions are proportional to (2F+1) [18]. Fig. 4 shows the energy diagram and allowed transitions of the R1R1 line together with the corresponding experimental
3 4 5 6 7 8 9 10 11 12 13 14 15 16 17 18 19 20 21 22 23 24 25 26 27 28 29 30 31 32 33 34 35 36 37 38 39 40 41 42 43 44 45 46 47 48 49 50 51 52 53 54 55 56 57 58 59 60 61
spectra of 16O17O and 17O18O. The hf coupling terms being identical for these two species, the observed hf structures are very similar.
The values of the hf coupling parameters were determined from a global fit of all the transitions measured in this work together with the microwave (MW) lines from Cazzoli et al. [5, 13]by using the SPFIT software [19]. The expression of the rotational part of the Hamiltonians in the ground and excited electronic states is given in Ref. [3] (Eqs. 1 and 2). A detailed description of the fit including the weighting of the wavenumbers values of the hf components, the combination of RT and LNT datasets, the constraints of the fits of the spectroscopic parameters and comparisons with previously reported values will be detailed in a separate contribution [20]. In this Letter, we focus on the obtained hf coupling constants which are listed in Table 1 for both the ground and a1g upper states. Note that we have tried to fit the
quadrupole coupling constant of the a1g (last term of Eq. 1) but it could not be well determined.
The corresponding constant in the ground state of 16O17O and 17O18O is about -8 MHz and according to the calculations of Minaev and Minaeva [21] it should be similar in the excited state and then too small to be determined from our spectra.
To the best of our knowledge, the only previous determination of the hf coupling constant in the a1 state is due to Arrington et al. [4] who obtained the a value of 16O17O and 17O18O from a fit of EPR spectra [4]. Since in theory there is no isotopic dependence for this parameter, they performed a global fit for the two species and determined the coupling constant to be -4241 MHz which is almost exactly a factor of two greater than our values (-215.62.3 and -212.43.5 MHz, for 16O17O and 17O18O, respectively). This difference is merely due to the different definition of the coupling constant adopted by Arrington et al. [4], the value of Λ (Λ =2 in this case) being absorbed into the constant. The hf coupling parameter of 17O2 could be also
determined from the analysis of our LNT spectrum. As expected, the obtained value is very close to that of the 16O17O and 17O18O isotopologues.
We have superimposed to the spectra of Figs. 2 and 3 a simulation of the hf structure calculated with the fitted parameters values. The simulated spectra were obtained by affecting a Doppler limited line profile (at 80 K) to the stick spectrum provided by the SPFIT program. It leads to a very convincing agreement between the measured and calculated spectra.
1 2 3 4 5 6 7 8 9 10 11 12 13 14 15 16 17 18 19 20 21 22 23 24 25 26 27 28 29 30 31 32 33 34 35 36 37 38 39 40 41 42 43 44 45 46 47 48 49 50 51 52 53 54 55 56 57 58 59 60 4. Conclusion
The combination of the high sensitivity CRDS technique with a cryogenic cell at 80 K has allowed for the first observation of the partly resolved hyperfine structure of the a1g-X 3Σg
−
band
of the three 17O containing isotopologues of oxygen - 16O17O, 17O18O and 17O2. The observed
structure results from the hf splittings of both the X 3Σg −
ground state and the a1g upper state
which have a different origin: the hf splitting of the X 3Σg −
levels is due to the coupling of the 17O nuclear spin to the electronic spin while that of the a1g upper states is larger and results from
the coupling of the 17O nuclear spin to the electronic orbital angular momentum. The hf coupling parameters in the excited state have been determined from a global fit of the line positions. The simulation of the hf structure calculated using these parameters leads to a very satisfactory reproduction of the measured hf structure.
Acknowledgments
Part of this work was performed at Grenoble University under the ANR project “IDEO” (NT09_436466). A portion of this research was performed at Jet Propulsion Laboratory, California Institute of Technology, under contract with the National Aeronautics and Space Administration.
3 4 5 6 7 8 9 10 11 12 13 14 15 16 17 18 19 20 21 22 23 24 25 26 27 28 29 30 31 32 33 34 35 36 37 38 39 40 41 42 43 44 45 46 47 48 49 50 51 52 53 54 55 56 57 58 59 60 61 References
[1] I.E. Gordon, S. Kassi, A. Campargue, G. C. Toon J. Quant. Spectrosc. Radiat. Transfer 111 (2010) 1174.
[2] L.S. Rothman, I.E. Gordon, A. Barbe, D.C. Benner, P.F. Bernath, M. Birk et al., J. Quant. Spectrosc. Radiat. Transfer 110 (2009) 533.
[3] O. Leshchishina, S.Kassi, I.E. Gordon, L. S. Rothman, L. Wang, A. Campargue, J. Quant. Spectrosc. Radiat. Transfer 111 (2010) 2236.
[4] C. A. Arrington, A. M. Falick, R. J. Myers, J. Chem. Phys. 55, (1971) 909.
[5] G. Cazzoli, C D. Esposti, PG Favero, G Severi., Nuovo Cimento B 62 (1981) 243.
[6] P. Macko, D. Romanini, S.N. Mikhailenko, O.V. Naumenko, S. Kassi, A. Jenouvrier, et al., J. Mol. Spectrosc. 227 (2004) 90.
[7] J. Morville, D. Romanini, A.A. Kachanov, M. Chenevier, Appl. Phys. B 78 (2004) 465.
[8] B.V. Perevalov, S. Kassi, D. Romanini, V.I. Perevalov, S.A. Tashkun, A. Campargue, J. Mol. Spectrosc. 238 (2006) 241.
[9] S. Kassi, B. Gao, D. Romanini, A. Campargue, Phys. Chem. Chem. Phys. 10 (2008) 4410. [10] S. Kassi, D. Romanini, A. Campargue, Chem. Phys. Lett. 477 (2009) 17.
[11] L. Wang, S. Kassi, A. Liu, S. Hu, A. Campargue, J. Quant. Spectrosc. Radiat. Transfer submitted
[12] L. Wang, S. Kassi, A. Liu, S. Hu, A.Campargue, J. Mol. Spectrosc. 261 (2010) 41. [13] G Cazzoli, C D. Esposti, B. M. Landsberg, Nuovo Cimento D 3 (1984) 341.
[14] D. A. Long, D. K. Havey, M. Okumura, C. E. Miller, J. T. Hodges, Phys. Rev. 81 (2010) 064502.
[15] S. L. Miller and C. H. Townes, Phys. Rev. 90 (1953) 537. [16] P. Gerber, Helv. Phys. Acta 45 (1972) 655.
[17] R.A. Frosch, H.M. Foley, Phys. Rev. 88 (1952) 1337.
[18] C. H. Townes and A. K. Schawlow, Microwave Spectroscopy (Dover, New York, 1975). [19] Pickett HM, J Mol. Spectrosc. 148 (1991) 371.
[20] O. Leshchishina, S. Kassi, I.E. Gordon, S. Yu, A. Campargue J. Quant. Spectrosc. Radiat. Transfer, submitted
1 2 3 4 5 6 7 8 9 10 11 12 13 14 15 16 17 18 19 20 21 22 23 24 25 26 27 28 29 30 31 32 33 34 35 36 37 38 39 40 41 42 43 44 45 46 47 48 49 50 51 52 53 54 55 56 57 58 59 60 Table 1.
The hf coupling parameters of the X 3Σg −
and a1g states of 16O17O, 17O18Oand 17O2 .
a) In Ref [4], there is a factor of 2 in the a parameter due to a different definition.
Parameter (MHz) 16O17O 17O18O 17O2 a1g a (This work) -217.33(195) -211.50(261) -211.93(126) a [4] -424(1)a -424(1)a 3Σ g − bF -54.7444(92) -54.745(21) -54.758(23) c 140.079(24) 140.090(59) 140.0378(62) eQq -8.13(24) -8.23(47) -8.307(40)
3 4 5 6 7 8 9 10 11 12 13 14 15 16 17 18 19 20 21 22 23 24 25 26 27 28 29 30 31 32 33 34 35 36 37 38 39 40 41 42 43 44 45 46 47 48 49 50 51 52 53 54 55 56 57 58 59 60 61 Figure Captions Fig.1
The R1R1 transition of 16O2, 16O17O and 17O2 at 296 K and 80 K. Spectra recorded at the room
(P= 5.0 Torr) and liquid nitrogen temperature (P=1.5 Torr) are shown on the upper and lower panel, respectively.
Fig. 2
The hyperfine structure of different 16O17O transitions (T=80 K, P=1.5 Torr). The wavenumber values (ν0) corresponding to the centre of the spectral range of each panel are the following:
R1R1 - 7888.5906, R2R2 - 7891.2606, R1Q2 - 7890.4704, Q6Q6 - 7882.3106 and Q13Q13 - 7879.6066 cm-1.
The black solid line corresponds to the experimental spectrum while the red dash line is a simulation based on the calculated stick spectrum (in blue).
Fig. 3
The hyperfine structure of different 17O2 transitions (T=80 K, P=1.5 Torr). The wavenumber
values (ν0) corresponding to the centre of the spectral range for each panel are the following:
R1R1 – 7889.1152, R2R2 7891.7151, Q8R7 - 7884.4304 and Q13Q13 - 7880.4153 cm-1. On the two upper panels the features at the left hand side are 16O18O transitions.
The black solid line corresponds to the experimental spectrum while the red dash line is a simulation based on the calculated stick spectrum (in blue).
Fig. 4
Energy diagram and spectrum of the hyperfine structure of the R1R1 transition of 16O17O and
17
O18O in the spectrum recorded at 80 K. Note that the -doubling is unresolved in the present experiment. The stick spectrum corresponds to the calculated hf structure.
Figure 1 7888.2 7888.5 7888.8 7889.1 0.0 0.4 0.8 A b s o rp ti o n c o e ffi c ie n t (1 0 -6 cm -1 ) Wavenumber (cm-1) 296 K 0.00 0.04 0.08 0.12 16 O 2 17 O 2 16 O17O 80 K Figure
0.0 0.2
Wavenumber (cm
-1)
Ab
so
rp
tio
n
co
e
ffi
ci
e
n
t (
1
0
-6cm
-1)
Q6Q6
0.00 0.02 ν0 -0.05 +0.05 0.0 0.2 0.0 0.2R1R1
Q13Q13
0.00 0.04 0.08R2R2
R1Q2
Figure 3
0.00
0.01
0.02
Wavenumber (cm
-1)
A
bs
orpt
ion c
oef
fi
c
ient
(10
-6cm
-1)
ν
0+0.075
-0.075
Q13Q13
0.00
0.02
0.0
0.1
R2R2
0.0
0.1
R1R1
Q8R7
0.0 0.1 0.2 0.3 7888.55 7888.60 7888.65 7889.55 7889.60 7889.65 0.000 0.002 0.004 0.006 Wavenumber (cm-1) Absor p ti on coef fi cient (10 -6 cm -1 ) 16