SUPPLEMENTARY MATERIAL
Single exposure to aerosolized graphene oxide and graphene nanoplatelets did not initiate biological response in a 3D human lung model.
Barbara Drasler1, Melanie Kucki2, Flavien Delhaes1, Tina Buerki-Thurnherr2, Dimitri Vanhecke1, Daria Korejwo2, Savvina Chortarea2, Hana Barosova1, Cordula Hirsch2, Alke Petri-Fink1, Barbara Rothen-Rutishauser1, Peter Wick2
1. METHODS
1.1 Estimation of surface coverage by aerosolized GO and GNP
The surface coverage by aerosolized graphene oxide (GO) and graphene nanoplatelets (GNP) was assessed on automatically and randomly captured transmission electron microscopy (TEM) images followed by a quantification step.
1.1.1 Acquisition
The material of each exposure group was aerosolized on three TEM grids (i.e. n=3), and from each TEM grid 25 micrographs were taken in a systematic random uniform random sampling procedure (SURS).
The grids are placed manually in the TEM sample holder, then inserted into the microscope and the following script is started:
// Distance 20 means that the stage shift between adjacent images will be 20 micrometer Distance = 20
// Steps 5 means an image array of 5 x 5 (or 25 positions) will be recorded Steps = 5
// Information of where and how to save the data SetDirectory D:\Data\Tomography
BatchSetNewFileType 1 OpenNewFile
TomographyTilts.mrc
//Initialization, including homing of the holder to the goniometer 0,0 position (thereby setting the first random position)
Xsteps = $Steps Ysteps = $Steps Yback = 0 Counter = 0 Xstart = $Xsteps - 1 Xstart = $Xstart / 2
Xstart = -1 * $Xstart * $Distance Ystart = $Ysteps - 1
Ystart = $Ystart / 2
Ystart = -1 * $Ystart * $Distance MoveStageTo 0 0
MoveStage $Xstart $Ystart Totalimage = $Steps * $Steps
// Meandering through the 5 x 5 positional array in a systematic and uniform procedure
Loop $Ysteps Loop $Xsteps G 1 NormalizeLenses 7 P S A Counter = $Counter + 1 MoveStage $Distance 0 EndLoop
Xback = $Xsteps * $Distance * -1 Yback = $Yback + $Distance MoveStage $Xback $Distance EndLoop
CloseFile
The result of the automated acquisition are 25 images, recorded from 5 rows and 5 columns. Randomness is assured due to the manual insertion of the grid into the holder.
1.1.2 Quantification
A high degree of heterogeneity characterizes the images. Overlaying layers of GO and GNP, dense salt crystals and other debris originating from the aerosolization process render the use of computer vison algorithms impossible without introducing bias. The remaining option is to revert to manual interpretation. Using Cavalieri point counting probes [1], the task of estimating the deposited surfaces is efficient without sacrificing accuracy. In short: an ordered grid of crosses is placed randomly over each image and the number of crosses falling on a region of interest (GO or GNP) are counted as interpreted by the experimenter. The sum of these number of crosses over all 25 images yields, when multiplied with the area associated with each cross, the estimated of the area of GO, respective GNP, deposition for one TEM grid. Using the size of the recorded images, the absolute area can be normalized and compared.
An example is given in Figure S1 (GNP, low dose). On the left is one image from a stack of 25 systematic uniform random sampled images, overlaid with crosses (magenta). The distance between two crosses is 33.3nm, both in the horizontal and in the vertical direction. Hence, each cross is associated with an area of 0.1µm2 (33.332 nm2). The entire micrograph is covered with 961 crosses (31 x 31) and is hence 961 crosses x 0.1 µm2 per cross, or 96.1µm2 in area. As shown in the middle of Figure 1S, three objects are recognized (green crosses): two GNP with a number of overlapping layers (near the bottom left). Combined, 30 green crosses
overlap with these two objects. A third, small object with one green cross associated is interpreted as a salt crystal and not included in the count. Therefore, a total of 30 crosses, or 3.0 µm2 (number of crosses multiplied with the area per cross, 0.1 µm2) of GNP was
deposited onto this particular site. Normalizing for this micrograph, the calculated surface coverage was 3.12 % (3.0 µm2 / 96.1 µm2). Note that the precision is provided by the pixel size and not by the crosses grid: in Figure S1 right, a larger magnification of the largest object, the magenta cross is not included in the count because it does not overlap with the object. The distance to the object is less than a nanometer.
Fig. S1: An example of TEM image (1/25; one replicate out of three) for aerosolized GNP at the low dose range.
Pink crosses correspond to 0.1 µm2 size, 32 crosses covered by GNP were counted which yielded the total of 3.2 µm2 of the covered surface. Normalized to the total area of the micrograph (4096 pixel x 4096 pixel; 9.92 µm x 9.92 µm = 98.41 µm2), the calculated surface coverage by GNP is 0.033%.
This analysis was repeated for all 25 images and for all three replicates. In order to minimize interpreter bias, the analysis was performed in duplicate by two involved researchers independently. Both interpreters matched each other results closely.
1.2 Endotoxin detection
Endotoxin detection was performed by two different methods: a) Limulus amebocyte lysate (LAL) Gel Clot Assay (Pyrogent™ Plus, Ref. No. N294-03, Lonza, Walkersville, USA), and b) Endosafe®PTS (Charles River Laboratories, Charleston, USA). All tests were performed in presence of the test materials and not with supernatants only. GO was dispersed in LAL reagent water (Lonza, Ref. No. W50-500, endotoxin value < 0.005 EU/mL, Lonza) to a stock concentration of 1 mg GO/mL. GNP and CB were dispersed in 160 ppm Pluronic F-127 in MilliporeQ water (endotoxin value <0.01EU/mL) to stock dispersions of 1mg GNP or CB/mL, respectively, and further diluted in a two-fold dilution series in LAL reagent water. The LAL Gel Clot Assay was performed as described in [Kucki et al. http://nanopartikel.info/files/methodik/SOPs_aus_Projekten/NanoKon_SOP-2-2-2.pdf].
Labelled assay sensitivity (0.03EU/mL) was confirmed for all individual test kits applied. LAL Reagent water served as negative control. Control standard endotoxin (CSE) from Escherichia coli (E. coli) O55:B5 (Lonza; part of PyrogentPlus™) was applied as positive product control (PPC). Each material sample was screened for potential endotoxin contamination with two independent two-fold dilution series. Endosafe®PTS Assay was performed with an Endosafe® PTS portable test system (PTS100, Charles River Laboratories; temperature control 37 ± 1°C; photo detectors at 395nm wavelength) and Endosafe®PTS Cartridges (Ref. No. PTS5501F, Charles River Laboratories, Charleston, USA; assay sensitivity 0.01EU/mL) according to the manufacturer’s instructions. Each cartridge consists of two sample replicate channels as well as two replicate channels with internal endotoxin spike to control for assay enhancement or inhibition. Test results were considered as valid only when all acceptance criteria given by the manufacturer were fulfilled (sample coefficient variation and spike coefficient variation < 25%, spike recovery 50-200%). All tests were performed with cartridges of identical cartridge lot, therefore inter-cartridge lot variations of the results can be excluded. When necessary, samples were tested for potential Glucan interference by application of two different Glucan Blocker (β-G Blocker, Part. No. B50-700, Lonza, Walkersville, USA or Endosafe® endotoxin-specific buffer, product code BG120, Charles River Laboratories, Charleston, USA).
1.3 Triple cell co-culture model of the alveolar epithelial barrier
A549 cells were cultivated in Roswell Park Memorial Institute (RPMI) 1640 cell culture
medium supplemented with 10% FBS (source), 1% L-glutamine, and 1%
penicillin/streptomycin (all v/v; referred as complete cell culture medium, cRPMI). Cells were subcultured biweekly via trypsinization (0.05% Trypsin-EDTA). A549 cells were seeded in PET membrane inserts for 12-well plates (BD FalconTM Cell Culture Inserts, pores with 3μm diameter, 8 x 10⁵ pores/cm2, surface area of 0.9 cm2,BD Biosciences, USA) at a density of 25·104 cells/cm2 (eq. 54·104 cells/mL in 0.5 mL of RPMI; upper compartment) and placed in 12-well tissue culture plates (BD Falcon, BD Biosciences, USA) containing 1.5 mL cRPMI in the lower compartment. The cells were maintained for 4d and cell culture medium was refreshed in both the compartments 24h after seeding. Monocytes were isolated from buffy coats provided by the Transfusion Blood Bank (Blutspendedienst SRK Bern AG, Switzerland) as described by [2] with the adaptation of using CD14 magnetic beads (MicroBeads, Miltenyi Biotec, Germany) for monocyte isolation in order to increase the purity of the isolated monocytes. The primary monocytes were differentiated into MDDC by
stimulation with the granulocyte macrophage-colony stimulating factor (GM-CSF, Miltenyi Biotec, Germany) and interleukin (IL)-4, both simultaneously at concentrations of 10 ng/mL in cRPMI for 6d. On day 5 after epithelial cells had been seeded on the membranes, the basal sides of the insert membranes were gently abraded with a cell scrapper. The differentiated MDDC cells were scrapped from the wells, aspirated and seeded at the cell density of 59·104/cm2 on the basal side of the membranes (upturned inserts; 0.065 mL of 84·104cells/mL). MDDCs were left to attach (70 min, humidified atmosphere, 37°C, 5% CO2)
and placed afterwards in 12-well plates containing fresh cRPMI (1.5 mL). The differentiated MDM (macrophage colony stimulating factor (M-CSF, Miltenyi Biotec, Germany), 10 ng/mL in cRPMI, 6 days) were seeded at the density of 1.4·104/cm2 (eq. 2.5·104 cells/cm2 in 0.5 mL cRPMI per membrane insert). After 24h incubation, the air-liquid interface (ALI) conditions were created by removing the medium in both the compartments and replacing with 0.6 mL of fresh cRPMI only in the bottom part of the system for additional 24h (detailed description provided in: [2]).
1.4 ELISA interference assays
Interference with nanomaterials can occur at different steps throughout an ELISA assay procedure (see figure S2 A). Therefore different questions were considered and experimentally implemented in a panel of controls. (1.) Nanomaterials could have an intrinsic catalytic activity and process the substrate by themselves therewith leading to false-positive assay results. The nanomaterial interaction with the substrate was analysed in the absence as well as presence of the specific antigen. Therefore nanomaterials were spiked-in together with the substrate (TMB) in the final step of the ELISA procedure (Figure S2 B1). (2.) Nanomaterials might change the optical density (OD) and thereby artificially increase the signal intensity (false-positive results). This aspect of interference was addressed by spiking nanomaterials into the last step of the ELISA procedure in the absence of substrate (Figure S2 B2) (3.) Nanomaterials could potentially bind to the antibodies, substituting for a (missing) antigen. This would again lead to false-positive assay results and is addressed by spiking-in nanomaterials instead of the antigen during the sample incubation step (Figure S2 B3). (4.) Similarly, nanomaterials could bind to the antigen of interest. This interaction could theoretically result in two different outcomes: i) enhanced binding of the antigen to the antibodies leading to false-positive results or ii) the masking of relevant epitopes and therewith a reduction in antigen-antibody binding and consequently false-negative results.
The assay was performed according to the Standard Operating Procedures of the DaNa project [3].
Fig. S2: “sandwich” ELISA principle (A) with different interference possibilities (B). (1.) Nanomaterial interaction with substrate, (2.) Nanomaterial interaction with OD, (3.) Nanomaterial interaction with antibody, (4.) Nanomaterial interaction with antigen.[3]
2. RESULTS
Table S1: Deposited masses (nm/cm2) of the aerosolized GO and GNP assessed by the quartz crystal microbalance (QCM) online monitoring system. Input material (µg/mL) GO 250 GO 1000 GNP 250 GNP 1000 Average deposition (nm/cm2) 289.69 933.73 324.93 876.37 Min. deposition (nm/cm2) 143.17 843.03 153.49 647.11 Max. deposition (nm/cm2) 436.21 1024.43 496.37 1105.63 StDEV (min. vs. max.) 146.52 90.70 171.44 229.26 Range (nm/cm2) Nomenclature used 150 to 430 Low range 840 to 1020 High range 150 to 500 Low range 650 to 1100 High range
Abbreviations: GO, graphene oxide; GNP, graphene nanoplatelets; min. and max. depositions: minimum and maximum values of deposited masses assessed by the online monitoring quartz crystal microbalance system.
Fig. S3: Scanning electron micrographs of aerosolized GO and GNP and of CB in dispersion. Upper panel: GO at the low (a, b; 150 to 430 ng/cm2) and high (c, d; 840 to 1020 ng/cm2) ranges of deposited masses; middle panel: GNP at the low (e, f; 150 to 500 ng/cm2) and high (g, h; 650 to 1100 ng/cm2) ranges of deposited masses; lower panel: CB in dispersions at the low (i, j; 300 ng/cm2) and high (k, l; 1000 ng/cm2) doses.
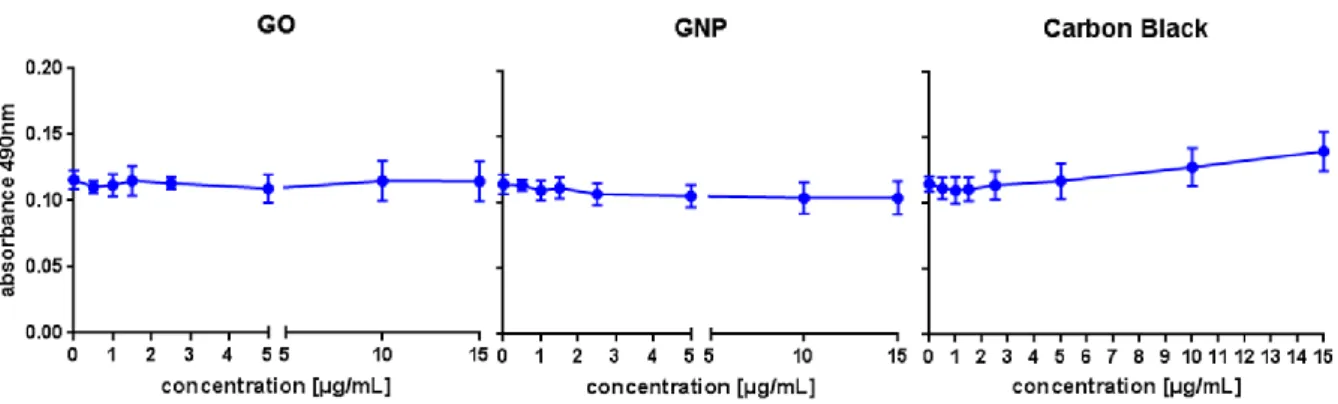
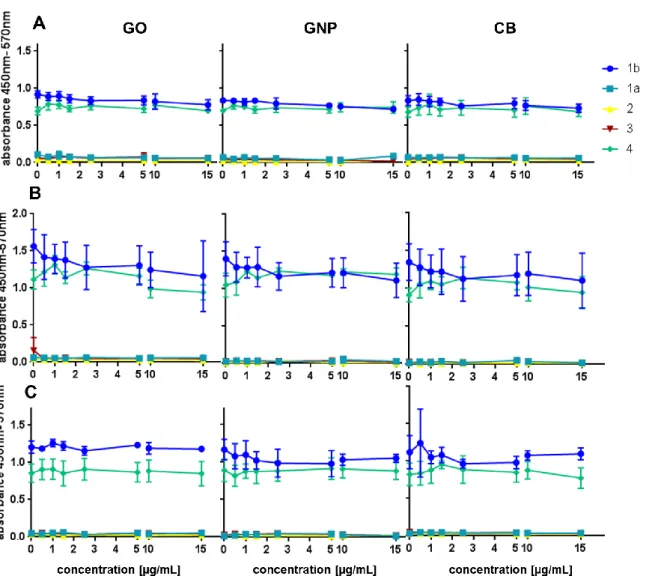
Fig. S5: ELISA interference assays for GO, GNP and CB. (A) IL1β, (B) IL8 and (C) TNFα interference measurements. Labelling applies to all graphs, first column shows GO, middle column GNP and third column CB
The OD measured under conditions 1a, 1b, 2, 3, 4 as described in section 1.4 did not change with higher concentrations of nanomaterials which indicates no intrinsic catalytic activity (1a,b), no OD generation by the material (2) and no binding to the antibody (3) or antigen (4) (Fig. S5.) Consequently, no interference of the nanomaterials was observed with either, IL1β, IL8 or TNFα ELISAs at relevant concentrations from 0 - 15 µg/ml. It should be noted that at conditions 1a, 2 and 3 no antigen was added at the sample application step, thus the OD values were according to expectations very low. In contrast, at conditions 1b and 4 the recombinant antigen was applied at the highest recommended concentration as specified by the manufacturer for the standard curve of the respective antigen.
References
[1.]Howard CV, Reed MG. Three Dimensional Measurement in Microscopy. Unbiased Stereology. Liverpool, U.K.: QTP Publications; 2010.
[2.]Lehmann A, Brandenberger C, Blank F, Gehr P, Rothen-Rutishauser B. A 3D model of the human epithelial airway barrer. In: Maguire T, Novik E, editors. Methods in Bioengineering Alternative Technologies to Animal Testing. Boston, London: Artech House; 2010. p. 239-60.