HAL Id: hal-00739548
https://hal.archives-ouvertes.fr/hal-00739548
Submitted on 25 Jan 2021HAL is a multi-disciplinary open access archive for the deposit and dissemination of sci-entific research documents, whether they are pub-lished or not. The documents may come from teaching and research institutions in France or abroad, or from public or private research centers.
L’archive ouverte pluridisciplinaire HAL, est destinée au dépôt et à la diffusion de documents scientifiques de niveau recherche, publiés ou non, émanant des établissements d’enseignement et de recherche français ou étrangers, des laboratoires publics ou privés.
Role of the alumina surface properties on the ammonia
production during the NOx SCR with ethanol over
Ag/Al2O3 catalysts
Fabien Can, Aurelien Flura, Xavier Courtois, Sebastien Royer, Gilbert
Blanchard, Patrice Marecot, Daniel Duprez
To cite this version:
Fabien Can, Aurelien Flura, Xavier Courtois, Sebastien Royer, Gilbert Blanchard, et al.. Role of the alumina surface properties on the ammonia production during the NOx SCR with ethanol over Ag/Al2O3 catalysts. Catalysis Today, Elsevier, 2011, 164 (1), pp.474-479. �10.1016/j.cattod.2010.10.036�. �hal-00739548�
Catalysis Today 164 (2011) 474-479. DOI: 10.1016/j.cattod.2010.10.036
Role of the alumina surface properties on the ammonia production
during the NOx SCR with ethanol over Ag/Al2O3 catalysts.
Fabien Cana*,Aurélien Fluraa,Xavier Courtoisa, Sébastien Royera, Gilbert Blanchardb,
Patrice Marécota, Daniel Dupreza,
aUniversité de Poitiers,Laboratoire de Catalyse en Chimie Organique, UMR 6503 CNRS, 40
Avenue du Recteur Pineau, 86022 Poitiers cedex, France.
bPeugeot SA, Route de Gizy, 78943 Velizy-Villacoublay cedex, France
*Fax: +33(0)549453741 ; Tel: +33(0)549453997 ; E-mail: fabien.can@univ-poitiers.fr
Abstract: The Selective Catalytic Reduction of NOx with ethanol (EtOH-SCR) was studied
over Ag/Al2O3 catalysts. A special attention was given to the ammonia emission and its possible
relationship with the support acidic properties. For this purpose, five alumina were selected, three provided by manufacturers and two synthesized in our laboratory by sol-gel or precipitation route. The supports were impregnated with 2wt.% Ag, and tested in EtOH-SCR. The results showed that the catalytic activity of Ag/Al2O3 greatly depends on the used alumina.
An unexpected ammonia production is evidenced, varying between 6 and 27% at 450°C, while NOx are fully converted. A correlation was established between the NH3 yield and the Lewis
Acid Sites (LAS) density measured by pyridine adsorption for each catalyst.
Keywords: Ag/Al2O3, EtOH-SCR, ammonia, NH3 selectivity, alumina surface properties,
1. Introduction
In this current period where the reduction of carbon dioxide emission become more and more severe, the solution to use engine working in lean condition remains very attractive. However, in this condition (i.e, in excess of oxygen), the usual three-way catalyst is inefficient in NOx
reduction. These last few years saw the emergence of two usual catalytic processes to reduce NOx from these engines exhausts. One possible solution is the use of the NOx storage reduction (NSR) catalyst [1], working in transient periods: during the lean condition, NOx are firstly oxidized and stored as nitrites or nitrates on a basic material, usually barium oxide. Periodically, the catalyst is regenerated: the stored NOx are reduced in N2 during a short excursion in rich
condition. Nevertheless the major drawback of this system is the deactivation of the catalyst, mainly due to sulfur poisoning [2,3], and the thermal aging [4,5]. The second way is the Selective Catalytic Reduction (SCR) of NOx. Numerous reducers have been investigated in the literature, such as hydrocarbons [6 , 7 , 8 , 9 , 10 , 11 , 12 , 13], oxygenated compounds [10,11, 14 , 15] and nitrogen containing compounds (ammonia, urea, …) [15,16,17,18,19]. Recently, the SCR of NOx by ethanol
over alumina supported silver catalysts has been extensively studied in the literature [20,21,22,23], due to his promising efficiency. Thereafter, numerous academic studies, dealing with the effect of silver loading and precursor, reaction mechanism, role of adsorbed species, and nature of active Ag species [24,25,26,27] have been published. Different routes have been explored to
improve the reaction efficiency, especially in order to raise the catalytic activity at low temperature (i.e, below 300°C) [28,29]. Nevertheless, although ammonia has been suggested as
a possible intermediate in the NOx SCR by hydrocarbons [30,31], no one directly focus, even in
the more quoted papers, on the amount of NH3 given out.
The present work focuses on the influence of the alumina chemical surface properties toward the NH3 emission during the SCR of NOx by ethanol with Ag/Al2O3 catalysts. Catalysts were
characterized using XRD, TEM and Infrared spectroscopy.
2. Experimental part
Catalyst preparation
The A(1) Al2O3 was synthesized as follows: an aluminum precursor (aluminum sec-butoxide,
97%, provided by Alfa Aesar) was dissolved in 1-butanol at 65°C and stirred until complete dissolution. The process was carried out in presence of a surfactant agent ((1-Hexadecyl) trimethylammonium, 98%, provided by Alfa Aesar). The two solutions were then mixed and
kept at 65°C under stirring. A limited amount of water was thereafter introduced under vigorous stirring, in order to start the hydrolysis of the aluminum precursor. The molar composition of the mixture was (Al : Surfactant : 1-butanol : water) = (0.5 : 1 : 10 : 2). Stirring was continued for 4h at 65°C until homogeneity was obtained. Then, the hydrothermal reaction was followed at 100°C for 24h under autogenous pressure and static condition. The product was washed several times with 1-butanol, and dried sequentially at room temperature during 24h. Then, the obtained gel was dried in oven at 80°C during 24h. Finally, the dried gel was heat-treated in air at a rate of 3°C min-1 up to 600°C, and kept at this temperature for 4h before cooling.
The A(2) alumina was synthesized using the following process: an aluminium precursor (Al(NO3)3, 98%, provided by Alfa Aesar) was dissolved in water and stirred. An amount of
NaAl2O4 (Riedel-de Haën) was added subsequently to start the hydrolysis, and stopped when
the pH of the resulting mixture reached 8. The solution was kept under stirring for 3h, and then placed in oven at 80°C for 20h. The product was washed twice with 250 mL of slightly warm water (40°C), and placed in oven during 48h at 110°C. Finally, the dried product was heat-treated in air at a rate of 3°C min-1 up to 600°C, and kept at this temperature for 4h before cooling.
The A(3), A(4) and A(5) alumina were provided by commercial manufacturers.
Surface and textural analysis
Transmission electron microscopy (TEM) analyses were obtained with a Philips CM 120 microscope operating at 120 kV, equipped with an energy-dispersive X-ray detector (EDX). Nitrogen adsorption isotherms were performed at -196°C using a Tristar 3000 Micromeritics apparatus. Prior to the measurement, the samples were pretreated at 250°C under vacuum for 5h. The surface area is calculated using the BET method.
XRD patterns were recorded in a Siemens D5000 diffractometer, equipped with a Cu anode ( = 0.15406 nm). Diffractograms were recorded in the 15-75° range of 2θ, with a step of 0.04° and a dwell time of 6 s. Crystalline phases were identified by comparison with the corresponding JCPDS files.
Chemical surface properties
The surface acidity was evaluated by IR spectroscopy of adsorbed pyridine. IR spectra were recorded in a Nexus Nicolet spectrometer equipped with DTGS detector (Deuterium TriGlyceride Sulfur) and KBr beam splitter. IR spectra were recorded with a resolution of 4 cm
-1 and 64 scans. The presented spectra were normalized to a disc of 10 mg cm-2. After activation
at 450°C under vacuum, pyridine was adsorbed (200 Pa at equilibrium) at room temperature and further desorbed until 450°C (by temperature step of 50°C). The 8a spectral regions were deconvoluated using the peak resolve function of the Omnic software, in order to obtain the amount of strong (Al3+IV) and weak (Al3+VI) Lewis Acid Sites (LAS). The total amount of LAS
is determined from the area of the 19b band, using its molar coefficient (19b = 1.5 cm µmol
-1 [32]). Hydroxyl groups of alumina were characterised by the study of IR spectra in the
3900-3500 cm-1 range.
Catalytic tests
Catalytic tests were performed in a quartz tubular micro-reactor under a flow composed of 400 ppm NO, 500 ppm CO, 167 ppm H2, 1200 ppm C2H5OH, 8% O2, 10% H2O, 10% CO2 balanced
in N2, simulating realistic exhaust conditions. Gas flows were controlled using mass-flow
controllers (Brooks), except for H2O and C2H5OH which were introduced using thermostated
saturators. The GHSV is fixed at 150 000 h-1. Both NO and NOx concentrations (NO+NO2)
were measured by chemiluminescence (Monitor Europe ML9841AS); CO and N2O were
detected by FTIR analyzers (COSMA Beryl 100). Prior to the analyzers, H2O was removed in
a condenser at 0°C. For each studied temperature (150°C, 250°C, 300°C, 350°C, 450°C and 550°C), the activity of the catalysts was followed until stabilization. After stabilization, the outlet water was condensed for thirty minutes through bubbling the gas mixture in a clean condenser filled with 10 mL of demineralised water (pH 5,5), and then analyzed by two HPLC (Thermo Finnigan) for NH4+ (Alltech Universal Cation, 7μm, 4.6x100mm) and NO2- and NO3
-(Agilent Eclipse XDB-C18, 5μm, 4.6x50mm). NO2- and NO3- were added to the unconverted
NOx. An example of the calculation of the NH4+ concentration (ppm) species are reported here:
n(NH4+ trapped in 30 min) [mole] = C(NH4+ in condensed solution) * V(condensed solution)
V(NH3 gas) [L] = n(NH4+ trapped in 30 min)* Vm
Q (NH3 gas) [mL/min ]= [V(NH3 gas) * 103] / t(condensation){min}
Ethanol conversion was measured using a Gas Chromatograph (Varian 3400, Supelco HayeSep R, 60-80 mesh, 1/8’x2000mm) equipped with a FID detector. The N2 selectivity is calculated
assuming no other N-compounds than NO, NO2, N2O, NH3. In order to validate our results, all
the outlet gas (C2H5OH, CH3CHO, CH3OH, CH2O, C2H4, CO, NO, NO2, NH3, N2O) are
regularly checked with a multigas infrared detector (MKS 2030).
3. Results and discussion
3.1 Catalysts characterization
Supported silver catalysts are characterized by XRD, TEM and IR. Results of the catalysts textural and structural characterizations are summarized in Table 1. Surface area varies between 138 m2 g-1 for A(5) and 263 m2 g-1 for A(1) sample, prepared using a modified sol-gel procedure. Pore volume and pore diameter are also widely-spread.
X-ray diffraction patterns are presented in Fig.1. The analysis evidences the formation of -Al2O3 phase (JCPDS file n°00-050-0741) for all samples with no visible reflection assigned to
Ag0 or AgO. The metallic silver particles are characterized by transmission electron spectroscopy (TEM). Whatever the studied sample, TEM analysis (Figure not shown) allows to detect silver particles dispersed among the alumina aggregates, sizing between 4 and 7 nm. Some larger particles (around 20-35 nm) are also detected, in a lesser extent, showing that alumina physical properties have a limited effect on the silver dispersion.
To summarize, the textural and structural characterizations only show that the surface area of various alumina supports differs from a material to the other. No differences were observed between their crystalline phase and their metallic dispersion measurements.
Table 1: Textural properties of alumina supports.
SBET (m² g-1) Vp (cm3 g-1) Dp (nm) Ag/A(1) 263 1.13 9.6 Ag/A(2) 186 0.29 5.3 Ag/A(3) 164 0.84 12.8 Ag/A(4) 156 0.48 9.4 Ag/A(5) 138 0.45 9.0
Fig. 1: XRD patterns of alumina supports. γ-Al2O3 structure [ICDD PDF n° 00-050-0741 (I)].
3.2 Catalytic test
Firstly, the reactivity of unsupported alumina A(1) support and the alumina silver supported (Ag/A(1)) catalyst was investigated. The ethanol conversion versus temperature was studied with or without NOx in the gas mixture. Secondly, the conversion of NOx in N2, as well as the
NH3 yield, was presented.
3.2.1 Ethanol decomposition
The effect of NOx in the ethanol conversion versus temperature is presented in Fig. 2 for A(1) support and Ag/A(1) catalyst. Firstly, the ethanol conversion is always higher on silver supported catalyst than on the support alone, with or without NOx in the gas mixture. For instance, without NOx (dotted line, Fig. 2), the ethanol conversion is about 40% at 250°C for the Ag/A(1) catalyst whereas it reaches 18% for the A(1) corresponding support. Secondly, the ethanol conversion increases in the presence of NOx in the gas mixture for both materials. Ethanol is totally converted at 350°C for the alumina A(1) support as well as for the silver A(1) supported silver catalyst (Ag/A(1)).
Besides, it is well known in the literature that ethanol dehydrogenation and ethanol dehydration[33,34] are respectively catalyzed by basic (and metallic) or acidic sites. It results in the formation of acetaldehyde or ethylene, as mentioned in reaction (1) and (2):
CH3-CH2-OH CH3-CH=O + H2 (1)
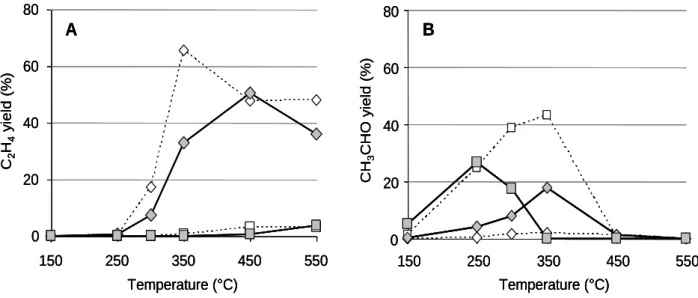
The C2H4 and CH3CHO yield are reported in Fig.3 versus the temperature of catalytic test. For
the alumina A(1) support, without NOx in the gas mixture, the main product of the ethanol decomposition is ethylene, with a maximum yield of about 65% at 350°C (dotted line, Fig.3A). In presence of NOx, C2H4 yield decreases, while CH3CHO yield increases. Concerning the
silver supported catalyst, different results are observed. The main ethanol decomposition compound is acetaldehyde, with a maximum yield shifted to the lower temperature, with about 30% at 250°C. These results are in good agreement with the literature data which suggest that C2H4 formation is catalyzed by acidic sites of the alumina support whereas the acetaldehyde
production is rather catalyzed at low temperature by metallic sites.
Fig. 2: Ethanol conversion in function of temperature for A(1) support () and Ag/A(1) catalyst (). Blank symbols : without NOx ; solid symbols : with NOx in the gas mixture.
Fig. 3: C2H4 (A) and CH3CHO (B) yields versus temperature for A(1) support () and Ag/A(1) catalyst (). In dotted line, catalytic results obtained without NOx in the gas mixture.
0 20 40 60 80 100 150 250 350 450 550 E th an ol co nve rsion ( % ) Temperature (°C) B 0 20 40 60 80 150 250 350 450 550 Temperature (°C) CH 3 C H O y ie ld ( % ) 0 20 40 60 80 150 250 350 450 550 Temperature (°C) C2 H4 y ie ld ( % ) A B 0 20 40 60 80 150 250 350 450 550 Temperature (°C) CH 3 C H O y ie ld ( % ) B 0 20 40 60 80 150 250 350 450 550 Temperature (°C) CH 3 C H O y ie ld ( % ) 0 20 40 60 80 150 250 350 450 550 Temperature (°C) C2 H4 y ie ld ( % ) A 0 20 40 60 80 150 250 350 450 550 Temperature (°C) C2 H4 y ie ld ( % ) A
3.2.2 SCR of NOx by ethanol
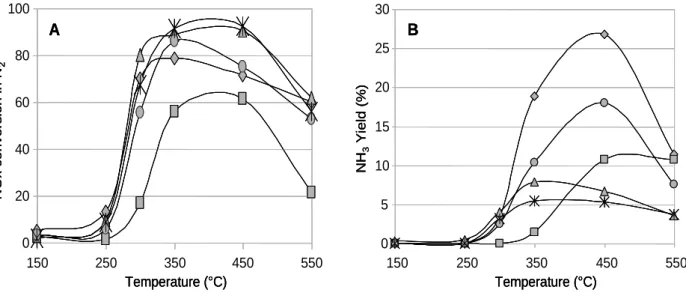
The Fig.4 displays the NOx conversion in N2 and the NH3 yield for the five silver supported
materials. The NOx conversion starts at 250°C to become significant at 300°C, and reaches a maximum from 350°C to 450°C. At this temperature, the catalytic behavior differs from a catalyst to the other. For instance, no significant amount of N2O is measured, but the
evolution of the ammonia yield versus the temperature, reported in Fig.4B, clearly shows a high ammonia emission. Indeed, while reaction is selective into N2 at low temperature
(below 300°C, Fig.4A), an increase in the NH3 yield is observed alongside the reaction
temperature, the maximum being observed at 450°C. Thus, NH3 yield varies as follow:
Ag/A(1) > Ag/A(3) > Ag/A(2) > Ag/A(4) > Ag/A(5)
NH3 production is spread from a few percents for Ag/A(4) and Ag/A(5) to 27 % for Ag/A(1).
Such emission is, to our knowledge, not highlighted in the literature. One can note here that no ammonia formation is observed on silver free aluminas.
It has been shown previously that the textural properties of the five various alumina supports are very close. Thus, the high ammonia yields observed in Fig.4B must be explains by other component, such as chemical surface properties. In this way, hydroxyl groups of aluminas supports as well as acidic properties of catalysts have been characterized using pyridine adsorption monitored by infrared spectroscopy.
Fig. 4: NOx conversion in N2 (A) and NH3 yield (B) versus the alumina support and the catalytic temperature test. 0 20 40 60 80 100 150 250 350 450 550 Temperature (°C) N O x c on v ers io n in N 2 A 0 5 10 15 20 25 30 150 250 350 450 550 Temperature (°C) NH 3 Y iel d (% ) B 0 20 40 60 80 100 150 250 350 450 550 Temperature (°C) N O x c on v ers io n in N 2 A 0 20 40 60 80 100 150 250 350 450 550 150 250 350 450 550 Temperature (°C) N O x c on v ers io n in N 2 A 0 5 10 15 20 25 30 150 250 350 450 550 Temperature (°C) NH 3 Y iel d (% ) B 0 5 10 15 20 25 30 150 250 350 450 550 150 250 350 450 550 Temperature (°C) NH 3 Y iel d (% ) B
3.3 IR study
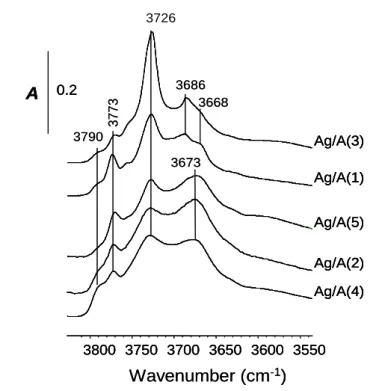
In Fig. 5, the IR spectra in the OH stretching region of silver supported on alumina catalysts were compared after outgassing at 450°C. IR spectra are consistent with that reported in the literature [35], showing the different types of OH groups over alumina that display bands at 3790, 3773, 3726, 3686 and 3668 cm-1. Assignments are reported in Table 2. However one can note that the intensity of the band at 3726 cm-1, attributed to bridging hydroxyl (AlIVAlVI)OH
type II, is significantly higher in the Ag/A(3) catalyst. In a same extent, the basic hydroxyl group characterized by the stretching OH frequency at 3773 cm-1 is less dominant in this Ag/A(3) sample compared with the other supported silver catalysts.
Fig. 5: IR spectra in the (OH) region of catalysts activated by outgassing at 450°C.
Table 2: OH assignment on the surface of aluminas.
(OH) frequency / cm-1 Type of OH group Structure
3800-3785 (I): (AlVI)OH
3780-3760 (AlIV)OH 3745-3740 (II): (AlVI)2OH 3735-3730 (AlIVAlVI)OH 3710-3700 (III): (AlVI)3OH 3550 3600 3650 3700 3750 3800 Wavenumber (cm-1) 0.2 A Ag/A(1) Ag/A(3) Ag/A(5) Ag/A(2) Ag/A(4) 3773 3790 3686 3673 3668 3726 3550 3600 3650 3700 3750 3800 3750 3700 3650 3600 3550 3800 Wavenumber (cm-1) 0.2 A 0.2 A Ag/A(1) Ag/A(1) Ag/A(3) Ag/A(3) Ag/A(5) Ag/A(5) Ag/A(2) Ag/A(2) Ag/A(4) Ag/A(4) 3773 3790 3686 3673 3668 3726 H O M H O M H O M M H O M M H O M M M H O M M M
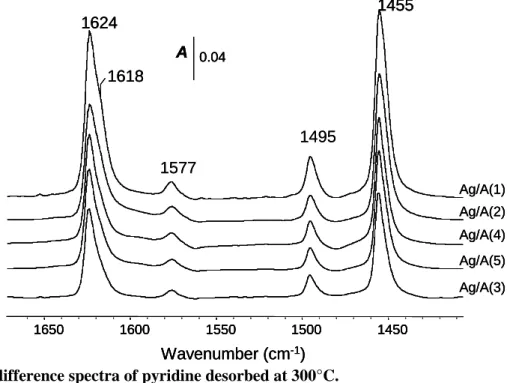
Fig. 6: IR difference spectra of pyridine desorbed at 300°C.
The surface acidity was evaluated by IR spectroscopy of adsorbed pyridine, which is one of the most largely used basic probe molecules for surface acidity characterization [36 , 37]. After activation at 450°C, pyridine was adsorbed (200 Pa at equilibrium) at room temperature and further desorbed at 300°C (by temperature step of 50°C), in order to eliminate physisorbed and H-bonded pyridine from the surface. IR spectra of the silver supported on various aluminas are presented in Fig. 6. Acidity is monitored by the ring vibration modes 8a, 8b, 19a and 19b of adsorbed pyridine, as studied by Parry [36]. IR adsorption band are then observed at 1624, 1618, 1577, 1495 and 1455 cm-1, assigned to coordinated pyridine on Lewis acid sites (LAS).
No IR band assigned to pyridinium was observed, as expected on alumina which does not present OH groups strong enough to protonate the pyridine.
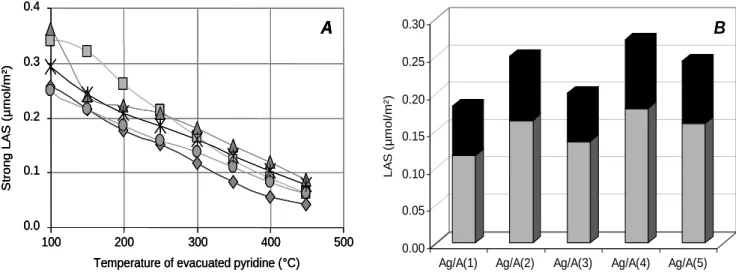
In the 8a spectral range, two bands can be distinguished on these catalysts at 1624 and 1618 cm-1, assigned to pyridine respectively coordinated to tetrahedral Al3+ (strong LAS) and to both tetrahedral and octahedral Al3+ (medium LAS) coordinatively unsaturated sites (CUS). The deconvolution of the peaks occurring in the 8a vibration range (Figure not shown), may be used to describe the heterogeneous Lewis acidic character of studied catalysts in order to obtain the distribution of coordinated pyridine on each type of LAS. For instance, the Fig.7A exhibits the evolution of the density of strong (8a at 1624 cm-1) LAS versus the temperature of evacuated pyridine. Firstly, comparison between aluminas support and silver supported catalysts show that metallic particles have no effect on the infrared spectra. In Fig.7B is shown
1455 1618 1624 1450 1500 1550 1600 1650 Wavenumber (cm-1) 0.04 A Ag/A(1) Ag/A(2) Ag/A(3) Ag/A(4) Ag/A(5) 1577 1495 1455 1618 1624 1450 1500 1550 1600 1650 Wavenumber (cm-1) 0.04 A Ag/A(1) Ag/A(2) Ag/A(3) Ag/A(4) Ag/A(5) 1455 1618 1624 1450 1500 1550 1600 1650 1600 1550 1500 1450 1650 Wavenumber (cm-1) 0.04 A 0.04 A Ag/A(1) Ag/A(2) Ag/A(3) Ag/A(4) Ag/A(5) 1577 1495
the distribution between weak and strong LAS, determinates from pyridine coordinated on alumina CUS at 300°C. Several points should be noted. First, Fig7B informs that alumina support do not display the same density of LAS. The Ag/A(4) catalyst exhibits the higher amount of LAS, whereas Ag/A(1) presents the lesser LAS density. Secondly, the distribution between strong and weak LAS varies greatly, infering a strong Lewis acid sites ranged from 0.12 µmol/m² to 0.18 µmol/m², which leads to the following order: Ag/A(4) > Ag/A(5) > Ag/A(2) > Ag/A(3) > Ag/A(1).
In the literature [38], the hydrolysis reaction of HNCO has been forwarded for the ammonia production, via the following reaction: HNCO + H2O NH3 + CO2
Recently [39], a real-time infrared experiment showed that strong (Al3+IV) and weak (Al3+VI)
Lewis acid sites were involved in the -NCO spill over, through a transfer of the isocyanate from Al(VI) to Al(IV). Since isocyanate species are generally assumed as a precursor to ammonia, the
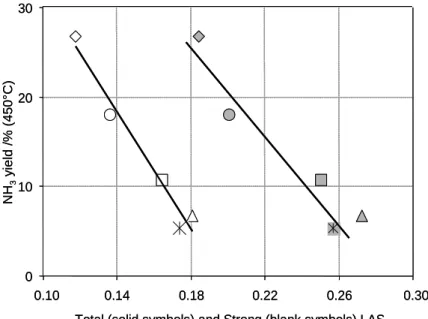
amount of NH3 yield was regarded as a function of the strong Lewis acid site density. Indeed,
Fig. 8 illustrate the correlation between the NH3 yield and the amount of strong or total LAS
density, evaluated from pyridine coordinated at 300°C. Similar results can be obtained while using the Al3+(IV)/Al3+(VI) ratio. In fact, the Al3+(IV)/Al3+(VI) ratio is independent from the catalysts
surface area and can also be used to assess the strong to weak LAS balance. It was assumed that the higher the density of strong LAS, the lower the NH3 emission. This correlation clearly
evidences the role of acidic properties of alumina support on the mechanism of ammonia production for NOx SCR with ethanol.
Fig. 7: (A): Evolution of strong LAS density (µmol/m²) versus temperature of evacuated pyridine. (): Ag/A(1); (): Ag/A(2); (): Ag/A(3); (): Ag/A(4); (): Ag/A(5).
(B): LAS density (µmol/m²) of coordinated pyridine desorbed at 300°C evaluated after IR
0.0 0.1 0.2 0.3 0.4 100 200 300 400 500
Temperature of evacuated pyridine (°C)
S trong L A S ( µ m ol /m ²) A 0.00 0.05 0.10 0.15 0.20 0.25 0.30 LA S ( µ mol /m² )
Ag/A(1) Ag/A(2) Ag/A(3) Ag/A(4) Ag/A(5) B 0.0 0.1 0.2 0.3 0.4 100 200 300 400 500
Temperature of evacuated pyridine (°C)
S trong L A S ( µ m ol /m ²) A 0.0 0.1 0.2 0.3 0.4 100 200 300 400 500
Temperature of evacuated pyridine (°C)
S trong L A S ( µ m ol /m ²) A 0.00 0.05 0.10 0.15 0.20 0.25 0.30 LA S ( µ mol /m² )
Ag/A(1) Ag/A(2) Ag/A(3) Ag/A(4) Ag/A(5) B
Fig. 8: NH3 yield at 450°C versus the strong Lewis Acid Sites (LAS), evaluated from the 19b and the 8a IR band of the pyridine coordinated at 300°C, in µmol/m². (): Ag/A(1) ; (): Ag/A(2) ; (): Ag/A(3) ; (): Ag/A(4) ; (): Ag/A(5).
4. Conclusion
In this work, the selective catalytic reduction of NOx by ethanol over alumina supported silver catalyst was studied. Five alumina supports were investigated. Firstly, catalysts characterizations show that alumina physical and textural properties have a limited effect on the metallic silver particles size. However it was demonstrated that hydroxyl groups and Lewis acid sites distribution differ versus the aluminum oxide. Catalytic tests show that Ag/Al2O3
obviously presents high activity for the SCR of NOx with ethanol, as extensively reported in the
literature. Surprisingly, a high and unexpected ammonia emission was also reported here (up to 27%). A correlation between the NH3 yield and the acidic surface properties of the alumina
support was likewise reported.
This study evidenced the importance of the support surface acid-base properties, which need to be controlled in order to maintain ammonia production in reaction at an acceptable level.
0 10 20 30
0.10 0.14 0.18 0.22 0.26 0.30 Total (solid symbols) and Strong (blank symbols) LAS
evacuated at 300°C (µmol/m²) NH 3 y ie ld / % ( 45 0 °C) 0 10 20 30 0.10 0.14 0.18 0.22 0.26 0.30 Total (solid symbols) and Strong (blank symbols) LAS
evacuated at 300°C (µmol/m²) NH 3 y ie ld / % ( 45 0 °C)
References:
1 : W. S. Epling, L. E. Campbell, A. Yezeerets, N. W. Currier, J. E. Parks II, Catal. Rev. 46 (2004) 163. 2 : C. Sedlmair, K. Seshan, A. Jentys, J.A. Lercher, Catal. Today. 75 (2002) 413.
3 : E.C. Corbos, X. Courtois, N. Bion, P. Marecot, D. Duprez, Appl. Catal. B 80 (2008) 62. 4 : D. Uy, A.E. O’Neill, J. Li and W.L.H. Watkins, Top. Catal. 95 (2004) 191.
5 : M. Casapu, J.D. Grunwaldt, M. Maciejewski, M. Wittrock, U. Göbel and A. Baiker, App. Catal. B 63 (2006) 232.
6 : M. Konsolakis, I.V. Yentekakis, J. Catal. 198 (2001) 142.
7 : J. Shibata, K.-I. Shimizu, A. Satsuma, T. Hattori, Appl. Catal. B 37 (2002) 197.
8 : E.F. Iliopoulou, A.P. Evdou, A.A. Lemonidou, I.A. Vasalos, Appl. Catal. A 274 (2004) 179. 9 : L.F. Cordoba,W.M.H. Sachtler, C.M. de Correa, Appl. Catal. B 56 (2005) 269.
10 : T. Maunula, J. Ahola, H. Hamada, Appl. Catal. B 26 (2000) 173.
11 : E. Joubert, X. Courtois, P. Marecot, D. Duprez, Appl. Catal. B 64 (2006) 103. 12 : P. Denton, A. Giroir-Fendler, H. Praliaud, M. Primet, J. Catal. 189 (2000) 410.
13 : F. Figueras, J.L. Flores, G. Delahay, A. Giroir-Fendler, A. Bouranea, J.-M. Clacens, A. Desmartin-Chomel, C. Lehaut-Burnouf, J. Catal. 232 (2005) 27.
14 : D. Tran, C.L. Aardahl, K.G. Rappe, P.W. Park, C.L. Boyer, Appl. Catal. B 48 (2004) 155. 15 : K.O. Haj, S. Ziyade, M. Ziyad, F. Garin, Appl. Catal. B 37 (2002) 49.
16 : N.W. Cant, A.D. Cowan, I.O.Y. Liu, A. Satsuma, Catal. Today 5 (1999) 473. 17 : N.W. Cant, I.O.Y. Liu, Catal. Today 63 (2000) 133.
18 : V. Zuzaniuk, F.C. Meunier, J.R.H. Ross, J. Catal. 202 (2001) 340. 19 : I.O.Y. Liu, N.W. Cant, J. Catal. 230 (2005) 123.
20 : N. Bion, J. Saussey, M. Haneda, M. Daturi, J. Catal., 217 (2003) 47. 21 : Y.H. Yeom, M. Li, W.M.H. Sachtler, E. Weitz, J. Catal., 246, (2007) 413. 22 : H. He, Y. Yu, Catal. Today, 100 (2005) 37.
23 : A. Obuchi, I. Kaneko, J. Oi, A. Ohi, A. Ogata, G.R. Bamwenda, S. Kushiyama, Appl. Catal. B., 15 (1998) 37.
24 : K. Shimizu and A. Satsuma, Phys. Chem. Chem. Phys., 6 (2006) 2677. 25 : X. Zhang, H. He, Z. Ma, Catal. Comm., 8 (2007) 187.
26 : Y. Yu, H. He, Q. Feng, J. Phys. Chem. B., 107 (2003) 13090.
27 : Y. Yeom, M. Li, A. Savara, W. Sachtler, E. Weitz, Catal. Today, 136 (2008) 55.
28 : K. Sato, T. Yoshinari, Y. Kintaichi, M. Haneda and H. Hamada, Appl. Catal. B., 44 (2003) 67. 29 : H. He, J. Wang, Q. Feng, Y. Yu and K. Yoshida, Appl. Catal. B., 46 (2003) 365.
30 : F. Poignant, J. Saussey, J-C. Lavalley, G. Mabilon, J. Chem. Soc., Chem. Commun., (1995) 89. 31 : F. Poignant, J.L. Freysz, M. Daturi, J. Saussey, Catal. Today, 70 (2001) 197.
32 : S. Khabtou, T. Chevreau, J.C. Lavalley, Micro. Mater. 3 (1994) 133..
33 : F. Can, A. Le Valant, N. Bion, F. Epron, D. Duprez, J. Phys. Chem. C 112 (2008) 14145. 34 : A. Le Valant, N. Bion, F. Can, D. Duprez, F. Epron, Appl. Catal. B, 97 (2010) 72. 35 : H. Knözinger, P. Ratnasamy, Catal. Rev. - Sci. Eng. 17 (1978) 31.
36 : E.P. Parry, J. Catal. 2 (1963) 371.
37 : H. Knözinger, Adv. Catal. 25 (1976) 184.
38 : N. Macleod, R. M. Lambert, Chem. Commun., 9 (2003) 1300.
39 : F. Thibault-Starzyk, E. Seguin, S. Thomas, M. Daturi, H. Arnolds, D. A. King, Science, 324 (2009) 1048.
![Fig. 1: XRD patterns of alumina supports. γ-Al 2 O 3 structure [ICDD PDF n° 00-050-0741 (I)]](https://thumb-eu.123doks.com/thumbv2/123doknet/14773955.592700/7.892.242.662.114.395/fig-xrd-patterns-alumina-supports-structure-icdd-pdf.webp)