Identification of genes expressed during the compatible
interaction of grapevine with
Plasmopara viticola
through suppression subtractive hybridization (SSH)
Guillaume Legay&Elaheh Marouf&Dave Berger&Jean-Marc Neuhaus&Brigitte Mauch-Mani& Ana Slaughter
Accepted: 23 August 2010 / Published online: 10 September 2010 # KNPV 2010
Abstract Grapevine (Vitis vinifera) is the most widely cultivated and economically important fruit crop, but is susceptible to a large number of diseases. Downy mildew, caused by the obligate biotrophic oomycete pathogen Plasmopara viticola, is a com-mon disease present in all regions where vines are cultivated. We used suppression subtractive hybrid-ization (SSH) to generate two cDNA libraries enriched for transcripts induced and repressed, re-spectively, in the susceptible grapevine cultivar Chasselas 24 h after inoculation with P. viticola. Differential screening on glass slide microarrays yielded over 800 putative genes that were up-regulated in response to P. viticola infection and over 200 that were down-regulated. One hundred and ninety four of these, were sequenced, identified and functionally categorised. Transcript abundance of twelve genes over a 48 h time course was examined
by reverse transcriptase quantitative real-time PCR (RT-qPCR). Ten of these genes were induced/en-hanced by P. viticola challenge, confirming the results of the SSH. The vast majority of the genes identified are related to defence. Interestingly, many genes involved in photosynthesis were down-regulated.
Keywords Compatible interaction . Reverse
transcriptase quantitative real-time PCR . Plasmopara viticola . Suppression subtractive hybridization . Vitis vinifera
Introduction
Downy mildew caused by the obligate biotrophic pathogen Plasmopara viticola, is an economically important disease of grapevine. The pathogen attacks all green parts of the grapevine. Within a few hours after inoculation, the pathogen has penetrated the tissue and formed the first haustoria in a susceptible cultivar and after 3 days, the intercellular spaces are entirely filled with mycelium and sporulation is abundant under favourable environmental conditions (Unger et al. 2007). In a resistant cultivar, the first infection steps are the same, however, the invasive growth of P. viticola is delayed and further develop-ment ceases before the intercellular spaces colonized (Unger et al. 2007). Most of the widely grown grapevine cultivars are highly susceptible to P. DOI 10.1007/s10658-010-9676-z
G. Legay
:
E. Marouf:
J.-M. Neuhaus:
B. Mauch-Mani (*):
A. SlaughterLaboratory of Molecular and Cellular Biology, University of Neuchâtel,
Rue Emile-Argand 11, Case Postal 158, 2009 Neuchâtel, Switzerland
e-mail: [email protected] D. Berger
Department of Plant Science, Forestry and Agricultural Biotechnology Institute (FABI), University of Pretoria, Lunnon Road,
viticola and the control of downy mildew requires regular fungicide applications. Application of copper-containing fungicides to control downy mildew causes accumulation of this heavy metal in soil and groundwater, resulting in toxic effects to the environ-ment. Constant use of fungicides is also a problem since it may favour the emergence of fungicide-resistant isolate that may dominate the population.
Although a number of studies describe the biology of the infection process of grapevine by P. viticola (Allegre et al. 2007; Kortekamp 2005; Musetti et al. 2007; Unger et al. 2007; Werner et al. 2002) and the characterisation of defence reactions in susceptible and resistant grapevines (Dai et al.1995; Gindro et al.
2003; Kortekamp2006, Kortekamp and Zyprian2003) or their response to inducers of defence reactions (Aziz et al.2003; Hamiduzzaman et al.2005; Trouvelot et al.
2008), a large-scale analysis of P. viticola and grapevine interaction has not been reported.
Upon recognition of an invader, signal transduction events ultimately leading to the induction of both chemical and physical defence responses are activated (Scheel1998). The specific recognition of a pathogen often leads to a programmed cell death termed the hypersensitive response (HR). It is a rapid and efficient plant resistance mechanism leading to cell death at the site of infection, usually in gene-for-gene interactions with obligate biotrophic pathogens (Heath2000). The cellular events taking place during the HR comprise among others the generation of reactive oxygen species (ROS) at the site of infection, cell wall reinforcements through callose-rich deposits, ion fluxes, and the synthesis of anti-microbial compounds and enzyme inhibitors (Glazebrook 2005). In grapevine, these include low-molecular antimicrobial compounds (phy-toalexins), deposition of phenolics, lignin and callose and increased activity of pathogenesis-related (PR) proteins with hydrolytic activity (chitinases and gluca-nases; Derckel et al.1999).
Since the difference between a resistant and suscep-tible plant is often just a question of timing and amplitude of the adequate defence response (Polesani et al.2010), investigating a compatible interaction not only gives information on the availability of adequate defence mechanisms but will also assist in the development of new control strategies and lead to the identification of pathogen and host factors needed for disease progres-sion. Investigating the molecular basis of plant-pathogen interactions often uncovers novel aspects of plant cell
biology and signalling mechanisms. Expression profiles investigating compatible interactions in cultivated grape-vine genotypes is limited and downy mildew has received very little attention compared to diseases caused by other biotrophic pathogens, such as powdery mildew and rusts (Polesani et al.2008).
Functional genomic approaches provide powerful tools for identifying expressed genes. Among these techniques, expressed sequence tags (EST) (Adams et al. 1991), serial analysis of gene expression (SAGE) (Velculescu et al. 1995) and massively parallel signa-ture sequencing (MPSS) (Brenner et al. 2000), have been successfully employed. Subtractive suppression hybridization (SSH) is an effective method that can be used to maximise the identification of genes that are involved in host responses to pathogen infection and disease development. This technique has been used to isolate plant genes that are expressed in response to infection (Birch et al.1999; Degenhardt et al.2005; Lu et al.2004; Van den Berg et al.2007). The SSH cDNA library approach reduces the cloning of abundantly expressed housekeeping genes or genes commonly expressed in both control and treated plants, therefore significantly enhancing the chances of cloning differ-entially expressed genes. This is particularly important because many PR genes are expressed at low levels. These genes are less likely to be represented in a library if standard EST cloning methods are used. The aim of this study was to construct a SSH cDNA-library to identify and verify genes that are differentially expressed during a susceptible response of V. vinifera cv. Chasselas to P. viticola. By this approach, P. viticola-responsive genes were identified and classified into functional groups and the expression profiles of some of the genes were examined by quantitative real time PCR following inoculation with P. viticola.
Material and methods
Biological materials
Grapevine plants were grown from V. vinifera cv Chasselas seeds (susceptible to P. viticola), in soil at Syngenta (Stein, Switzerland) in a glasshouse at day/ night temperature of 23°C/ 18°C with a photoperiod of 16 h and relative humidity (RH) of 65±10%. Seedlings at the five-to six-leaf stage (6 weeks) were used for infection experiments.
Pathogen and inoculation of plants
P. viticola (house isolate, obtained from Syngenta, Stein, Switzerland) was maintained on susceptible Chasselas seedlings in a glasshouse. Weekly, the abaxial surfaces of young leaves were inoculated with an aqueous suspen-sion containing ~4×10⁴sporangia ml-1. The inoculated plants were kept at 100% RH overnight. After incubation for 6 days under ambient glasshouse conditions, the plants were again maintained overnight at 100% RH to induce sporulation. The sporangia were harvested and used for inoculation.
Six week old grapevine seedlings were inoculated at Syngenta by spraying a freshly prepared sporangia suspension (6×10⁴ sporangia ml-1) onto the abaxial leaf surfaces. For the mock-inoculation, seedlings were sprayed with water. Inoculated and mock-inoculated seedlings were placed overnight in a humid chamber. Samples were collected from inoculated and mock-inoculated leaves 24 h after inoculation (for library construction) or at 0, 8, 12, 24 and 48 h after inoculation (for quantitative RT-PCR) and immediately frozen in liquid nitrogen and stored at−80°C. For the next 6 days the plants were placed in a glasshouse under the conditions described above and finally placed in a humid chamber overnight to induce sporulation. On day 7 plants were assessed for visual disease symptoms (Fig. 4a–c). For the library con-struction, 15 inoculated and 15 mock-inoculated plants were used. Twenty 4 h after inoculation, the third, fourth and fifth leaves from inoculated and mock-inoculated plants were harvested and immediately frozen in liquid nitrogen and stored at−80C.
For gene expression analysis, at each time point a pool of 3 inoculated and 3 mock-inoculated plants was used. As for the library construction, the third, fourth and fifth leaves from the bottom of inoculated and mock-inoculated plants were harvested. Two independent experiments were carried out.
RNA isolation and SSH library construction
Total RNA was isolated from frozen leaf tissues using a modified CTAB extraction and lithium chloride precipitation method according to (Iandolino et al.
2004). The mRNA was isolated using Poly(A)Pur-ist™ mRNA Purification Kit (Ambion) according to the manufacturer’s protocol and purified mRNA quality was then determined on an Agilent 2100
Bioanalyser RNA 6000 Pico LabChip. Two micro-grams of high quality mRNA were used for the construction of the libraries.
SSH was carried out using the PCR-Select cDNA Subtraction Kit (Clontech, Palo Alto, CA). cDNA prepared from the inoculated samples was used as the tester and that from the mock-inoculated samples as the driver for the forward subtraction to isolate fragments corresponding to genes whose expression level was increased following infection. The reverse library was carried out with the mock-inoculated samples as tester and inoculated samples as driver in order to isolate fragments corresponding to genes whose expression level decreased following infection. An Advantage PCR cloning kit (Clontech, USA) was used to selectively amplify the cDNA fragments preferentially present in the tester from the subtraction hybridization products. Secondary PCR products from the forward and reverse subtracted libraries were cloned into pGEM-T Easy vector (Promega) according to the manufacturer’s protocol. Transformation was performed using Library Efficiency DH5α Competent Cells (Invitrogen). A total of 1344 clones form the forward SSH library and 1152 from the reverse SSH library were randomly picked and stored in 96-well plates.
SSH cDNA microarray screening
In preparation for screening with microarrays, following the method of Van den Berg et al. (2004) and modifications of Berger et al. (2007), PCR reaction products from all the clones in the forward and reverse SSH libraries were purified using the 96-well Multiscreen HTS, FB plates (Millipore). An aliquot of the purified PCR products were visualised on a 1% agarose Electro-Fast Stretch gel to check that a single band was amplified and to estimate the yield. The purified PCR products were dried in a vacuum centrifuge and resuspended in 20μl 3X SSC, 1.5 M betaine. Libraries containing in total 2496 grapevine clones were arrayed in triplicate onto aldehydesilane-coated slides (NexterionTM Slide AL, Schott Nexterion, Jena, Germany) using an Omnigrid 300 contact-printing robotic micro-arrayer (Genomic Solutions, Ann Arbor, MI) equipped with SMP3 pins (TeleChem International Inc.). Spike controls (Lucidea Universal Scorecard, GE Healthcare) were included for each sub-grid of the microarray. Spot and printing quality were
assessed visually after printing and the DNA was cross-linked to the slides by baking at 80°C for 1 h. The slides were post-processed with sodium boro-hydride using the protocol recommended by the manufacturer (Schott Nexterion, Jena, Germany).
Preparation of fluorescent targets and hybridization
Forward subtracted (FS), forward unsubtracted (FU) and reverse unsubtracted (RU) cDNA targets were used to screen the forward SSH library, whereas reverse subtracted (RS), reverse unsubtracted (RU) and forward unsubtracted (FU) cDNA targets were used to screen the reverse SSH library on glass slide microarrays (Berger et al.2007). cDNA targets of FS, FU, RS and RU, with the adaptors removed were labelled by incorporation of Cy5 and Cy3-dUTP using Klenow enzyme according to Berger et al. (2007). The labelled targets were purified using the Wizard SV gel and PCR clean-up system (Promega) and quantified using a Nanodrop spectrophotometer.
Eight slides were arrayed with the cDNA probes from the forward and reverse library separately. Before hybridization, equimolar amounts (300 pmol) of each pair of appropriate labelled targets and 10μg yeast tRNA were mixed and concentrated through a Microcon YM-30 filter (Millipore). The target combinations for screen-ing of the forward library were as follows: Cy3-labelled FS and Cy5-labelled FU; dye swap: Cy3-labelled FU and Cy5-labelled FS (to calculate Enrichment ratio 2); labelled FU and Cy5-labelled RU; dye swap: Cy3-labelled RU and Cy5-Cy3-labelled FU (to calculate Enrich-ment ratio 3) (Berger et al.2007). For the screening of the reverse library, the target combinations were: labelled RS and Cy5-labelled RU; dye swap: Cy3-labelled RU and Cy5-Cy3-labelled RS (to calculate Enrich-ment ratio 2); Cy3-labelled RU and Cy5-labelled FU; dye swap: Cy3-labelled FU and Cy5-labelled RU (to calculate Enrichment ratio 3). For hybridizations, the labelled probes were combined with 3X SSC and 0.4% SDS in a final volume of 30μl. The solution was boiled for 1 min, centrifuged and applied to the microarray under a cover slip. The microarray slides were sealed in a hybridization chamber (TeleChem) and submerged in a water bath at 64°C overnight. After hybridization, slides were washed twice for 5 min in 2X SSC/ 0.1% SDS, twice for 1 min in 0.2X SSC and twice for 1 min in 0.1X SSC. Slides were dried by centrifugation at 900 g for 2 min and scanned with an Agilent DNA
microarray scanner (Agilent Technologies). Genepix Pro 5.1 was used to localise and integrate every spot on the array. Analysis of microarray data was done according to Berger et al. (2007) by using the SSHscreen 1.0.4 package downloaded from http://microarray.up.ac.za/ SSHscreen/. SSHscreen was used to implement the following statistical approaches: the normexp method was used to correct for the background, in order to normalise within arrays the printiploess method was used and finally to normalise between arrays the Aquantile method was used.
Sequence analysis
Sequencing of the inserted cDNA fragments was done using the T7 and SP6 primers at Microsynth (Switzerland). Sequences were compared to the UniProt database as well as NCBI database using BLAST. Functional categorisation of sequences was performed by comparison with sequences in the NCBI database as well as through the use of the MIPS functional catalogue database (FunCatDB). Grapevine cDNA sequences have been deposited in GenBank dbEST with the accession numbers GO652854-GO653046.
Reverse transcriptase quantitative real-time PCR (RT-qPCR) analysis
To remove any contaminating DNA in the RNA preparations, RNA was treated with TURBO DNA-free DNase I (Ambion) according to the manufac-turer’s protocol. After DNase treatment, the RNA concentration and quality was checked with the NanoDrop ND-1000 spectrophotometer (NanoDrop Technologies, Wilmingon, DE, USA). cDNAs were synthesised from 1 μg of total RNA using the Superscript III first strand synthesis system (Invitro-gen) according to the manufacturer’s instructions.
Real-time PCR reactions were performed in 96-well plates with a BioRad iQ iCycler Detection system (BioRad Laboratories, Ltd) using SYBR Green to detect dsDNA synthesis. The amount of transcripts of selected genes in P. viticola-inoculated versus mock-inoculated grapevine plants was com-pared by using the reference gene Elongation Factor 1-α (EF1-α) as endogenous reference for data normalization. Reactions were done in a total volume of 20 μl containing 200 nM of each primer, 2 μl of
1:5 diluted cDNA and 10μl 2X SYBR Green Master Mix Reagent (Bio-Rad). Reactions were run using the following cycling parameters: 95°C for 3 min, 40 cycles of 95°C for 30 s, 57°C for 35 s and 72°C for 35 s followed by a melt cycle from 60°C to 95°C. No-template controls were included for each primer pair to assess its specificity and each PCR reaction was done in triplicate. Primer sequences (Table 1) were designed with Primer Design 4 based on the sequen-ces of the selected clones. The software programme Gene-X was used to calculate the mean normalised expression of the genes (Vandesompele et al.2002). Microscopic observation
Leaf disks from P. viticola-inoculated and mock-inoculated grapevine plants were collected at two time points (4 and 7 days). Leaf disks were then used for different staining methods.
Lactophenol-trypan blue staining
To observe the structure of P. viticola, leaf disks were stained with lactophenol trypan blue according to (Keogh et al. 1980). The disks were incubated for 48 h in the staining solution and then destained with chloral hydrate (2.5 gml-1). Destained disks were kept in chloral hydrate solution and visualized with a light microscope. Hyphae, sporangiophores and sporangia stained blue.
Lignin staining
Leaf disks were boiled for 10 min in 95% ethanol and then treated with 10% phloroglucinol for 20 min and washed in 25% HCl. They were then mounted in glycerol (75%) and examined with a light microscope (Dai et al.1995).
Flavonoid staining
Staining for the presence of flavonoids was performed according to (Pina and Errea 2008). Briefly, decolor-ized leaf disks were stained for 10 min in 1% (w/v) Naturstoff reagent A (2-Aminoethyl diphenylborinate, Fluka) in ethanol and then washed 4 times with ethanol. Visualization was done under an epifluor-escence microscope with an UV filter (BP, 340– 380 nm; LP, 450 nm)
Results
Construction of the SSH library
For the construction of cDNA libraries enriched for P. viticola responsive genes, pooled Chasselas plants inoculated with P. viticola or mock-treated plants were used for the extraction of mRNA and cDNA synthesis. Reciprocal subtractions of cDNAs derived from P. viticola-infected and non-infected plants yielded two cDNA libraries, one being enriched for P. viticola-responsive genes (forward library) and the other enriched for P. viticola-repressed genes (reverse library). In total 1344 clones form the forward SSH library and 1152 from the reverse SSH library were used.
Screening of the SSH library using glass slide microarrays
According to the PCR-select differential screening kit user manual (Clonetech), 1–4% of the clones identi-fied by differential screening with inverse dot blots, turn out to be false positives. In order to select clones for sequencing and reduce the number of false positives, a more quantitative, efficient, rapid and high-throughput technique was used, namely screen-ing the forward and reverse SSH library on glass slide microarrays (as described in Van den Berg et al.
2004). In addition an analysis R software package named SSHscreen was used, which employs functions of limma (linear models for microarray data) to analyse spot intensity data, thereby screening clones in the libraries to identify those that are significantly differentially expressed (Berger et al.2007; Coetzer et al.2010). Furthermore, this method is able to identify whether the clones were derived from rare or abundant transcripts in the treated sample. Quantita-tive screening was carried out by calculating different “SSH enrichment ratios (ER)” for each clone. Calculations were based on the intensity values of each cDNA clone as a result of hybridization by the Cy dye-labelled cDNA targets. After hybridization, scanning and normalization of the data to account for intensity biases within and between slides, the SSH enrichment ratios were calculated and a statistical test was applied with a false discovery rate (FDR) of 5% to account for multiple testing. SSH enrichment ratio 3 (ER3) values were calculated as log2(FU/RU) (for
the forward library) and log2(RU/FU) (for the reverse
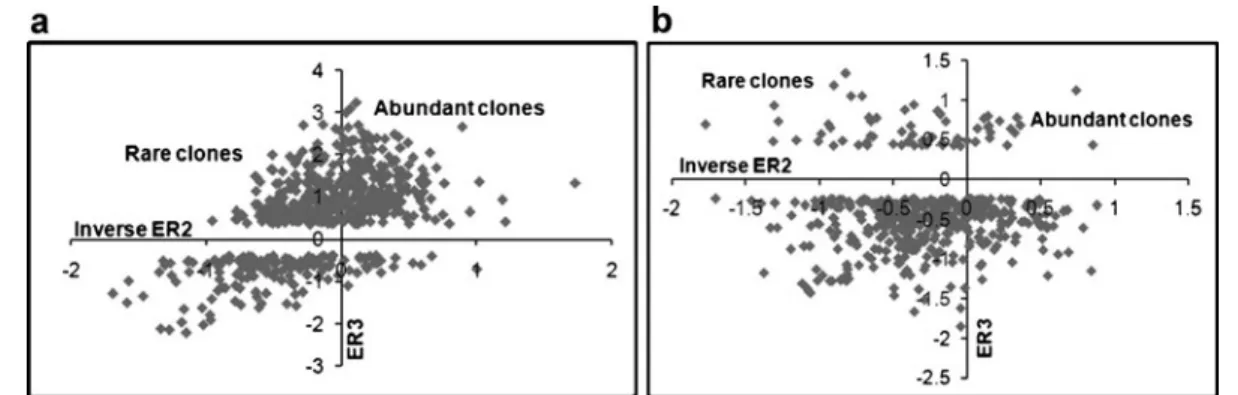
library) and gave an indication whether cDNAs were up- or down-regulated by Plasmopara infection (Fig.1).
From the forward library screening, 441 grapevine clones were significantly up-regulated in response to Plasmopara infection with a positive ER3 value (and positive B statistics at FDR of 5%) and are repre-sented in the top two quadrants of Fig.1a. A number of clones in the forward library (161) had negative ER3 values and thus fell in the bottom two quadrants of Fig. 1a, indicating that they are“down-regulated” by Plasmopara infection, which means they are false positives and thus escaped the subtraction. SSHscreen produces a similar plot from the screening of the reverse library, but in this case positive ER3 values indicate grapevine clones that were down-regulated in response to Plasmopara infection (Fig.1b). Screening of the reverse library resulted in a total of 64 clones that were down-regulated by Plasmopara infection (positive ER3 values, see top two quadrants of Fig. 1b) whereas 418 clones had negative ER values (i.e. escaped subtraction in the revere library Fig.1b). These results indicate that the efficiency of the SSH process was far better in the forward library compared to that of the reverse library (73% vs. 13%). The SSHcreen analysis thus enabled the selection of clones for DNA sequencing out of the 441 forward library clones that were scored as up-regulated, and
out of the 64 reverse library clones that were scored as down-regulated.
One of the main advantages of SSH is that it normalizes the cDNA abundance so that cDNAs encoded by genes that are expressed at low levels, but are nonetheless differentially regulated, can be identified readily. SSH enrichment ratio 2 (ER2) values were calculated as log2(FS/FU) (for the
forward library) and log2(RS/RU) (for the reverse
library) to give an indication whether cDNAs have been enriched or reduced relative to levels in the tester sample by the normalization process. Rare transcripts in Plasmopara infected plants will have negative inverse ER2 values and fall in the top left quadrant of Fig. 1a, while abundant transcripts will fall in the top right quadrant (Fig.1a). In the forward library, half of the grapevine clones up-regulated by Plasmopara infection were rare transcripts, and half were abundant (48% vs. 52%). In the reverse library, the majority (75%) of the grapevine clones down-regulated by Plasmopara infection were rare tran-scripts (top left quadrant of Fig.1b), while only 25% were abundant.
Sequencing analysis and functional classification of differentially expressed clones
No P. viticola genes were identified since the time point chosen to construct the SSH library was early, Table 1 Primers used for quantitative real-time RT-PCR
Gene name Forward primer Reverse primer
Chalcone isomerase (CHI) 5´-AACTTCTGGTAGGGACCCATCT-3´ 5´-GAAGGATGAAACCTTCCCACCA-3´ Chalcone synthase (CHS) 5´-GAGAGCAACTCGACACGTTCTG-3´ 5´-GTGTAGCAAGGCTGTGCAACAA-3´ Chitinase III (Chit III) 5´-ATCGTCTCGGCCATTAGGTGAT-3´ 5´-ATACCTTCCTTCCACGCTTGCT-3´ Cinnamate-4-hydroxylase (C4H) 5´-AGTCCAAGTCACCGAGCCTGAT-3´ 5´-TAGCAAGCCACCATGCGTTCAC-3´
EF1-α 5´-GAACGTTGCTGTGAAGGATCTC-3´ 5´-CGCCTGTCAACCTTGGTCAGTA-3´
Flavonone-3-hydroxylase (F3H) 5´-GAGAGCAACTCGACACGTTCTG-3´ 5´-CTGAAGGAGCAGCGTGATGGTT-3´ β-1,3-Glucanase (Gluc) 5´-CCAGTACAGCATCCGAAGAATGAG-3´ 5´-AACCGCAACGTATCGGAATCTGAC-3´ Heavy-metal associated protein (HMAP) 5´-CATCCACTGCCATGGAGCTT-3´ 5´-CTTCTGCCACCGACCTAATC-3´ Metallothionein (MT) 5´-TGCATGGATCGCAGTTGCAGTT-3´ 5´-TCGCACCAGTGAAGATGCACT-3´
PR-1 5´-AACGACACTGTAGCTGCCTACG-3´ 5´-GCATCGGTGCCTGTCAATGAAC-3´
PR-5 5´-TGTTGTCGTGGGATCTCACCTG-3´ 5´-CTTCAAAGGGTCAGGCAAGTGT-3´
PR-10 5´-CCAACCAATCCTCCTTGTCTT-3´ 5´-GAATCGAGGATAGAGGCCTAGC-3´
so that the amount of pathogen biomass (RNA) was very low compared to plant biomass.
A total of 223 clones were sequenced but 29 of those resulted in poor quality sequences or the sequenced insert was too short to give any BLAST results and were therefore discarded. Of the remaining 194 clones, 138 were up- and 56 down-regulated.
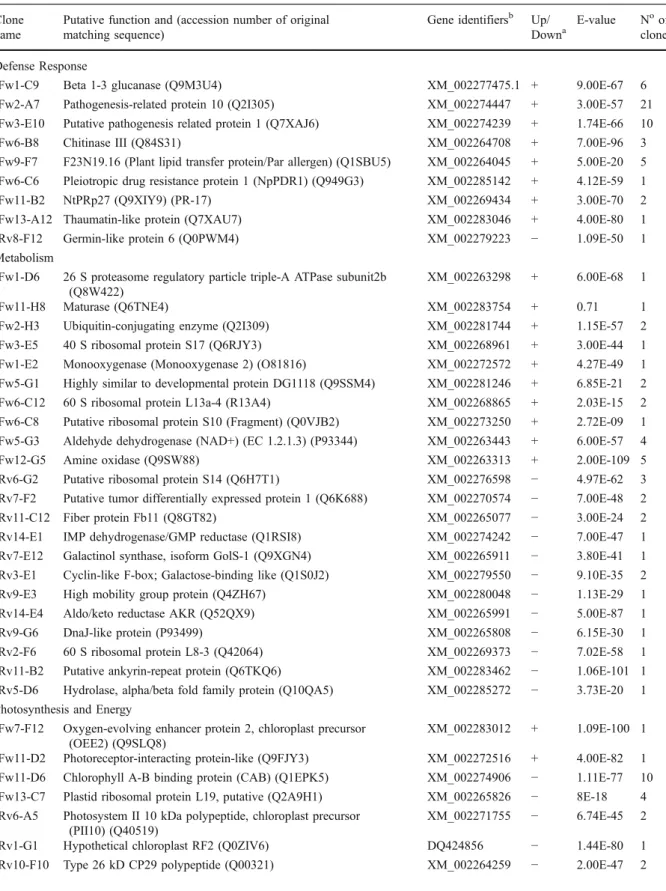
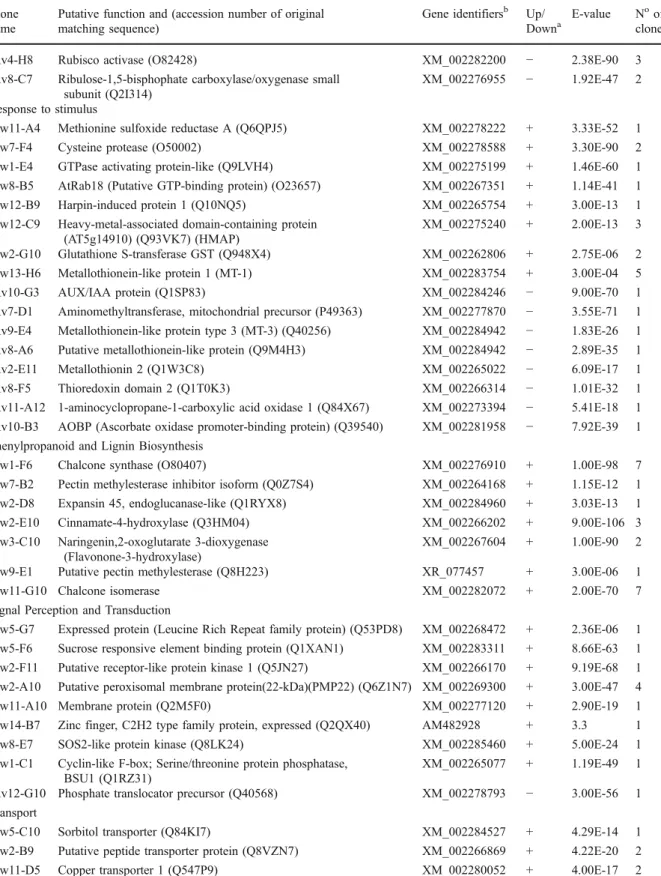
UniProt analysis of the cDNA sequences was carried out in order to identify their putative func-tions. Sequences without significant homology in the UniProt database were further analysed with BLASTx and BLASTn to predict their putative functions. Details of putative gene identities for the sequenced clones from the forward and reverse library are summarised in Table 2. Sequencing results for the 194 subtracted clones revealed only 3 clones (1.5%) that showed no similarities with known sequences within the UniProt and NCBI databases, and 6% corresponded to hypothetical proteins. Some of the clones were redundant and in these cases only one representative is shown. Redundancy resulted from the use of RsaI-restricted cDNA fragments in the SSH procedure. Because of the restriction step, two or
more different cloned cDNA fragments can represent a single transcript.
The clones that had significant sequence homolo-gies with known sequences in the UniProt and NCBI databases were divided into seven categories through the use of the MIPS functional catalogue database (FunCatDB, Ruepp et al. 2004) and extensive search of scientific literature. The distribution of the func-tional classification for genes that were both up- and down-regulated is represented in Fig. 2. The largest number of induced genes was classified under the category of defence response (24%), followed by genes involved in phenylpropanoid and lignin bio-synthesis (11%), and in metabolism (10%), whereas the largest number of repressed genes was classified under photosynthesis and energy (12.5%) followed by those involved in metabolism (9%). Induced genes involved in photosynthesis and energy and transport constituted the smallest group, comprising between 1 and 3% of the genes, respectively, while those genes involved in response to stimulus (8%) and those genes encoding hypothetical proteins (7%), were more abundant.
Fig. 1 Screening of forward (a) and reverse (b) SSH grapevine libraries on glass slide microarrays. An up/down regulation plot of enrichment ratio 3 (ER3) vs. inverse enrichment ratio 2 (ER2) is produced by the SSHscreen analysis. The clones that were calculated in SSHscreen to be statistically significantly up-regulated (ER3>0, positive B statistic, false discovery rate of 5%) after P. viticola inoculation in the forward library (a) are shown in the top two quadrants, while those that are down-regulated in the forward library (false positives) are shown in the bottom two quadrants. The inverse is true for the reverse library (b), where the top two quadrants contain clones that are significantly down-regulated after P. viticola inoculation, and the bottom two quadrants contain false positive clones that are up-regulated. The inverse ER2 values reflect the relative abundance of the transcripts for each clone in the unsubtracted cDNA samples. Thus transcripts that were rare in the cDNA
from plants inoculated with P. viticola, but also were up-regulated relative to control plants fall in the top left quadrant (a), whereas those that were abundant in the cDNA from plants inoculated with P. viticola, but also were up-regulated relative to control plants fall in the top right quadrant (a). For the reverse library, the top left and top right quadrants show transcripts that were down-regulated after inoculation with P. viticola and that were rare and abundant, respectively, in the control plants prior to subtraction (b). No clones are observed in the region of the x-axis (ER3=0), since this region would contain genes that have similar transcript levels in inoculated and mock-inoculated samples, that would have been removed by the subtraction or not plotted on Fig.1a and bsince they are not calculated to be differentially expressed when applying a FDR of 5%
Table 2 Identification of P. viticola-responsive genes isolated from the SSH library in grapevine after glass slide microarray screening Clone
name
Putative function and (accession number of original matching sequence)
Gene identifiersb Up/ Downa
E-value Noof clones Defense Response
Fw1-C9 Beta 1-3 glucanase (Q9M3U4) XM_002277475.1 + 9.00E-67 6 Fw2-A7 Pathogenesis-related protein 10 (Q2I305) XM_002274447 + 3.00E-57 21 Fw3-E10 Putative pathogenesis related protein 1 (Q7XAJ6) XM_002274239 + 1.74E-66 10
Fw6-B8 Chitinase III (Q84S31) XM_002264708 + 7.00E-96 3
Fw9-F7 F23N19.16 (Plant lipid transfer protein/Par allergen) (Q1SBU5) XM_002264045 + 5.00E-20 5 Fw6-C6 Pleiotropic drug resistance protein 1 (NpPDR1) (Q949G3) XM_002285142 + 4.12E-59 1 Fw11-B2 NtPRp27 (Q9XIY9) (PR-17) XM_002269434 + 3.00E-70 2 Fw13-A12 Thaumatin-like protein (Q7XAU7) XM_002283046 + 4.00E-80 1 Rv8-F12 Germin-like protein 6 (Q0PWM4) XM_002279223 − 1.09E-50 1 Metabolism
Fw1-D6 26 S proteasome regulatory particle triple-A ATPase subunit2b (Q8W422)
XM_002263298 + 6.00E-68 1
Fw11-H8 Maturase (Q6TNE4) XM_002283754 + 0.71 1
Fw2-H3 Ubiquitin-conjugating enzyme (Q2I309) XM_002281744 + 1.15E-57 2 Fw3-E5 40 S ribosomal protein S17 (Q6RJY3) XM_002268961 + 3.00E-44 1 Fw1-E2 Monooxygenase (Monooxygenase 2) (O81816) XM_002272572 + 4.27E-49 1 Fw5-G1 Highly similar to developmental protein DG1118 (Q9SSM4) XM_002281246 + 6.85E-21 2 Fw6-C12 60 S ribosomal protein L13a-4 (R13A4) XM_002268865 + 2.03E-15 2 Fw6-C8 Putative ribosomal protein S10 (Fragment) (Q0VJB2) XM_002273250 + 2.72E-09 1 Fw5-G3 Aldehyde dehydrogenase (NAD+) (EC 1.2.1.3) (P93344) XM_002263443 + 6.00E-57 4
Fw12-G5 Amine oxidase (Q9SW88) XM_002263313 + 2.00E-109 5
Rv6-G2 Putative ribosomal protein S14 (Q6H7T1) XM_002276598 − 4.97E-62 3 Rv7-F2 Putative tumor differentially expressed protein 1 (Q6K688) XM_002270574 − 7.00E-48 2 Rv11-C12 Fiber protein Fb11 (Q8GT82) XM_002265077 − 3.00E-24 2 Rv14-E1 IMP dehydrogenase/GMP reductase (Q1RSI8) XM_002274242 − 7.00E-47 1 Rv7-E12 Galactinol synthase, isoform GolS-1 (Q9XGN4) XM_002265911 − 3.80E-41 1 Rv3-E1 Cyclin-like F-box; Galactose-binding like (Q1S0J2) XM_002279550 − 9.10E-35 2 Rv9-E3 High mobility group protein (Q4ZH67) XM_002280048 − 1.13E-29 1 Rv14-E4 Aldo/keto reductase AKR (Q52QX9) XM_002265991 − 5.00E-87 1 Rv9-G6 DnaJ-like protein (P93499) XM_002265808 − 6.15E-30 1 Rv2-F6 60 S ribosomal protein L8-3 (Q42064) XM_002269373 − 7.02E-58 1 Rv11-B2 Putative ankyrin-repeat protein (Q6TKQ6) XM_002283462 − 1.06E-101 1 Rv5-D6 Hydrolase, alpha/beta fold family protein (Q10QA5) XM_002285272 − 3.73E-20 1 Photosynthesis and Energy
Fw7-F12 Oxygen-evolving enhancer protein 2, chloroplast precursor (OEE2) (Q9SLQ8)
XM_002283012 + 1.09E-100 1 Fw11-D2 Photoreceptor-interacting protein-like (Q9FJY3) XM_002272516 + 4.00E-82 1 Fw11-D6 Chlorophyll A-B binding protein (CAB) (Q1EPK5) XM_002274906 − 1.11E-77 10 Fw13-C7 Plastid ribosomal protein L19, putative (Q2A9H1) XM_002265826 − 8E-18 4 Rv6-A5 Photosystem II 10 kDa polypeptide, chloroplast precursor
(PII10) (Q40519)
XM_002271755 − 6.74E-45 2 Rv1-G1 Hypothetical chloroplast RF2 (Q0ZIV6) DQ424856 − 1.44E-80 1 Rv10-F10 Type 26 kD CP29 polypeptide (Q00321) XM_002264259 − 2.00E-47 2
Table 2 (continued) Clone
name
Putative function and (accession number of original matching sequence)
Gene identifiersb Up/ Downa
E-value Noof clones Rv4-H8 Rubisco activase (O82428) XM_002282200 − 2.38E-90 3 Rv8-C7 Ribulose-1,5-bisphophate carboxylase/oxygenase small
subunit (Q2I314)
XM_002276955 − 1.92E-47 2 Response to stimulus
Fw11-A4 Methionine sulfoxide reductase A (Q6QPJ5) XM_002278222 + 3.33E-52 1 Fw7-F4 Cysteine protease (O50002) XM_002278588 + 3.30E-90 2 Fw1-E4 GTPase activating protein-like (Q9LVH4) XM_002275199 + 1.46E-60 1 Fw8-B5 AtRab18 (Putative GTP-binding protein) (O23657) XM_002267351 + 1.14E-41 1 Fw12-B9 Harpin-induced protein 1 (Q10NQ5) XM_002265754 + 3.00E-13 1 Fw12-C9 Heavy-metal-associated domain-containing protein
(AT5g14910) (Q93VK7) (HMAP)
XM_002275240 + 2.00E-13 3 Fw2-G10 Glutathione S-transferase GST (Q948X4) XM_002262806 + 2.75E-06 2 Fw13-H6 Metallothionein-like protein 1 (MT-1) XM_002283754 + 3.00E-04 5 Rv10-G3 AUX/IAA protein (Q1SP83) XM_002284246 − 9.00E-70 1 Rv7-D1 Aminomethyltransferase, mitochondrial precursor (P49363) XM_002277870 − 3.55E-71 1 Rv9-E4 Metallothionein-like protein type 3 (MT-3) (Q40256) XM_002284942 − 1.83E-26 1 Rv8-A6 Putative metallothionein-like protein (Q9M4H3) XM_002284942 − 2.89E-35 1 Rv2-E11 Metallothionin 2 (Q1W3C8) XM_002265022 − 6.09E-17 1 Rv8-F5 Thioredoxin domain 2 (Q1T0K3) XM_002266314 − 1.01E-32 1 Rv11-A12 1-aminocyclopropane-1-carboxylic acid oxidase 1 (Q84X67) XM_002273394 − 5.41E-18 1 Rv10-B3 AOBP (Ascorbate oxidase promoter-binding protein) (Q39540) XM_002281958 − 7.92E-39 1 Phenylpropanoid and Lignin Biosynthesis
Fw1-F6 Chalcone synthase (O80407) XM_002276910 + 1.00E-98 7 Fw7-B2 Pectin methylesterase inhibitor isoform (Q0Z7S4) XM_002264168 + 1.15E-12 1 Fw2-D8 Expansin 45, endoglucanase-like (Q1RYX8) XM_002284960 + 3.03E-13 1 Fw2-E10 Cinnamate-4-hydroxylase (Q3HM04) XM_002266202 + 9.00E-106 3 Fw3-C10 Naringenin,2-oxoglutarate 3-dioxygenase
(Flavonone-3-hydroxylase)
XM_002267604 + 1.00E-90 2 Fw9-E1 Putative pectin methylesterase (Q8H223) XR_077457 + 3.00E-06 1
Fw11-G10 Chalcone isomerase XM_002282072 + 2.00E-70 7
Signal Perception and Transduction
Fw5-G7 Expressed protein (Leucine Rich Repeat family protein) (Q53PD8) XM_002268472 + 2.36E-06 1 Fw5-F6 Sucrose responsive element binding protein (Q1XAN1) XM_002283311 + 8.66E-63 1 Fw2-F11 Putative receptor-like protein kinase 1 (Q5JN27) XM_002266170 + 9.19E-68 1 Fw2-A10 Putative peroxisomal membrane protein(22-kDa)(PMP22) (Q6Z1N7) XM_002269300 + 3.00E-47 4 Fw11-A10 Membrane protein (Q2M5F0) XM_002277120 + 2.90E-19 1 Fw14-B7 Zinc finger, C2H2 type family protein, expressed (Q2QX40) AM482928 + 3.3 1 Fw8-E7 SOS2-like protein kinase (Q8LK24) XM_002285460 + 5.00E-24 1 Fw1-C1 Cyclin-like F-box; Serine/threonine protein phosphatase,
BSU1 (Q1RZ31)
XM_002265077 + 1.19E-49 1 Rv12-G10 Phosphate translocator precursor (Q40568) XM_002278793 − 3.00E-56 1 Transport
Fw5-C10 Sorbitol transporter (Q84KI7) XM_002284527 + 4.29E-14 1 Fw2-B9 Putative peptide transporter protein (Q8VZN7) XM_002266869 + 4.22E-20 2 Fw11-D5 Copper transporter 1 (Q547P9) XM_002280052 + 4.00E-17 2
Expression analysis of differentially responsive genes to P. viticola infection by RT-qPCR
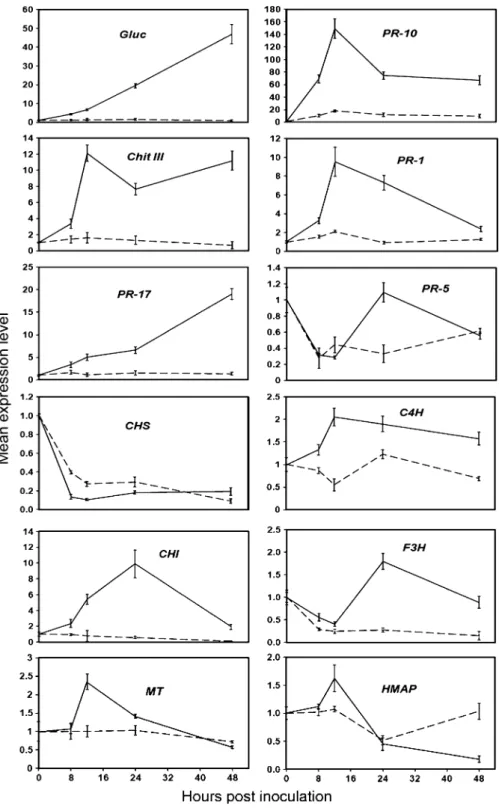
To analyse the expression patterns of a number of genes during the interaction of V. vinifera with P. viticola, reverse transcriptase quantitative real-time PCR (RT-qPCR) was performed on inoculated and mock-inoculated samples 0, 8, 12, 24 and 48 h after P. viticola inoculation. The selected genes corresponded to a range of functional categories: defence response (6 genes), phenylpropanoid and lignin biosynthesis (4 genes) and response to stimulus (2 genes) (Fig. 3). RT-qPCR was carried out with two biological replicates. Total RNA extracted from grapevine seed-lings was reverse-transcribed into first-strand cDNA, and used as template for quantitative RT-PCR analysis. Results of the time-course experiment showed that PR-genes were highly induced compared to those involved in phenylpropanoid and lignin biosynthesis and in response to stimulus, which was
in good agreement with the library verification results (data not shown). Among the PR-genes, a β-1,3-glucanase (Gluc) and a pathogenesis-related protein 10 (PR-10) showed the highest fold increase in expression level. The expression level of Gluc increased transiently over the 48 h time course, whereas the expression level of PR-10 reached a maximum level at 12 hpi, decreasing at 24 hpi and remaining constant up to 48 h. The expression pattern of a chitinase III (Chit III) was similar to that of PR-10 with the exception that after a slight decrease in expression level at 24 hpi, it increased gradually until 48 hpi. Another PR gene, pathogenesis-related protein 1 (PR-1) was induced 9.5-fold at 12 hpi where it reached maximum level and then decreased reaching levels close to the non-infected samples. Like Gluc the expression level of a pathogenesis-related protein 17 (PR-17) was transiently induced over the 48 h time course. The only defence-related gene which did not show any significant change in expression level over Table 2 (continued)
Clone name
Putative function and (accession number of original matching sequence)
Gene identifiersb Up/ Downa
E-value Noof clones Unclassified
Fw9-C9 Hypothetical protein T6H20.190 (Q9STF2) XM_002282694 + 1.10E-38 1 Fw2-E9 T17H3.3 protein (Hypothetical protein) (Similar to
CGI-126 protein) (Q9SXC8)
XM_002285545 + 3.00E-29 1 Fw6-D5 Hypothetical protein (At3g15810) (Q9LVZ8) XM_002266546 + 1.00E-22 1 Fw6-E1 Hypothetical protein T16K5.140 (Hypothetical protein
At3g49790) (Q9M2X9)
AM438165 + 2.2 1
Fw9-G4 Hypothetical protein rps12 (Q3BAI4) AM483961 + 3.00E-27 1 Fw9-G9 Hypothetical protein At2g39140 (O80967) XM_002270150 + 1.02E-24 1 Fw4-H6 Hypothetical protein (Q56ZH1) XM_002275456 + 1.24E-06 1 Fw10-D4 Hypothetical protein (Q3LSN3) XM_002279821 + 3.00E-60 1 Fw2-C7 Unnamed protein product (CAO38708.1) XM_002265072 + 4.00E-19 1 Fw1-F10 Hypothetical protein ORF1 (Q9FSX3) XM_002263298 + 7.00E-18 1
Fw1-F2 No homology + 1
Fw2-C10 No homology + 1
Fw1-E6 No homology + 1
Rv7-H8 Expressed protein (Q10Q41) XM_002271976 − 2.77E-28 1 Rv3-E12 Hypothetical protein (Q8LDM9) XM_002283263 − 2.54E-07 1 Rv8-D10 Hypothetical protein (Q1SFB2) XM_002270765 − 1.45E-10 1 Rv4-A11 Hypothetical protein (CAN65189) XM_002266869 − 4.00E-94 1
Rv9-G5 No homology − 1
a“+” means gene was induced by P. viticola from screening of the SSH libraries, and comes from the forward library, “−” means gene
was suppressed by P. viticola from screening of the SSH libraries and comes from the reverse library
b
the time course was a thaumatin-like protein (PR-5). Similarly, one of the four genes involved in phenyl-propanoid and lignin biosynthesis, namely a chalcone synthase (CHS) was down-regulated. Flavonone-3-hydroxylase (F3H) and cinnamate-4-Flavonone-3-hydroxylase (C4H) were not highly induced over the 48 h time course, both showed a 2-fold increase in expression level at 24 hpi, whereas chalcone isomerase (CHI) was induced 8-fold at 24 hpi. Of the two genes involved in response to stimulus, only a metallothionein-like protein (MT) showed a 2-fold increase in expression at 12 hpi after which the expression level decreased reaching levels of the non-infected samples at 48 hpi, whereas a heavy-metal-associated protein (HMAP) showed no significant change in expression level between infected and non-infected plants.
Microscopic observation of the response of the susceptible grapevine cv. Chasselas to P. viticola infection
To monitor response mechanisms and pathogen growth in leaves of a susceptible grapevine, leaf disks were sampled at different time points post inoculation. The development of P. viticola in the susceptible grapevine
caused visible symptoms such as curling of a heavy infected leaf, oil spots which started to undergo necrosis and sporulation on the abaxial leaf surface within 7 days after inoculation (Fig. 4a, b& c). After 4 dpi hyphal growth was observed (Fig.4d) and after 7 dpi extensive colonization of leaf tissues was observed by the presence of abundant branched hyphae and the formation of sporangiophores bearing a large number of sporangia (Fig. 4e & g). Aggregation of hyphae in the sub-stomatal cavity was observed (Fig. 4f). As expected mock-inoculated samples at 7 dpi showed no signs of infection (Fig.4o).
Lignification of the leaf tissues was observed by phloroglucinol-HCI staining leading to a red colour-ization of lignin. In the inoculated samples 2 and 4 dpi very few red-stained cells were observed (Fig. 4h & i). However at 7 dpi prominent red-stained cells were observed (Fig. 4j) evenly spread throughout the host cells and in close proximity to a stoma (Fig.4k). No lignification was observed in the mock-inoculated samples at 7 dpi (Fig. 4p)
Plant tissues stained with Naturstoff display a light yellow fluorescence that shows the presence of flavonoids. As expected, no accumulation of flavo-noids was found in the mock-inoculated samples 7dpi (Fig.4q) nor in the inoculated samples 2 dpi (Fig.4l) but at 4 dpi the presence of the light yellow fluorescence could be seen in the inoculated samples (Fig. 4m) and by 7 dpi a predominant increase in the light yellow fluorescence could be observed (Fig. 4n).
Discussion
Compatibility describes the complementary relation-ship between a plant species and an adapted pathogen which ultimately results in disease. The progression of P. viticola culminating in the appearance of oil spots (Fig. 4b) and the formation of fully developed sporangiophores with sporangia (Fig. 4e) in V. vinifera cv. Chasselas represents a compatible inter-action. Despite considerable recent progress, our understanding of many aspects of plant-biotroph compatibility is still in its early stages.
Obligate biotrophs, such as powdery and downy mildews and rust fungi, cannot be extensively cultured in vitro, since they have to form specialized infection structures, haustoria, within infected host cells. In contrast to necrotrophic and hemibiotrophic fungal Fig. 2 Functional classification of genes up- and
down-regulated in grapevine by P. viticola inoculation. Differentially expressed genes were classified into seven groups and the percentage of the genes within each category is shown
pathogens, obligate biotrophs are entirely dependent on living plant tissue for their growth and propagation. This lack of host cell death in plant-biotroph interactions might be accomplished by the pathogen’s ability to avoid or durably suppress pre-formed and induced host
defences (Mendgen and Hahn 2002). It is therefore probable that specific host genes and/or proteins are targeted by biotrophs to achieve these goals, and so be considered as compatibility factors that are essential for successful pathogenesis (Panstruga2003).
Fig. 3 Reverse transcrip-tase quantitative real-time PCR (RT-qPCR) analysis of transcript accumulation in grapevine in response to P. viticola challenge. Tran-script accumulation of Gluc, 10, Chit III, 1, PR-17, PR-5, CHS, C4H, CHI, F3H, MT and HMAP genes was monitored in mock-inoculated (dashed lines) and P. viticola-inoculated (solid line) plants. Tran-script levels of the twelve genes are expressed as rela-tive values normalized to the transcript level of EF1-α gene, used as an internal reference. Results are means of triplicate data from one representative experiment among two independent repetitions
Construction and screening of a SSH library at 24 h after P. viticola inoculation
Gene expression profiling has become a valuable tool in functional genomics. SSH is a powerful method to isolate genes that are specifically expressed under diverse sets of conditions. To better understand the molecular basis of compatibility and disease develop-ment in a grapevine-Plasmopara interaction, we used SSH to identify cDNAs that were differentially expressed in infected plants 24 h after inoculation. Recently, it was shown that rice defence genes induced in resistant plants were also induced in susceptible interactions (Vergne et al. 2007). More-over, Jantasuriyarat et al. (2005) show that the transcriptional response of a susceptible plant at 24 hpi is most similar to the response of a resistant plant at 6 hpi. They also found that the most highly induced rice genes at 24 hpi (50-fold induction) in a susceptible interaction are also induced in resistant plants (6 and 24 hpi).
Downy mildew oomycetes enter the intercellular spaces of the leaf mesophyll via stomata where they form an infection vesicle with primary hypha and the first haustorium. This mode of entry is expected to have consequences on the timing of recognition of the pathogen by the plant cells and on the nature of induced defence responses. The outcome of plant-pathogen interaction seems to be determined at the time of the subsequent penetration of intact host cells by the haustorium. Recently, two microscopy studies of the infection process of P. viticola showed that elongated hyphae with haustoria invaded the intercel-lular space of the mesophyll by 24 hpi in the resistant Vitis riparia cv. Gloire de Montpellier and in the susceptible V. vinifera cv. Muscat Ottonel (Diez-Navajas et al. 2008; Unger et al. 2007). Since it is known that the first infection steps, occurring within 24 h after inoculation are essentially the same in a resistant and in a susceptible cultivar we decided to construct the SSH library at 24 hpi. Microscopically, the main difference in infection between the two mentioned cultivars occurs within 48–72 hpi.
Recently, Polesani et al. (2008) used a cDNA-AFLP method to investigate the compatible interac-tion between P. viticola and grapevine at the oil spot stage. They found that nearly 70% of the identified differentially expressed grapevine genes were down-regulated during infection due to the exploitation of
cellular resources and the suppression of defence responses. We only found 30% and 13% of the differentially expressed genes to be down-regulated in the forward and reverse library, respectively, the main difference between these two studies being that Polesani and associates carried out their analyses at the oil spot stage, where infection has already been established, whereas our analyses was done at 24 h after inoculation, which mirrors the early stages of infection. At this time point we still expect the susceptible cultivar to try to mount a defence response.
Since the majority of the methods used to screen a SSH library involves visual inspection of inverse dot blots, this constitutes a potential source of false positives. We chose a quantitative screening method that was developed to evaluate the quality of the SSH libraries (Van den Berg et al. 2004; Berger et al.
2007). This approach facilitates the choice of clones from the library for further analysis, such as DNA sequencing, RT-qPCR, Northern blotting or detailed expression profiling using a custom cDNA microarray (Berger et al.2007). Another advantage of using this screening method with the software SSHscreen is the inclusion of statistical tests of the microarray data to provide further confidence in the choice of genes.
Defence-related genes
The differentially expressed cDNAs isolated from the SSH were classified into several categories and were involved in a number of physiological and molecular events including: metabolism, photosynthesis and energy, response to stimulus, phenylpropanoid and lignin biosynthesis, signal perception and transduc-tion, transport and defence response. A significant number of genes identified in this study that were involved in defence included PR proteins (1, PR-5, PR-10 and PR-17). PR proteins were identified several years ago as being associated with resistance of plants to various pathogens and abiotic stresses (van Loon et al.2006). Members of the PR-1, and the thaumatin-like PR-5 families have been associated with activity against oomycetes. PR-5-type proteins are thought to create trans-membrane pores and exhibit antifungal activities in vitro by blocking spore germination and germ tube growth of Uncinula necator, Phomopsis viticola and Botrytis cinerea (Monteiro et al. 2003). Interestingly, we found PR-1
to be induced as early as 12 hpi whereas PR-5 showed no induction over the 48 h time course after inoculation with P. viticola. The latter is in agreement with Kortekamp (2006), who found no difference in PR-5 expression in a susceptible and resistant cultivar after inoculation with P. viticola indicating that the PR-5’s role in defence against P. viticola remains unclear. The role of PR-1 in defence against P. viticola also remains uncertain. Interestingly, P. viticola did not induce the expression of PR-1 in the susceptible cultivar Chardonnay according to Chong et al. (2008) but PR-1 was detected 24 h following inoculation with P. viticola in V. vinifera cv. Riesling (Wielgoss and Kortekamp2006). These differences in PR-1 expression may be related to the use of different cultivars, different isolates of P. viticola, semi-quantitative versus semi-quantitative RT-PCR, or even different time points after inoculation. Chong and associates looked at PR-1 expression between 18 and 96 hpi and we found that at 48 hpi the expression level of PR-1 was already returning to basal levels close to those of the non-inoculated plants.
A large number of PR-10-related sequences have been identified in many plants. Sequence comparison indicated that PR-10 proteins are structurally related to ribonucleases. The inducible expression of PR-10 genes in response to attacks by pathogens has been widely investigated in a number of plant species. Pathogens triggering a PR-10 response include viruses, bacteria and fungi (Liu and Ekramoddoullah
2006). Some PR-10 proteins display constitutive expression patterns unrelated to the pathogen re-sponse. It has been shown that PR-10 proteins are also developmentally regulated in different plant tissues and organs, therefore it is not reasonable to assign a unique function to PR-10 proteins throughout the plant kingdom. Nevertheless, PR-10 expression was induced in grapevine after challenge with P. viticola. A strong induction of PR-10 was observed at 12 hpi which is in agreement with a number of other studies that found transcript accumulation of PR-10 in the susceptible grapevine cv. Riesling 12 hpi with P. viticola (Kortekamp2006), in rice within 12 hpi with Magnaporthe grisea (McGee et al. 2001) and in sorghum, inducible PR-10 transcripts reached a maximum level at 12 hpi (Lo et al. 1999). When taking these results into account, the induction of PR-10 may play an important role in the defence of grapevine against P. viticola.
Many pathogenesis-related proteins were first characterised in tobacco, NtPRp27, is constitutively expressed in tobacco roots but can be induced by tobacco mosaic virus, wounding, drought and by the application of ethylene, methyl jasmonate, salicylic acid and abscisic acid (Okushima et al. 2000). Recently NtPRp27 became the prototype for the new PR family PR-17. Accumulation of mRNA encoding PR-17 proteins has been reported after benzothiadia-zole treatment, inoculation with Erysiphe graminis f. sp. tritici in wheat (Gorlach et al. 1996) and inoculation with Blumeria graminis f. sp. hordei (Bgh) in barley (Christensen et al. 2002). The transient accumulation of PR-17 after P. viticola inoculation was in close agreement with both tran-script and protein accumulation in the compatible and incompatible interactions in barley in response to Bgh, diversions in these interactions occured after 72 hpi.
Two other PR proteins namely a chitinase III (PR-8) and aβ-1,3-glucanase (PR-2) were induced after P. viticola inoculation. Both PR proteins are thought to provide defence against fungal pathogens by hydro-lysing components of the cell walls of invading fungal hyphae (Mauch et al.1988). It has been shown that cell walls of P. viticola consist of chitin and β-1,3-glucan as seen on the basis of histochemical staining with specific fluorochromes, (Kortekamp
2005) therefore expression of both chitinase III and Fig. 4 Development of P. viticola and accumulation of lignin and flavonoids in the susceptible cultivar Chasselas. Plants were inoculated with sporangia of P. viticola (4 x 10⁴sporangia ml-1) (a–n), sampled 2 dpi (h and l), 4 dpi (d, i and m) and 7 dpi (a–c, e, f, g, i, j, k, and n). Mock-inoculated plants were sampled at 7 d (o–q). Infected leaves were stained with lactophenol-trypan blue and analyzed by light microscopy (d– g), stained with phloroglucinol-HCL and analyzed by light microscopy (h–k and p), or stained with Naturstoff reagent A and analyzed by epifluorescence microscopy (l–n and q). a White sporulation of P. viticola on the abaxial leaf surface; b heavily infected leaf showing typical curling symptoms; c oil spots starting to undergo necrosis on the adaxial leaf surface. d Initial hyphal growth, e extensive colonization of leaf tissues and abundant branched hyphae, f aggregation of hyphae (hy) in the sub-stomatal cavity (st), g sporangiophores bearing a large number of sporangia. h Very little amount of lignin, i presence of small amount of lignin as shown by red-coloured tissue, j increased amount of red-stained lignin in tissues, k prominent lignin deposition close to a stoma. l No presence of flavonoids at 2 dpi, m presence of flavonoids as indicated by yellow fluorescence (4 dpi), n accumulation of yellow fluorescence. o No presence of infection in mock-inoculated plants at 7d, p and q no presence of lignin and flavonoids in mock-inoculated plants respectively
β-1,3-glucanase may inhibit fungal growth. The induction of β-1,3-glucanase was transient and to much higher levels than that found for chitinase III. Interestingly, Kortekamp (2005) showed that P. viticola septa are composed ofβ-1,3-glucans but not chitin, which could trigger the host plant to increase the production of β-1,3-glucanase. Our results for chitinase III are in accordance with those of Busam et al. (1997), showing that its induction by P. viticola in both a susceptible and resistant cultivar. They also showed that chitinase III increased transiently in the healthy tissue of younger, next-stage leaves and that chitinase III was up-regulated in response to treatment with INA and BTH. Overall the results suggest that the selective expression of chitinase III is a reliable indicator of the systemic acquired resistance (SAR) response in grapevine.
We identified two other homologs involved in defence, namely a lipid transfer protein (LTP) and a pleiotropic drug resistance protein 1 (NpPDR1). LTPs are members of the family of pathogenesis-related proteins (PR-14) that are involved in plant defence responses. Plant LTPs also have developmental and tissue specificities, they are modulated by environmen-tal and stress conditions and have a number of diverse functions, including cutin biosynthesis, surface wax formation and adaptation of the plant to environmental changes. An interesting feature of LTPs is their structural similarity with elicitin, which is a small lipid-binding protein that is secreted by the phytopath-ogenic oomycetes Phytophthora and Pythium, and which triggers the hypersensitive response (HR) and SAR in tobacco (Ponchet et al.1999). A homologous gene encoding a protein of the pleiotropic drug resistance (PDR) subfamily of ATP-binding cassette (ABC) transporters was found to be induced in grapevine by P. viticola. These ABC transporters mediate the translocation of a diverse array of compounds across biological membranes, including toxins, drugs, glutathione conjugates, peptides and secondary metabolites (Yazaki 2006). There is also increasing evidence for the involvement of ABC transporters in defence. Stukkens et al. (2005) found that a PDR protein in tobacco leaves (NpPDR1) was induced following pathogen attack and silencing of NpPDR1 by RNA interference resulted in increased sensitivity to the plant pathogen Botrytis cinerea. More recently Kobae et al. (2006) demonstrated that a loss of an Arabidopsis plasma membrane-localized PDR ABC
transporter (AtPDR8) lead to hypersensitive cell death upon pathogen infection.
The only defence-related gene we found to be down-regulated in response to P. viticola infection was a germin-like protein 6 (GLP). In grapevine seven members of the GLP gene family (VvGLP) have been identified (Godfrey et al.2007). GLP genes are expressed in various organs and developmental stages in plants and in response to a number of biotic and abiotic stresses (Bernier and Berna 2001). In grapevine, expression analysis revealed that the VvGLP genes exhibited diverse and highly specific patterns of expression in response to a variety of abiotic and biotic treatments, including challenge by Erysiphe necator, P. viticola and B. cinerea. Down regulation of VvGLP6 in leaf tissue infected with P. viticola has been reported previously (Godfrey et al.
2007).
Genes involved in the phenylpropanoid and lignin biosynthesis pathway
In the general phenylpropanoid pathway, three enzy-matic transformations redirect the carbon flow from primary metabolism, transforming phenylalanine into the coenzyme A (CoA)-activated hydroxycinnamoyl thioester capable of entering the two major down-stream pathways: monolignol and flavonoid biosyn-thesis. The pathway that provides the lignin-building monolignol units is strongly activated after infection by pathogens or treatments with elicitors. In infected plants, deposition of phenylpropanoid compounds is a part of the cell wall reinforcement that restricts pathogen invasion. Accumulation of soluble and cell-wall bound phenolics in plant tissues challenged by fungal pathogens has been suggested as a defence strategy. Enzymes such as phenylalanine ammonia lyase (PAL; EC 4.3.1.5), cinnamate-4-hydroxylase (C4H; EC 1.14.13.11) and 4-coumarate:coenzyme A ligase (4CL, EC 6.2.1.12) are crucial to phenyl-propanoid metabolism. We found the expression of C4H to be induced upon P. viticola challenge peaking at 12 hpi. Sewalt et al. (1997) showed that reduced C4H activity correlated with reduced levels of lignin indicating that there could be a correlation between C4H expression and lignification. Along with the induced expression of C4H we found an increase in lignin deposition as shown through histochemical staining (Fig. 4h–k).
All flavonoids are derived from the chalcone scaffold, which is biosynthesized by the enzyme chalcone synthase (CHS). Following CHS, an assem-blage of isomerases (CHI), reductases, hydroxylases (F3H), glycosyltransferases and acyltransferases make up the basic flavonoid skeleton leading to a number of flavonoid chemical subclasses such as flavones, isoflavanoids, flavonols, flavandiols, proanthocyani-dins and anthocyanins. Even though we found the expression of CHS to be down-regulated, the other two enzymes which are involved down-stream from CHS, namely CHI and F3H, were induced by P. viticola challenge. The expression level of both CHI and F3H peaked at 24 hpi. The expression of these two genes coincided with the production of flavo-noids as seen by histochemical staining (Fig.4l–n).
In grapevine, among the best characterised defence reactions upon fungal infection, is the accumulation of stilbene phytoalexins. Resistant grape cultivars artificially inoculated with P. viticola showed high amounts of stilbenic phytoalexins at the site of infection, and these phytoalexins have significant inhibitory effects on the mobility of P. viticola zoospores (Pezet et al.2004). Chalcone synthase and stilbene synthase (STS) are further key branch-point enzymes in the phenylpropanoid pathway and their enzymatic activities and gene expression are related to phytoalexin biosynthesis in grapevine. We expect to find STS present in the SSH library since in separate studies, expression of STS in grapevine was induced after P. viticola infection (Chong et al. 2008; Kortekamp 2006). We have consistently seen that the expression of STS in P. viticola-inoculated grapevine seedlings decreases drastically at 24 hpi and remains low up to 48 hpi (Slaughter et al., unpublished results). Interestingly, Chong et al. (2008) found the expression of STS to be induced 48 h after P. viticola inoculation and not before and for that reason we were not able to identify STS in our library. We found the expression of CHS to be down-regulated and we did not find the presence of STS and since both are key enzymes in the production of stilbene phytoalexins, they could play an important role in the resistance of grapevine to P. viticola but since the SSH library was constructed from a susceptible cultivar to P. viticola, the down-regulation of CHS and the decrease in STS expression could contribute to the susceptibility of this cultivar to P. viticola.
Response to stimulus-related genes
Plant metallothioneins (MTs) are small, highly con-served cysteine-rich heavy-metal-binding proteins, typically classified into four categories (types 1 to 4). Plant MT gene expression is regulated by various factors, including metal ions, developmental stages, symbiotic interaction, and various stress responses. Stresses such as wounding and virus infection were shown to induce the expression of MT in tobacco, while differential expression of MT was detected in Arabidopsis following infection of compatible and incompatible strains of Peronospora spp. In this respect plant MTs have been proposed to function as reactive oxygen species (ROS) scavengers that protect plant DNA from oxidative damage caused by free radicals released during the oxidative burst (Wong et al. 2004). Although the majority of expressed MT genes belong to type 2, type 1, 3 and 4 MT have also been reported to be involved in various plant processes. Transcript accumulation of type 1 MT was shown in various organs and also in response to pathogen attack (Butt et al. 1998). In this study, induction of a type 1 MT was observed 12 hpi followed by a decline at 24 hpi. A plausible explanation is that the plant accumulated large amounts of MT transcripts in response to P. viticola within early stages of infection, but mRNA levels rapidly returned to levels comparable with those expressed in control plants. A similar trend of MT differential gene expression in tobacco plants follow-ing Tobacco mosaic virus (TMV) infection over a period of 72 h was observed (Choi et al. 1996). Relative amounts of MT mRNA were highly induced at 12 h, sharply dropped after 24 h following TMV infection and remained the same thereafter. We found the expression of a type 2 MT to be down-regulated in response to P. viticola challenge, which is in accordance with Wong et al. (2004) who found in rice the expression of OsMT2b to be synergistically down-regulated by OsRac1 and rice blast-derived elicitors. They also demonstrated increased susceptibility to bacterial blight and blast fungus in transgenic plants overexpressing OsMT2b. We also found a type 3 MT to be down-regulated in response to P. viticola challenge. So far there has only been one case in plants where a type 3 MT was inducible in response to pathogen attack, in velvetleaf leaves in response to Colletotrichum coccodes. (Dauch and Jabaji-Hare,
2006). Up-regulation of plant type 3 MT so far has been mostly observed as part of senescence-related responses in plants. In the case of a heavy-metal-associated domain-containing protein we did not find any induction between inoculated and control plants.
Suppression of photosynthesis-related genes
In this study, the largest group of genes suppressed in grapevine during P. viticola challenge were photosynthesis-related, namely chlorophyll a-b bind-ing protein, photosystem II polypeptide and the CP29 subunit of photosystem II. Transcriptional down-regulation of photosynthesis-related genes has previ-ously been reported for incompatible and compatible interactions (Moy et al. 2004; Restrepo et al. 2005; Vergne et al. 2007). A down-regulation of genes related to photosynthesis was shown by Polesani et al. (2008) in grapevine at the oil spot stage after challenge with P. viticola. The reason for the reduction in photosynthesis during the compatible interaction between grapevine and P. viticola is unknown, but Fung et al. (2008) have suggested that in a compatible interaction of grapevine with powdery mildew, there is an up-regulation of invertases, which are involved in degradation of carbon reserves into hexoses, resulting in the reduction of photosynthetic rates. This metabolic shift seems to be coordinated with up-regulation of genes involved in the synthesis of secondary metabolites (flavonoids and lignin) via the oxidative pentose phosphate and shikimate path-way. Increased invertase activity leads to carbohy-drate accumulation, which in turn may inhibit the Calvin cycle, which also limits photosynthesis. Two genes encoding enzymes involved in the Calvin cycle, namely rubisco activase and ribulose-1,5-bisphos-phate carboxylase/oxygenase small subunit were down-regulated.
Metabolism-associated genes
Proteolysis of important regulatory proteins is a key aspect of cellular regulation in eukaryotes and there is evidence that the ubiquitin-proteasome pathways are important in implementation of the plant defence response. In response to pathogen attack, the Ub/26 S proteasome pathway initiates programmed cell death to localise pathogen spread (Smalle and Vierstra
2004). We found homologs of a 26 S proteasome
and an ubiquitin-conjugating enzyme to be up-regulated in grapevine in response to P. viticola.
In summary, the SSH method has allowed us to generate a differential cDNA library enriched for Plasmopara-responsive genes from grapevine seed-lings. This is the first large-scale investigation into the early response (24 hpi) of compatibility between V. vinifera and the biotrophic pathogen P. vitocola. Polesani et al. (2008) performed cDNA-AFLP anal-ysis on a compatible interaction of grapevine with P. viticola on the oil spot stage of infection which follows 2–3 weeks after inoculation; this could be defined as a late response to pathogen challenge, whereas we were interested in analyzing the early response to P. viticola challenge. Even though we are dealing with a susceptible cultivar to P. viticola challenge, the host plant was still able to mount a defence response as seen by the number of genes identified which are involved in defence mechanisms. Further characterization and functional analysis of the genes generated from the library will facilitate our understanding of the defence mechanisms in grape-vine plants to P. viticola infection.
Acknowledgements This project was funded by the National Centre of Competence in Research (NCCR) Plant Survival, a research programme of the Swiss National Science Foundation. We thank Mrs. M. Waldner (Syngenta, Stein, Switzerland) for the grapevine seedlings and Dr J. Weber (Lausanne DNA Array Facility, University of Lausanne) for the assistance in the making of the SSH slides for the microarray screening.
References
Adams, M. D., Kelley, J. M., Gocayne, J. D., Dubnick, M., Polymeropoulos, M. H., Xiao, H., et al. (1991). Comple-mentary DNA sequencing: expressed sequence tags and human genome project. Science, 252, 1651–1656. Allegre, M., Daire, X., Heloir, M. C., Trouvelot, S., Mercier, L.,
Adrian, M., et al. (2007). Stomatal deregulation in Plasmopara viticola-infected grapevine leaves. The New Phytologist, 173, 832–840.
Aziz, A., Poinssot, B., Daire, X., Adrian, M., Bezier, A., Lambert, B., et al. (2003). Laminarin elicits defense responses in grapevine and induces protection against Botrytis cinerea and Plasmopara viticola. Molecular Plant-Microbe Interactions, 16, 1118–1128.
Berger, D. K., Crampton, B. G., Hein, I., & Vos, W. (2007). Screening of cDNA libraries on glass slide microarrays. Methods in Molecular Biology, 382, 177–203.
Bernier, F., & Berna, A. (2001). Germins and germin-like proteins: Plant do-all proteins. But what do they do exactly? Plant Physiology and Biochemistry, 39, 545–554.
Birch, P. R. J., Avrova, A. O., Duncan, J. M., Lyon, G. D., & Toth, R. L. (1999). Isolation of potato genes that are induced during an early stage of the hypersensitive response to Phytophthora infestans. Molecular Plant-Microbe Interactions, 12, 356–361.
Brenner, S., Johnson, M., Bridgham, J., Golda, G., Lloyd, D. H., Johnson, D., et al. (2000). Gene expression analysis by massively parallel signature sequencing (MPSS) on microbead arrays. Nature Biotechnology, 18, 630–634. Busam, G., Kassemeyer, H. H., & Matern, U. (1997).
Differential expression of chitinases in Vitis vinifera L. responding to systemic acquired resistance activators or fungal challenge. Plant Physiology, 115, 1029–1038. Butt, A., Mousley, C., Morris, K., Beynon, J., Can, C., Holub,
E., et al. (1998). Differential expression of a senescence-enhanced metallothionein gene in Arabidopsis in response to isolates of Peronospora parasitica and Pseudomonas syringae. The Plant Journal, 16, 209–221.
Choi, D., Kim, H. M., Yun, H. K., Park, J. A., Kim, W. T., & Bok, S. H. (1996). Molecular cloning of a metallothionein-like gene from Nicotiana glutinosa L. and its induction by wounding and tobacco mosaic virus infection. Plant Physiology, 112, 353–359.
Chong, J., Le Henanff, G., Bertsch, C., & Walter, B. (2008). Identification, expression analysis and characterization of defense and signaling genes in Vitis vinifera. Plant Physiology and Biochemistry, 46, 469–481.
Christensen, A. B., Cho, B. H., Naesby, M., Gregersen, P. L., Brandt, J., Madriz-Ordenana, K., et al. (2002). The molecular characterization of two barley proteins estab-lishes the novel PR-17 family of pathogenesis-related proteins. Molecular Plant Pathology, 3, 135–144. Coetzer, N., Gazendam, I., Oelofse, D., & Berger, D. K. (2010).
SSHscreen and SSHdb, generic software for microarray based gene discovery: application to the stress response in cowpea. Plant Methods, 6, 10.
Dai, G. H., Andary, C., Mondolot-Cosson, L., & Boubals, D. (1995). Histochemical studies on the interaction between three species of grapevine Vitis vinifera, V. rupestris and V. rotundifolia and the downy fungus, Plasmopara viticola. Physiological and Molecular Plant Pathology, 46, 177–188. Dauch, A. L., & Jabaji-Hare, S. H. (2006). Metallothionein and bZIP Transcription Factor Genes from Velvetleaf and Their Differential Expression Following Colletotrichum coccodes Infection. Phytopathology, 96, 1116–1123. Degenhardt, J., Al-Masri, A. N., Kurkcuoglu, S., Szankowski,
I., & Gau, A. E. (2005). Characterization by suppression subtractive hybridization of transcripts that are differen-tially expressed in leaves of apple scab-resistant and susceptible cultivars of Malus domestica. Molecular Genetics and Genomics, 273, 326–335.
Derckel, J. P., Baillieul, F., Manteau, S., Audran, J. C., Haye, B., Lambert, B., et al. (1999). Differential Induction of Grapevine Defenses by Two Strains of Botrytis cinerea. Phytopathology, 89, 197–203.
Diez-Navajas, A. M., Wiedemann-Merdinoglu, S., Greif, C., & Merdinoglu, D. (2008). Nonhost versus host resistance to the grapevine downy mildew, Plasmopara viticola, studied at the tissue level. Phytopathology, 98, 776–780. Fung, R. W., Gonzalo, M., Fekete, C., Kovacs, L. G., He, Y.,
Marsh, E., et al. (2008). Powdery mildew induces
defense-oriented reprogramming of the transcriptome in a suscep-tible but not in a resistant grapevine. Plant Physiology, 146, 236–249.
Gindro, K., Pezet, R., & Viret, O. (2003). Histological study of the responses of two Vitis vinifera cultivars (resistant and susceptible) to Plasmopara viticola infections. Plant Physiology and Biochemistry, 41, 846–853.
Glazebrook, J. (2005). Contrasting mechanisms of defense against biotrophic and necrotrophic pathogens. Annual Review of Phytopathology, 43, 205–227.
Godfrey, D., Able, A. J., & Dry, I. B. (2007). Induction of a grapevine germin-like protein (VvGLP3) gene is closely linked to the site of Erysiphe necator infection: a possible role in defense? Molecular Plant-Microbe Interactions, 20, 1112–1125.
Gorlach, J., Volrath, S., Knauf-Beiter, G., Hengy, G., Beckhove, U., Kogel, K. H., et al. (1996). Benzothiadiazole, a novel class of inducers of systemic acquired resistance, activates gene expression and disease resistance in wheat. The Plant Cell, 8, 629–643.
Hamiduzzaman, M. M., Jakab, G., Barnavon, L., Neuhaus, J. M., & Mauch-Mani, B. (2005). beta-Aminobutyric acid-induced resistance against downy mildew in grapevine acts through the potentiation of callose formation and jasmonic acid signaling. Molecular Plant-Microbe Interactions, 18, 819– 829.
Heath, M. C. (2000). Nonhost resistance and nonspecific plant defenses. Current Opinion in Plant Biology, 3, 315–319. Iandolino, A. B., Goes da Silva, F., Lim, H., Choi, H.,
Williams, L. E., & Cook, D. R. (2004). High-quality RNA, cDNA, and dervided EST libraries from grapevine (Vitis vinifera L.). Plant Molecular Biology Reporter, 22, 269–278.
Jantasuriyarat, C., Gowda, M., Haller, K., Hatfield, J., Lu, G., Stahlberg, E., et al. (2005). Large-scale identification of expressed sequence tags involved in rice and rice blast fungus interaction. Plant Physiology, 138, 105–115. Keogh, R. C., Deverall, B. J., & McLeod, S. (1980).
Comparison of histological and physiological responses to Phakoopsora pachyrhizi in resistant and susceptible soybean. Transactions of the British Mycological Society, 74, 328–333.
Kobae, Y., Sekino, T., Yoshioka, H., Nakagawa, T., Martinoia, E., & Maeshima, M. (2006). Loss of AtPDR8, a plasma membrane ABC transporter of Arabidopsis thaliana, causes hypersensitive cell death upon pathogen infection. Plant & Cell Physiology, 47, 309–318.
Kortekamp, A. (2005). Growth, occurrence and development of septa in Plasmopara viticola and other members of the Peronosporaceae using light- and epifluorescence-microscopy. Mycological Research, 109, 640–648. Kortekamp, A. (2006). Expression analysis of defence-related
genes in grapevine leaves after inoculation with a host and a non-host pathogen. Plant Physiology and Biochemistry, 44, 58–67.
Kortekamp, A., & Zyprian, E. (2003). Characterization of Plasmopara-resistance in grapevine using in vitro plants. Journal of Plant Physiology, 160, 1393–1400.
Liu, J. J., & Ekramoddoullah, A. K. M. (2006). The family 10 of plant pathogenesis-related proteins: Their structure, regulation, and function in response to biotic and abiotic