*Corresponding author: Gian Camenisch, Novartis Pharma AG, Postfach, 4002 Basel, Switzerland, Phone: +41 616968583, Fax: +41 792785817, E-mail: [email protected]; and Drug-Drug Interactions Section, Novartis Institutes for BioMedical Research, Division of Drug Metabolism and Pharmacokinetics, Basel, Switzerland
Annett Kunze: Drug-Drug Interactions Section, Novartis Institutes for BioMedical Research, Division of Drug Metabolism and Pharmacokinetics, Basel, Switzerland; and Division of Pharmaceutical Technology, Department of Pharmaceutical Sciences, University of Basel, Basel, Switzerland
Birk Poller: Drug-Drug Interactions Section, Novartis Institutes for BioMedical Research, Division of Drug Metabolism and Pharmacokinetics, Basel, Switzerland
Jörg Huwyler: Division of Pharmaceutical Technology, Department of Pharmaceutical Sciences, University of Basel, Basel, Switzerland
Annett Kunze, Birk Poller, Jörg Huwyler and Gian Camenisch*
Application of the extended clearance concept
classification system (ECCCS) to predict the victim
drug-drug interaction potential of statins
Abstract
Background: During drug development, it is an
impor-tant safety factor to identify the potential of new molecu-lar entities to become a victim of drug-drug interactions (DDIs). In preclinical development, however, anticipation of clinical DDIs remains challenging due to the lack of in
vivo human pharmacokinetic data.
Methods: We applied a recently developed in vitro-in vivo
extrapolation method, including hepatic metabolism and transport processes, herein referred to as the Extended Clearance Concept Classification System (ECCCS). The human hepatic clearances and the victim DDI potentials were predicted for atorvastatin, cerivastatin, fluvastatin, lovastatin acid, pitavastatin, pravastatin, rosuvastatin, and simvastatin acid.
Results: Hepatic statin clearances were well-predicted
by the ECCCS with six out of eight clearances projected within a two-fold deviation to reported values. In addi-tion, worst-case DDI predictions were projected for each statin. Based on the ECCCS class assignment (4 classes), the mechanistic interplay of metabolic and transport pro-cesses, resulting in different DDI risks, was well-reflected by our model. Furthermore, predictions of clinically observed statins DDIs in combination with relevant per-petrator drugs showed good quantitative correlations with clinical observations.
Conclusions: The ECCCS represents a powerful tool to
anticipate the DDI potential of victim drugs based on
in vitro drug metabolism and transport data.
Keywords: clearance prediction; drug-drug interactions
(DDIs) prediction; in vitro-in vivo extrapolation (IVIVE); statins.
DOI 10.1515/dmdi-2015-0003
Received January 29, 2015; accepted April 8, 2015; previously published online May 21, 2015
Introduction
Statins are 3-hydroxy-3-methylglutaryl-coenzyme A (HMG-CoA) reductase inhibitors indicated for the treatment of hypercholesterolemia [1]. They are widely used to lower the risk of cardiovascular disease. In 2012, rosuvastatin, simvastatin, and atorvastatin were among the 15 most prescribed drugs in the United States. Myotoxicity and rare cases of severe rhabdomyolysis are reported adverse events following statin treatment though. In 2001, ceriv-astatin was therefore withdrawn from the market due to incidents of fatal rhabdomyolysis, which were partially attributed to drug-drug interactions (DDIs) following co-medication with gemfibrozil [2].
For several statins, hepatic elimination is described as interplay of drug transport and metabolism processes. Expressed at the basolateral membrane of hepatocytes, the organic anion transporting polypeptides (OATP) 1B1, 1B3, and 2B1 as well as the organic anion transporter (OAT) 2 and the sodium taurocholate co-transporting poly-peptide (NTCP) are known to be involved in the hepatic uptake of various statins. Subsequent biliary secretion is mediated by apically expressed efflux transporters including P-glycoprotein (P-gp), the multidrug-resistance associated protein (MRP) 2, and the breast cancer resist-ance protein (BCRP) [3]. Hepatic metabolism of statins is predominantly mediated by enzymes of the cyto-chrome P450 (CYP) family including CYP3A4, CYP2C8, and CYP2C9 [1]. Moreover, glucuronidation mediated by
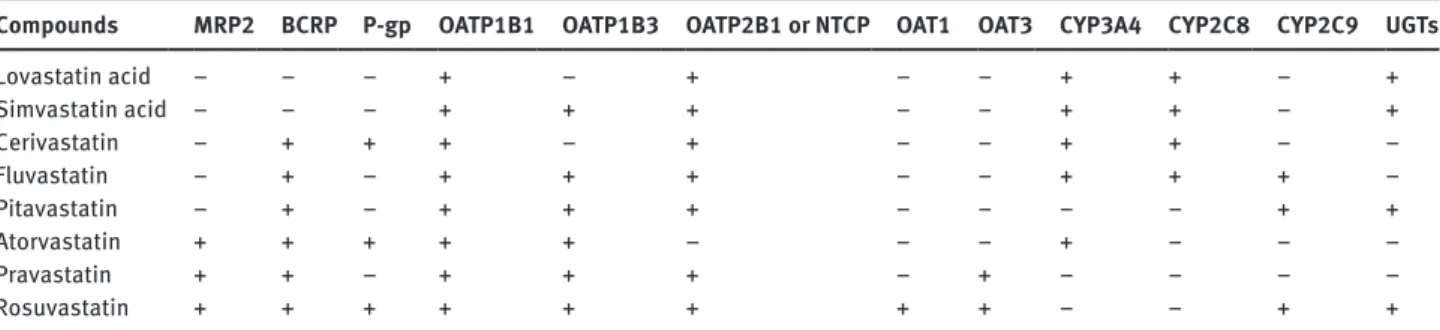
UDP-glucuronosyltransferases (UGTs) is involved in the metabolism of several statins [4]. Thus, each statin exhib-its a unique and complex pharmacokinetic profile due to specific transporter- and/or enzyme-mediated clearance mechanisms (Table 1). Inhibition of one or several of these clearance pathways upon co-medication of the statins (so-called victim drug) with a perpetrator compound might therefore ultimately result in alterations of drug exposure.
Recently, our group established a novel method to predict the human hepatic drug clearance based on a mechanistic in vitro-in vivo extrapolation (IVIVE) model [5, 6]. The approach is based on incorporation of in vitro data for all physiological hepatic drug elimination pro-cesses into the extended mechanistic hepatic clearance model, allowing the assessment of the rate-determining hepatic clearance step. Based on this approach, drugs can be classified according to their in vitro determined major clearance mechanism. Similar to the Biopharmaceutics Drug Disposition Classification System (BDDCS), which is based on the extent of in vivo observed drug metabolism and in vitro solubility data [7], our approach from here on referred as Extended Clearance Concept Classifica-tion System (ECCCS), categorizes drugs into four classes. For highly permeable class 1 and 2 compounds, metabo-lism is projected as the major hepatic clearance process. While passive hepatic uptake is the rate-determining step for class 1 compounds, the sum of metabolism and efflux transporter-mediated biliary elimination is predicted to be rate-determining for class 2 compounds. Active hepatic uptake is predicted to be the rate-determining step for class 3 compounds, while the clearance of class 4 com-pounds is dependent on the interplay of all processes involved in hepatic elimination (namely metabolism, uptake, and efflux). Thus, based on the extended mecha-nistic clearance concept, application of the ECCCS allows for a compound-class dependent assessment of the DDI potential of (new) chemical entities.
In this study, we used statins as model drugs to further validate our new in vitro data-based extended mechanis-tic hepamechanis-tic clearance model. Human hepamechanis-tic clearances were predicted for all marketed statins: atorvastatin, flu-vastatin, lovastatin acid, pitaflu-vastatin, praflu-vastatin, rosuv-astatin, and simvastatin acid as well as for cerivastatin. Subsequently, we assessed the DDI potential of each statin by simulating inhibition of the relevant hepatic clearance processes. The predicted DDI effects were compared with reported AUC changes from clinical studies [8–10], and the underlying mechanisms driving the DDI potential for each statin were discussed within the frame of the ECCCS.
Materials and methods
Materials
[3H]atorvastatin calcium (0.37 MBq/nmol), [3H]cerivastatin sodium
(0.185 MBq/nmol), [3H]fluvastatin sodium (0.74 MBq/nmol), [3
H]lov-astatin acid (0.37 MBq/nmol), [3H]pitavastatin calcium (0.185 MBq/
nmol), [3H]pravastatin sodium (0.185 MBq/nmol), [3
H]rosuvasta-tin calcium (0.37 MBq/nmol), and [3H]simvastatin acid (0.37 MBq/
nmol) were obtained from American Radiolabeled Chemicals, Inc. (Saint Louis, MO, USA). [3H]taurocholic acid (TCA; 0.185 MBq/nmol)
was purchased from PerkinElmer (Boston, MA, USA). All other com-pounds and reagents were of analytical grade and purchased from commercial sources. Human sandwich-cultured hepatocytes were purchased as B-CLEAR® kits from Qualyst, Inc. (Durham, NC, USA).
Hepatocytes from five different donors were used in this study (all Caucasian females, average age of 61). Donor information for human suspension hepatocytes and liver microsomes were previously described in detail [11, 12].
Hepatic clearance prediction
According to the extended mechanistic clearance concept (Figure 1), the overall apparent hepatic intrinsic clearance can be described as follows [6]:
Table 1: Overview of active processes involved in statin transport and/or metabolism.
Compounds MRP2 BCRP P-gp OATP1B1 OATP1B3 OATP2B1 or NTCP OAT1 OAT3 CYP3A4 CYP2C8 CYP2C9 UGTs
Lovastatin acid − − − + − + − − + + − + Simvastatin acid − − − + + + − − + + − + Cerivastatin − + + + − + − − + + − − Fluvastatin − + − + + + − − + + + − Pitavastatin − + − + + + − − − − + + Atorvastatin + + + + + − − − + − − − Pravastatin + + − + + + − + − − − − Rosuvastatin + + + + + + + + − − + +
+: Identified transporter/enzyme substrate (qualitative information) as available in the literature. (References and anticipated quantitative pathway contributions to overall drug elimination [as available] are given in the manuscript.) −: Not described.
All values for CLint,met refer to incubations with human liver
micro-somes. Moreover, we assumed that efflux over the sinusoidal mem-brane from hepatocytes back into the blood occurred via passive diffusion only (i.e., PSeff,act = 0) and that the passive sinusoidal efflux
was equal to the passive influx (i.e., PSeff,pas = PSinf,pas). Subsequently,
the hepatic in vivo clearance (CLh) was predicted based on the
“well-stirred liver” model as follows [6]:
h
h u,b in,f ,act inf,pas int,sec int,met
h inf ,pas int,sec int,met u,b in,f ,act inf ,pas int,sec int,met
CL Q f ( PS PS ) (CL CL ) Q ( PS CL CL ) f ( PS PS ) (CL CL ) = ⋅ ⋅ + ⋅ + ⋅ + + + ⋅ + ⋅ + (2) where Qh is the hepatic blood flow [20.7 mL/(min·kg)] and fu,b is
the unbound fraction of statins in blood as reported in literature (Table 2).
DDI assessment
A perpetrator drug may inhibit all active clearance pathways con-tributing to the total hepatic elimination of a substrate compound. Accordingly, based on Eq. 1, the overall apparent hepatic intrinsic clearance in the presence of a perpetrator (CLh,int,i) can be expressed
as follows [6]:
h,int,i
i,inf in,f ,act inf,pas i,sec int,sec i,met int,met inf,pas i,sec int,sec i,met int,met
CL (( 1 f ) PS PS ) (( 1 f ) CL ( 1 f ) CL ) ( PS ( 1 f ) CL ( 1 f ) CL ) = − ⋅ + ⋅ − ⋅ + − ⋅ + − ⋅ + − ⋅ (3)
where fi,inf, fi,sec, and fi,met denote the inhibited fractions of active
influx, secretion, or metabolism, respectively. A value of zero thereby indicates no inhibition whereas a value of one refers to complete inhibition. Based on this relationship, the hepatic in vivo clearance in the presence of any perpetrator compound (CLh,i) can be calculated
in accordance with Eq. 2.
Following oral administration of a drug and its perpetrator, assuming the presence of hepatic and a non-hepatic (e.g., renal) elimination pathways and that the perpetrator drug only affects active processes in the liver, the exposure (AUC) fold-change (expressed as AUCpo,i/AUCpo) can be described as follows [13]:
inf,act inf,pas int,sec int,met h,int
eff,act eff,pas int,sec int,met
( PS PS ) (CL CL ) CL =( PS +PS ⋅CL +CL )
+ + + (1)
where PSinf,act and PSinf,pas are the active and passive hepatic influx
clearances from the blood, respectively, CLint,sec is the intrinsic biliary
secretion clearance, and CLint,met is the intrinsic metabolic clearance.
PSeff,act and PSeff,pas describe the active and passive sinusoidal efflux
from the hepatocytes back into the blood, respectively.
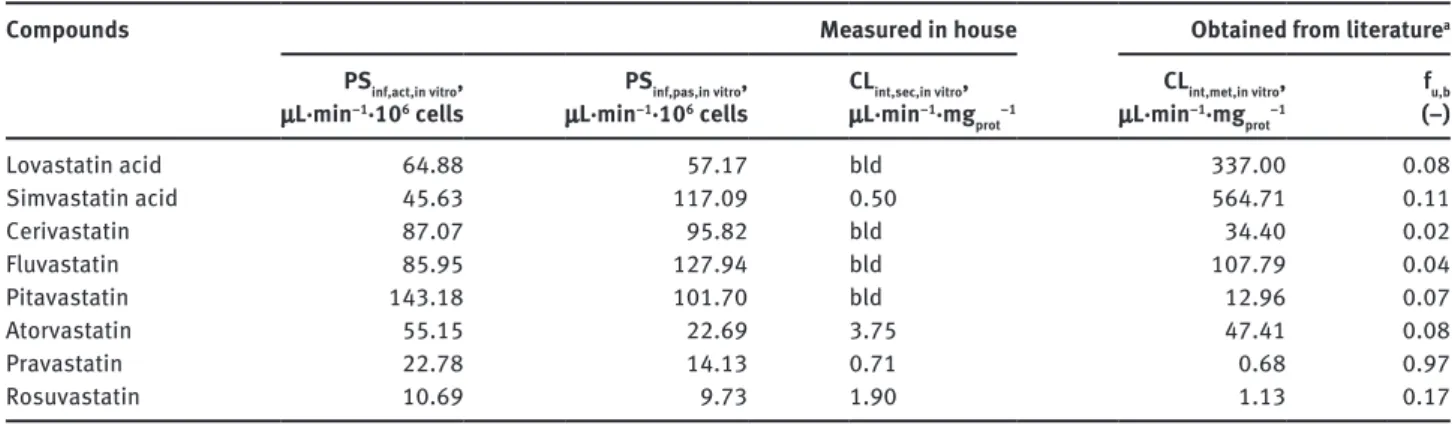
All above parameters were determined experimentally (Table 2) [5, 6, 12]. For the present assessment, in vitro transport and metabolism data were taken from different in-house and lit-erature sources as summarized in the Supplementary Material, Table 1, that accompanies the article at http://www.degruyter.com/ view/j/dmdi.2015.30.issue-2/dmdi-2015-0003/dmdi-2015-0003. xml?format=INT. PSinf,act and PSinf,pas data were assessed in
sus-pended hepatocytes using a standardized in-house method [12]. CLint,sec was determined in human sandwich-cultured hepatocyte
incubations using the B-CLEAR® assay (single concentration
deter-minations at 0.1 μM) assuming that metabolism was negligible [6].
Blood Liver PSinf PS eff CLint,met CLint,sec CLh,int Portal vein
Hepatic artery Hepatic vein
Figure 1: Mechanisms of drug elimination in the liver according to the extended mechanistic clearance concept.
From the bloodstream, drugs are taken up into hepatocytes (PSinf)
via transporters and/or passive diffusion, followed by intracellular metabolism (CLint,met) and/or active secretion into bile (CLint,sec).
Additionally, drugs can be actively and/or passively effluxed back into the circulation via the sinusoidal membrane (PSeff).
Conse-quently, for each statin, the hepatic intrinsic clearance (CLh,int)
results from the interplay of the underlying clearance processes (see Eq. 1).
Table 2: In vitro pharmacokinetic parameters. Compounds
Measured in house Obtained from literature
a PSinf,act,in vitro, μL·min−1·106 cells PSinf,pas,in vitro, μL·min−1·106 cells CLint,sec,in vitro, μL·min−1·mg prot−1 CLint,met,in vitro, μL·min−1·mg prot−1 fu,b (−) Lovastatin acid 64.88 57.17 bld 337.00 0.08 Simvastatin acid 45.63 117.09 0.50 564.71 0.11 Cerivastatin 87.07 95.82 bld 34.40 0.02 Fluvastatin 85.95 127.94 bld 107.79 0.04 Pitavastatin 143.18 101.70 bld 12.96 0.07 Atorvastatin 55.15 22.69 3.75 47.41 0.08 Pravastatin 22.78 14.13 0.71 0.68 0.97 Rosuvastatin 10.69 9.73 1.90 1.13 0.17
aLiterature references are provided in the Supplementary Material (Table 1). bld, below limit of detection (zeroed for all subsequent
po,i h,i
po h n,h h,i h n,h
AUC F 1
AUC =F f CL /CL 1 f⋅ ⋅ + − (4) Fn,h is the fractional contribution of hepatic clearance to
over-all clearance. (Details for the clinical determination of fn,h are
pro-vided in the Supplementary Material, Table 2.) Fh ( = 1−CLh/Qh) and
Fh,i ( = 1−CLh,i/Qh) are the fractions of the oral dose escaping hepatic
firstpass in the absence and presence of a perpetrator, respectively. Under the additional assumption that the liver is the only clear-ance organ (i.e., fn,h = 1), Eq. 4 simplifies with [14]:
po,i h,int po h,int,i
AUC CL
AUC =CL (5)
Statistical analysis
Linear correlation analyses were performed to obtain the regres-sion equation and the correlation coefficient (R2) using Microsoft
Excel. Average fold errors (afe), predicting the accuracy between the observed and predicted parameters, were calculated with [15]:
1 logpredicted observed
afe 10= N∑ (6)
Results
The experimentally determined in vitro parameters for hepatic influx, metabolism, and biliary secretion are listed in Table 2. The up-scaled process parameters, the projected overall apparent hepatic intrinsic clear-ances according to Eq. 1 and the predicted in vivo hepatic
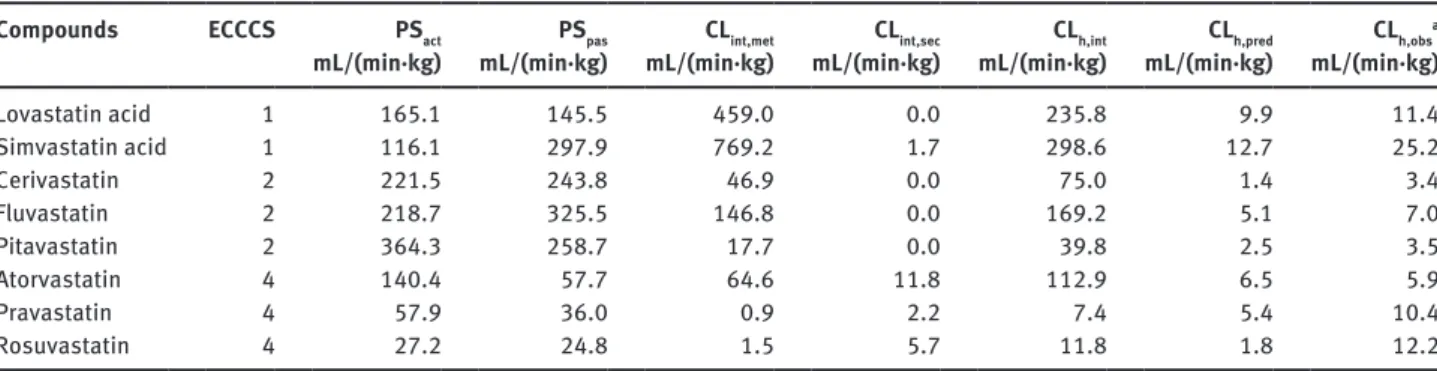
organ clearances (CLh,pre) according to Eq. 2 are given in
Table 3. Moreover, Table 3 lists the in vivo observed hepatic
clearances (CLh,obs) which were derived from human mass
balance studies taking the in vivo determined renal clear-ances into account.
As shown in Table 3, the values for the different physio-logical processes driving hepatic elimination differ sig-nificantly for the eight statins in our dataset. Highest net hepatic influx values, exceeding 500 mL/(min·kg), were obtained for pitavastatin and fluvastatin, while prava-statin and rosuvaprava-statin showed comparatively low values [ < 100 mL/(min·kg)]. Simvastatin acid, cerivastatin, and fluvastatin exhibited a high contribution of passive influx
to the total net influx (PSinf,pas > PSinf,act). The up-scaled
CLint,met ranged from 0.9 mL/(min·kg) for pravastatin to
769.2 mL/(min·kg) for simvastatin acid. Up-scaled CLint,sec
was highest for atorvastatin [11.8 mL/(min·kg)] whereas no biliary secretion at all could be experimentally deter-mined for lovastatin acid, cerivastatin, fluvastatin, and pitavastatin. The predicted intrinsic clearances ranged from 7.4 mL/(min·kg) measured for pravastatin to 298.6 mL/(min·kg) obtained for simvastatin acid.
Anticipation of hepatic clearance
The correlation between the in vitro predicted and in vivo observed hepatic clearances is illustrated in Figure 2. Six out of eight statins (atorvastatin, fluvastatin, lovastatin acid, pitavastatin, pravastatin, and simvastatin acid) were predicted within two-fold deviation from the clinically observed value, while cerivastatin and rosuvastatin were under-predicted by more than two- and six-fold, respec-tively. Excluding rosuvastatin a good overall accuracy of prediction is achieved as indicated by an average fold
Table 3: Predicted pharmacokinetic parameters. Compounds ECCCS PSact
mL/(min·kg) mL/(min·kg)PSpas mL/(min·kg)CLint,met mL/(min·kg)CLint,sec mL/(min·kg)CLh,int mL/(min·kg)CLh,pred CLh,obs
a mL/(min·kg) Lovastatin acid 1 165.1 145.5 459.0 0.0 235.8 9.9 11.4 Simvastatin acid 1 116.1 297.9 769.2 1.7 298.6 12.7 25.2 Cerivastatin 2 221.5 243.8 46.9 0.0 75.0 1.4 3.4 Fluvastatin 2 218.7 325.5 146.8 0.0 169.2 5.1 7.0 Pitavastatin 2 364.3 258.7 17.7 0.0 39.8 2.5 3.5 Atorvastatin 4 140.4 57.7 64.6 11.8 112.9 6.5 5.9 Pravastatin 4 57.9 36.0 0.9 2.2 7.4 5.4 10.4 Rosuvastatin 4 27.2 24.8 1.5 5.7 11.8 1.8 12.2
aLiterature references and calculation details are provided in the Supplementary Material, Table 2. Up-scaling of the in vitro clearances
(Table 2) to human in vivo organ level was performed with the help of the following scaling factors: 1.6 (mg protein)/(1·106 cells) and
99 (106 cells)/(g liver) for suspended hepatocytes; 53 (mg protein)/(g liver) for liver microsomes; 116 (mg protein)/(g liver) for
sandwich-cultured hepatocytes and 25.7 (g liver)/(kg body weight) for liver weight [16, 17]. CLh,int and CLh,pred were calculated according to Eqs. 1 and 2,
respectively. Cut-off values for ECCCS class assignments were defined as previously described [6]: Class 1/2 if PSpas > 3 × Qh (20.7 mL/min/kg),
other reasons eventually leading to IVIVE disconnects are discussed below.
Drug-drug interaction potential projections
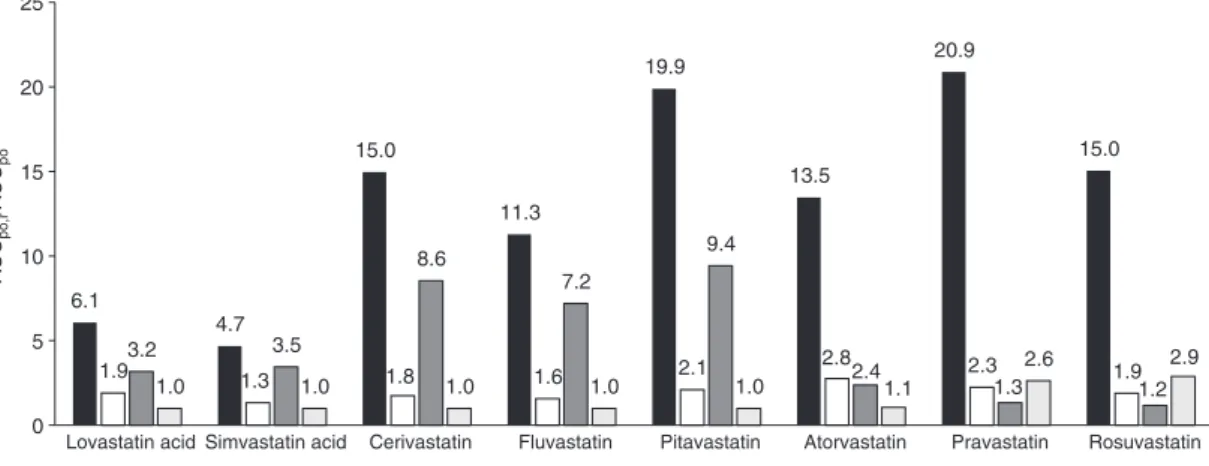
Figure 3 depicts the predicted DDI potential of all statins in our dataset following oral administration according to Eqs. 1, 3 and 5 generally assuming significant (almost
com-plete) process inhibition of 90% (i.e., fi,inf = fi,met = fi,sec = 0.9)
[6]. As illustrated, the impact of simultaneous inhibition of multiple clearance processes can for some statins (such as cerivastatin, fluvastatin, lovastatin acid, pitavastatin, and simvastatin acid) be anticipated from the product of the AUC ratios of the individual processes (i.e., inhibition of only influx, metabolism, or biliary secretion) whereas for another category of statins (such as atorvastatin, pravas-tatin, and rosuvastatin) the projected overall AUC change increases over-proportionally compared to the single process contributions. The power of the extended hepatic clearance model for providing mechanistic insight into the (rate-determining) processes driving hepatic elimination and, ultimately, for assessing qualitatively and quantita-tively the compound-dependent DDI risks is subsequently discussed for each statin separately (see also Table 1).
Lovastatin acid and simvastatin acid
Lovastatin and simvastatin are both administered as lactone pro-drugs, which are rapidly converted to their active acid forms either by spontaneous chemical reac-tions or by carboxylesterase-mediated metabolism in error (afe) of 1.5 determined according to Eq. 6. However,
in agreement with previous work, a trend toward a slight under-estimation of the in vivo observed hepatic clear-ances was observed (linear regression slope: 0.47,
inter-cept: 1.72, R2 = 0.80) [5, 6]. It is noteworthy to mention at
this point that according to ECCCS the quantitative hepatic clearance prediction of mainly class 2 and, probably, class 4 compounds is highly sensitive to the intrinsic metabolic clearance input parameter as discussed in more detail elsewhere [6]. As we refer for the present manuscript to
non-in-house CLint,met values from different literature
sources (Supplementary Material, Table 1), the prediction accuracy might be impacted particularly for these two compound classes. (The uptake-limited ECCCS class 3 and
4 compounds are much less sensitive to CLint,met). Possible
ato cer flu lov pit pra ros sim 0.5 5.0 50.0 0.5 5.0 50.0 CL h,pre d , mL/(min·kg ) CLh,obs, mL/(min·kg)
Figure 2: Correlation between the predicted (CLh,pred) and observed
(CLh,obs) hepatic clearances.
ato, atorvastatin; cer, cerivastatin, flu, fluvastatin; lov, lovastatin acid; pit, pitavastatin; pra, pravastatin; ros, rosuvastatin and sim, simvastatin acid. The black and gray lines represent the line of unity and the two-fold deviations, respectively.
6.1 4.7 15.0 11.3 19.9 13.5 20.9 15.0 1.93.2 1.3 1.8 1.6 2.1 2.8 2.3 1.9 3.5 8.6 7.2 9.4 2.4 1.3 1.2 1.0 1.0 1.0 1.0 1.0 1.1 2.6 2.9 0 5 10 15 20 25
Lovastatin acid Simvastatin acid Cerivastatin Fluvastatin Pitavastatin Atorvastatin Pravastatin Rosuvastatin
AUC
po,i
/AUC
po
Figure 3: Prediction of the hepatic DDI potential of statins.
Using Eq. 5, the AUC fold-change was determined for the following scenarios [6]: black, total hepatic inhibition (f i,inf = fi,met = fi,sec = 0.9);
white, inhibition of active hepatic influx (fi,inf = 0.9); dark gray, inhibition of metabolism (fi,met = 0.9); light gray, inhibition of biliary secretion
the intestine, liver, and plasma [10, 15]. Renal clearance represents a minor elimination pathway for both lovasta-tin acid and simvastalovasta-tin acid with 10% and 13% parent drug excreted in urine, respectively. Both drugs are mainly eliminated by metabolism via CYP3A4, CYP2C8, and UGTs [4, 10, 15]. Lovastatin acid was in vitro identified to be transported by OATP1B1, and simvastatin acid is a sub-strate of OATP1B1 and OATP1B3 [12].
Following co-medication with gemfibrozil in clinics, AUC ratios of 2.8 and 2.9 were reported for lovastatin acid and simvastatin acid, respectively [18, 19]. Gem-fibrozil is a well-known inhibitor of OATP1B1, NTCP, CYP2C8, and UGTs [20, 21]. Accordingly, applying Eq. 5
with fi,inf = fi,met = 0.9, AUC ratios of 6.1 and 4.7 are predicted
for lovastatin acid and simvastatin acid, respectively. Both projections slightly over-predict the in vivo findings though (2.2-fold and 1.6-fold for lovastatin acid simvas-tatin acid, respectively). However, static DDI prediction methods are generally expected to be over-predictive for the in vivo situation as they do not account for the real inhibitor concentration and consequently for partial inhibition effects at the sites of interaction (i.e., any process inhibition fractions below 0.9 in this study). In addition, recent studies in our laboratories have revealed the involvement of at least one additional not yet iden-tified transporter system in the hepatic uptake of both compounds (its contribution to overall active uptake is estimated with about 80% for lovastatin acid and 40% for simvastatin acid) [12]. Provided that gemfibrozil is not inhibiting this additional transport system, the fractional contributions for active OATP1B1-mediated influx would
be significantly lower than assumed above (fi,inf = 0.2 and
0.6 for lovastatin acid and simvastatin acid, respectively) and, as a consequence, a lower DDI potential following simultaneous inhibition of OATP1B1-mediated hepatic uptake and overall metabolism is projected (3.5-fold for lovastatin acid and 4.2-fold for simvastatin acid).
Nevertheless, based on their high passive perme-ability characteristics, both compounds were assigned to ECCCS class 1. In this class, the uptake into the hepatocytes becomes the rate-determining step of hepatic elimination, and metabolism is anticipated to be the major source for DDIs. Applying the mechanistic extended hepatic clear-ance model, inhibition of only metabolism resulted in AUC ratio projections of 3.2 and 3.5 for lovastatin acid and simvastatin acid, respectively. This DDI prediction is in excellent agreement with the in vivo interaction results ( < 1.2-fold over-predictive for both lovastatin acid as well as simvastatin acid). Consequently, in alignment with the ECCCS class 1 assignment, transporter effects (if any) are projected to be minimal and the product of the individual
AUC ratio changes driving hepatic elimination (namely hepatic uptake and metabolism) can be used to anticipate the overall DDI risk following simultaneous inhibition of both processes together (Figure 3).
Cerivastatin
Cerivastatin, administered as a free acid, is exclusively eliminated in the liver where primary OATP1B1 (∼20%) and a yet unknown transporter system (∼80%) are involved in its active hepatic uptake [12]. Metabolism is the only reported clearance pathway of cerivastatin, with a contribution of 61% CYP2C8 and 37% of CYP3A4 [21, 22].
As shown in Table 3, cerivastatin was assigned to ECCCS class 2. In this class, the sum of metabolism and biliary clearance represents the rate-determining step of hepatic elimination and inhibition of metabolism is generally projected as the major source of drug-drug interactions (Figure 3). In clinical studies, an AUC-ratio of 5.6 has been observed following co-administration of cerivastatin and gemifbrozil [9]. Based on in vitro studies, gemfibrozil is a potent inhibitor of hepatic anion uptake transporters (OATPs, NTCP), as well as of CYP2C8-medi-ated cerivastatin metabolism while its inhibitory effect on CYP3A4 is expected to be of minor clinical relevance [21, 23]. Thus, assuming complete inhibition of active cerivastatin uptake and CYP2C8-mediated metabolism by
gemfibrozil (fi,inf = 0.9, fi,met = 0.61) the liver-based static DDI
model (Eq. 5) predicted an AUC ratio of 4.1. Furthermore, in clinics, cyclosporine A (CsA, an OATP family, NTCP and CYP3A4 inhibitor with no relevant CYP2C8 effect) was shown to increase the AUC of cerivastatin by 3.8-fold
[9]. Accordingly, with fi,inf = 0.9 and fi,met = 0.37, an AUC ratio
of 2.6 is anticipated from in vitro data. Consequently, for both scenarios, DDI effects within a comparable range to the observed AUC ratios were predicted with a general trend toward a slight under-prediction (about 1.5-fold) of the effective DDI potential. One reason for systematic under-predictions with the extended clearance concept approach is the possibility that the fractional process con-tributions as estimated from in vitro investigations might not absolutely reflect the ultimate in vivo situation cor-rectly (e.g., wrong fractional contributions of known path-ways, existence of additional not yet identified pathways and/or time-dependent changes of pathway contribu-tions as, e.g., observed following auto-induction/inhibi-tion). And indeed, being a prominent CYP3A4, BCRP, and P-gp substrate [24], for cerivastatin a possible existence of an extra-hepatic elimination pathway such as pre-systemic intestinal metabolism and/or efflux ultimately
contributing to the overall clinical DDI risk in the range of our under-predictions was discussed in literature [9]. Nevertheless, similar to ECCCS class 1, transporter effects for ECCCS class 2 drugs are anticipated to contribute mini-mally to their hepatic interaction risk, and the overall DDI potential as victim drug in the liver can easily be pro-jected from the AUC changes of the individual processes (Figure 3).
Fluvastatin
Fluvastatin is predominately cleared by the liver. Adminis-tered a as free acid, about 90% of a fluvastatin dose under-goes metabolism while only 2% and 6% of parent drug are recovered in feces and urine, respectively. In vitro studies indicate that metabolism is primarily mediated by CYP2C9 (75%) and to a lower extent by CYP3A4 (20%) and CYP2C8 (5%) [25]. Moreover, OATP1B1, OATP2B1, OATP1B3, and NTCP contribute to the active hepatic uptake of fluvasta-tin [12, 26, 27].
Fluvastatin was assigned to ECCCS class 2, and in agreement with this classification, the overall DDI poten-tial can be projected from the individual process con-tributions as discussed above (Figure 3). Inhibition of metabolism is predicted as the major pathway causing DDIs while inhibition of hepatic uptake transporters is expected to have a minor impact. This conclusion is supported by a clinical observation demonstrating that co-administration of the CYP3A4 and OATP transporter
family inhibitor erythromycin (fi,met = 0.2, fi,inf = 0.9) did not
significantly alter the exposure of fluvastatin (predicted and observed AUC ratio of 1.6 and 1.2, respectively) [25].
As illustrated in Figure 3, an AUC ratio of 11.3 was pro-jected assuming simultaneous inhibition of active uptake
and metabolism (fi,inf = fi,met = 0.9). In clinical trials, maximal
DDI effects resulted generally in AUC ratios below 4 though. However, as multiple transporters and meta-bolic enzymes are involved in the hepatic elimination of fluvastatin, it is likely that perpetrators used in clinical studies did not concomitantly inhibit all active clear-ance processes involved in its elimination. For example, AUC-increases of up to 3.5-fold have been reported for co-administration of fluvastatin with CsA (potent inhibitor of OATPs, NTCP, BCRP, and CYP3A4 [9]). Assuming
inhi-bition of hepatic uptake (fi,inf = 0.9) and simultaneously of
only CYP3A4-mediated metabolism (fi,met = 0.2) the
antici-pated change in AUC is 1.8-fold which, in contrast to above projections, slightly under-predicts the in vivo observed value. Thus, the discrepancy between the predicted and observed clinical DDI effect could eventually be attributed
to an additional (partial) inhibition of CYP2C8 and/or CYP2C9 by CsA. Recent investigations, however, are more supportive for the hypothesis that BCRP-mediated intes-tinal efflux might have a significant role in modulating the absorption of fluvastatin [15]. Integrating into above assessment an experimentally determined in vivo expo-sure increase of 72% (1.72-fold) following complete BCRP inhibition, the overall static DDI risk projection for fluvas-tatin in the presence of CsA would be 3.1-fold which is in good compliance with the clinical observations.
Pitavastatin
Administered as a free acid, pitavastatin is exclusively eliminated via the liver, and 79% of the dose is recovered in feces as unchanged parent drug, indicating direct biliary secretion [15]. Thus, metabolism of pitavastatin, mainly mediated by CYP2C9 (45%) and UGT (55%), is described as a minor hepatic elimination pathway [1, 28]. Moreover, pitavastatin is an in vitro substrate of OATP1B1, OATP1B3, NTCP, and BCRP [12, 22, 26, 29].
In contrast to the described clinical observations, no active biliary secretion of pitavastatin was measured in our
in vitro experiments which is in alignment with recent
clin-ical findings that pitavastatin disposition is not influenced by BCRP in vivo [15]. Metabolism was predicted as the predominant hepatic elimination pathway of pitavastatin (Table 3), and the anticipated hepatic clearance based on the extended clearance concept equation was similar to the measured clinical data. This observation suggests that the reported value for biliary parent drug secretion (79%) might not correctly reflect the effective mechanism of pita-vastatin elimination [15]. In vitro studies demonstrated that direct glucuronidation contributes significantly to pitavastatin metabolism. We therefore suggest that pita-vastatin might be substantially biliary secreted in vivo as its direct glucuronide metabolite [1, 28, 30]. Since glucuro-nide metabolites are often found to be cleaved in the gas-trointestinal tract (e.g., by enterobacteria), the amount of unchanged pitavastatin found in human feces might con-sequently not fully represent the actual amount of secreted parent drug. The contribution of direct biliary pitavastatin secretion in vivo might therefore be significantly overesti-mated while hepatic metabolism is in fact representing the most relevant clearance mechanism.
Using the ECCCS categorization approach, pitavasta-tin was assigned to class 2. Inhibipitavasta-ting all hepatic pitavas-tatin clearance mechanisms as a worst-case scenario (i.e., fi,inf = fi,met = 0.9), we predicted an AUC ratio of 19.9 (Figure 3). In a clinical study, co-administration with CsA led to a
4.6-fold increased AUC of pitavastatin [9]. Based on in vitro inhibition data, CsA is expected to inhibit active hepatic uptake and UGT-mediated metabolism of pitavastatin while it has no clinically significant inhibitory potential on CYP2C9 [9, 31]. Thus, applying the known inhibitory
properties of CsA (fi,inf = 0.9 and fi,met = 0.55), we forecast an
AUC increase of 4.5-fold. In a different study, co-admin-istration of pitavastatin with erythromycin (inhibitor of CYP3A4 and OATPs) resulted in an observed AUC increase of 380% [15]. Assuming inhibition of active hepatic influx
only (fi,inf = 0.9), we project an AUC ratio of 2.1-fold. Our
pre-dictions indicate that clinically observed DDI effects are mechanistically well-reflected by our model. These obser-vations further support the above mentioned hypothesis that clinical data might represent an over-estimation of the actual in vivo observed biliary pitavastatin clearance.
Atorvastatin
In clinics, atorvastatin is administered as a pharmaco-logically active acid. About 70% of administered atorvas-tatin is metabolized (mainly by CYP3A4), and about 28% are actively biliary secreted. With 2% of unchanged drug recovered in urine, renal elimination is a minor excretion pathway for atorvastatin. In vitro studies demonstrated that atorvastatin is a substrate for OATP1B1, OATP1B3, P-gp, BCRP, and MRP2 [3, 12, 32].
Based on in vitro data, atorvastatin was assigned to ECCCS 4 (Table 3). As shown in Figure 3, inhibition of
either active influx (fi,inf = 0.9) or metabolism (fi,met = 0.9) is
predicted to result in moderate AUC changes of about 2- to 3-fold, while no significant increase in AUC was
antici-pated when only biliary clearance was inhibited (fi,sec = 0.9).
Upon simultaneous inhibition of all hepatic clearance processes, an AUC change of 13.5-fold is projected. Clini-cal studies, following oral co-administration of atorvas-tatin with CsA, reported AUC changes of up to 15-fold [9, 15]. CsA is a well-known (in vitro) inhibitor of OATP1B1, OATP2B1, OATP1B3, NTCP, P-gp, BCRP, and MRP2 trans-porters, as well as of CYP3A4 and UGT metabolic enzymes [31, 33–36]. Hence, the present total hepatic worst-case DDI prediction of about 14-fold is in good agreement with the reported clinical observations. Similarly, when clinically co-administered with a combination of lopina-vir and ritonalopina-vir a 5.9-fold AUC increase of atorvastatin was observed [9, 15]. Lopinavir is a potent OATP1B1 and OATP1B3 inhibitor while ritonavir also inhibits CYP3A4 metabolism [37, 38]. Assuming concomitant significant
inhibition of active influx and metabolism (fi,inf = fi,met = 0.9),
the extended clearance concept anticipates an exposure
increase of around 6.5-fold. Moreover, an AUC ratio of 3.3 was reported for atorvastatin when given together with the potent CYP3A4 inhibitor itraconazole (has no effect on OATPs), which is also in good agreement with the pro-jected value of 2.4-fold [9, 15]. In contrast to the ECCCS class 1 and 2 compounds discussed before, the overall DDI potential for atorvastatin cannot be projected from the AUC changes of the individual processes though as nicely illustrated in Figure 3. Hence, for ECCCS class 4 compounds the substantial over-proportional increase in AUC upon simultaneous inhibition of uptake, efflux and metabolism derives from the essential interplay and interdependencies of all hepatic elimination pathways together. It is noteworthy to mention here, that in current DDI risk assessment potential involvement of basolat-eral hepatic and/or apical intestinal efflux transporters as well as of intestinal enzymes was not considered and that significant coincidental in vivo inhibition of any of these active processes by perpetrators drugs would ulti-mately result in over- predictions of the effective interac-tion potential for this ECCCS class 4 compound.
Pravastatin
Administered as a free acid, the major route of hepatic pravastatin elimination is biliary secretion of parent drug mediated by BCRP and MRP2. Hepatic oxidative metabo-lism via CYPs is considered to be of minor importance since < 10% of the dose is recovered as metabolites in feces [15, 29, 39, 40]. Furthermore, active hepatic uptake of pravastatin is mediated by OATP1B1, OATP1B3, and OATP2B1 [1, 12].
Applying Eq. 4, inhibition of all hepatic clearance
processes (fi,inf = fi,met = fi,sec = 0.9) resulted in a maximal
AUC increase projection of more than 20-fold (Figure 3). However, in contrast to other statins, pravastatin exhib-its a unique pharmacokinetic profile due to a significant contribution of renal clearance (47%) to the total body clearance which represents a significant deviation from the assumptions made for Eq. 5 [15]. Hence, the fractional contribution of the hepatic pathway to overall
pravas-tatin elimination is only about 53% (fn,h = 0.53), and as a
consequence according to Eq. 4, complete blockage of the hepatic elimination pathway is not expected to result in AUC changes beyond 2.6-fold. Clinical DDI studies with pravastatin and gemfibrozil reported 2-fold AUC changes [41, 42]. Gemfibrozil is a selective inhibitor of hepatic OATPs and of renal OAT3. Hence, a 1.7-fold decrease of renal pravastatin clearance was observed in clinics likely due to inhibition of OAT3 [42]. Assuming only inhibition
of active hepatic influx (fi,inf = 0.9), we calculated an AUC ratio of 1.6 with Eq. 4 providing a slight under-prediction of the clinical situation possibly due to cross-reactivity of gemfibrozil with renal OAT3. Furthermore, no signifi-cant AUC increases were observed in clinics following co-administration of pravastatin with either itracona-zole or fluconaitracona-zole both compounds potent CYP3A4 and CYP2C9 inhibitors [9]. This observation was also reflected by our model since inhibition of metabolism alone did not predict any relevant AUC changes (1.1-fold). However, in clinics, AUC ratios of 10–23 were reported upon co-administration of pravastatin with CsA (inhibitor of OATPs, NTCP, CYP3A4, UGTs, MRP2, and BCRP) exceed-ing the theoretically possible hepatic DDI potential by up to 9-fold [9]. Yet, in humans, the renal excretion process is known to involve active transporter-mediated secretion as indicated by the estimated renal clearance (9.2 mL/(min·kg) corresponding to 47% of total clearance) significantly exceeding (about 5-6-fold) the projected renal filtration clearance [∼1.7 mL/(min·kg)] calculated from the product of glomerular filtration rate [1.8 mL/
(min·kg)] and the fraction unbound in blood (fu,p = 0.97)
[43]. The most likely reason for the obvious contradiction in data is therefore the contribution of a transporter medi-ated active tubular secretion pathway coincidentally also inhibited by CsA. In literature, OAT3 has been suggested to be responsible for the basolateral uptake of pravastatin, as further supported by the DDI between gemfibrozil and pravastatin [42]. The transporter involved in its luminal efflux is yet to be identified [41]. MRP2 and/or BCRP are likely candidate transporters though, both well-known to be effectively inhibited by CsA. Assuming a 80% simulta-neous inhibition of both hepatic as well as renal elimina-tion pathways, the anticipated overall exposure increase can be estimated with around 9-fold (details are given in the Supplementary Material [Eq. 9, Table 3]). Following a 90% inhibition of the overall clearance, the AUC increase is projected with already 19-fold (Supplementary Material [Eq. 9, Table 4]). This would be in close agreement with the observed in vivo DDI effect (measured in vivo AUC ratio/ predicted in vitro AUC ratio ≈ 1.2). Owing the complex inhibition profile of CsA, a final assessment is diffi-cult to develop though notably because of a potentially reduced pravastatin absorption due to intestinal MRP2 as discussed in literature [15]. The restriction of pravas-tatin absorption was quantified with 67% reflecting the observed AUC increase in individuals with a synonymous c1446C > G single nucleotide polymorphism in the ABCC2 (MRP2) gene [44]. In any case, the hepatic DDI projections according to Eq. 5 provided above are therefore likely just accidentally reflecting the in vivo observations stressing
out the need for a careful and integrated (pre)clinical data analysis for more complex chemical entities such as the ECCCS class 4 compound pravastatin. To elucidate the exact DDI mechanism in full detail would require further (mechanistic) clinical investigations.
Rosuvastatin
Rosuvastatin is administered as a free acid. The hepatic clearance of rosuvastatin accounts for approximately 70%
(fn,h = 0.7) of the net body clearance while 30% are
attrib-uted to renal secretion of unchanged drug. Direct biliary secretion of unchanged rosuvastatin is reported as the major hepatic route of elimination. Thereby, OATP1B1, OATP1B3, OATP2B1 and NTCP are assumed to mediate active hepatic uptake, while secretion of rosuvastatin into bile is primary mediated via BCRP [15, 45]. Metabolic clearance, mainly by CYP2C9 and UGTs, is considered to play a minor role in rosuvastatin elimination [15, 23, 45].
A clinical AUC ratio of 2.1-fold was reported when co-administering rosuvastatin together with lopinavir (OATP family inhibitor) and ritonavir (CYP3A4 inhibitor) [9]. Since rosuvastatin is not metabolized by CYP3A4, the observed DDI effect is expected to result exclusively from inhibition of active hepatic uptake. Assuming
signifi-cant inhibition of hepatic influx (fi,inf = 0.9) and applying
due to a significant renal clearance contribution Eq. 4, we foresee an 1.5-fold AUC change with this static model approach. Moreover, a triple combination of rosuvasta-tin, azatanavir (OATP inhibitor), and ritonavir (OATP and CYP inhibitor) resulted in vivo in a 3.1-fold increased rosu-vastatin AUC [9]. Both perpetrators do not affect canali-cular efflux of rosuvastatin. The corresponding static DDI projection predicts an AUC ratio of 1.7. Furthermore, maximum clinical AUC increases of 7.1-fold were observed upon co-administration of rosuvastatin with CsA, which is expected to inhibit all active hepatic elimination pro-cesses of rosuvastatin [9]. Simulating inhibition of all pos-sibly involved hepatic clearance processes in our model, using Eq. 5 (which neglects the clearance pathway via the kidney), an exposure increase of up to 15-fold is projected (Figure 3). Also taking into consideration a renal clearance contribution according to Eq. 4, we predict a 3.1-fold AUC increase though. BCRP eventually plays a relevant role in the absorption of rosuvastatin in humans which was demonstrated to be ∼50% [15, 46]. With that, the maximal exposure increase following intestinal BCRP inhibition is 2-fold (probably significantly less though as the physico-chemical properties of this hydrophilic statin are unlikely accounting for a complete absorption even in the absence
of any efflux transporter activity). Consequently, the static DDI projection for CsA, taking into account DDI effects in the liver and intestine, would be 6.2-fold maximum, which is in good agreement with the clinical observations. However, also for rosuvastatin, a substantial active tubular secretion via the OAT1, OAT3, MRP2, BCRP as well as P-gp was demonstrated [47, 48]. Accounting for such an active tubular secretion pathway, similar to the pravastatin case above (i.e., 80% inhibition of overall systemic clearance without considering a potential intestinal interaction on BCRP), the overall DDI risk would be only slightly over-estimated (∼1.5-fold). [Details are given in the Supplemen-tary Material (Eq. 9, Table 3).] Yet, hepatic efflux across the sinusoidal membrane was demonstrated to contribute significantly to rosuvastatin disposition in sandwich-cul-tured human hepatocytes and in rats [49, 50]. A parallel inhibition of canalicluar as well as of sinusoidal efflux by CsA would possibly account for the remaining overestima-tion of the DDI risk. As the current approach is based on
the assumption that PSinf is equal to PSeff, this represents a
potential caveat of the current prediction method.
Rosuvastatin was assigned to ECCCS class 4. This is in line with clinical observations, demonstrating that con-comitant inhibition of sinusoidal uptake, biliary secretion as well as metabolism pathways significantly define the complex hepatic DDI potential of rosuvastatin. Although the mechanism-based DDI assessment for the liver seems to reflect, the clinical observations pretty well (all hepatic projections based on Eq. 4 are only slightly under-predic-tive [1.6-fold maximum]), the experimentally determined
in vivo hepatic clearance of rosuvastatin was significantly
under-predicted ( > 6-fold) by the extended clearance concept model (Figure 2). One possible explanation for this IVIVE disconnect would be an over-estimation of the
in vivo hepatic clearance pathway as derived from
experi-mental clinical data. Hypothetically, the presence of an additional extra-hepatic/extra-renal elimination pathway (such as e.g., active BCRP-mediated intestinal secretion) could have resulted in such an over-estimation of the effective hepatic clearance without really impacting above static DDI assessments for the unspecific cross-reactive inhibitor CsA [51]. Yet, present hypothesis is in partial contradiction to above discussed (major) involvement of BCRP in rosuvastatin absorption as it would rather support a significant involvement of this efflux pump in hepatic, renal and intestinal systemic elimination, largely accounting for the 2.4-fold exposure difference observed in healthy volunteers and BCRP-deficient individuals [46]. Fractional process contributions as experimentally deter-mined from in vitro investigations not correctly reflecting the ultimate in vivo situation might provide an alternative
explanation for the observed data discrepancy. Recently, Jamei et al. developed an IVIVE-based PBPK model for rosuvastatin [52]. Since experimental hepatic uptake data did not accurately predict the reported in vivo clearance of rosuvastatin, the authors used a top-down (fitted) value [PSinf,act = 222 μL/(min·106 cells)] which was 21-fold higher
compared to our experimental data (Table 2). Replacing our in-house active hepatic uptake results with this tai-lored value the current IVIVE model (Eq. 2) would have predicted a hepatic clearance of 10.8 mL/(min·kg) being in fair agreement with the observed in vivo clearance (Table 3). In addition, using Eq. 4 (i.e., not considering a possible interaction on the active renal tubular secretion pathway and not taking into account a possible intestinal BCRP inhibition), static DDI predictions including this new data point would have provided DDI estimations reflecting above in vivo observations very well (8.8-fold following complete process inhibition as observed with CsA, 4.1-fold for an OATP and CYP inhibition profile as seen with the azatanavir/ritonavir combo, and 3.8-fold following OATP inhibition with lopinavir). But, although intriguing prima facie, the potential role of renal and/ or intestinal transporter inhibition as discussed above remains to be clarified. In addition, this hypothesis would need to be substantiated by the involvement of a not yet identified sinusoidal active solute-carrier system (as most other statins can reasonably well predicted with current approach the candidate transporters are unlikely OATP1B1, OATP1B3, or NTCP) which in course of the iso-lation and/or preparation process is ultimately heavily down-regulated in the in vitro hepatocyte systems and which in vivo is similarly subject to inhibition by above perpetrators.
Discussion
In agreement with the previous findings, by applying the extended mechanistic hepatic organ model, a very good
in vitro-in vivo projection of the effective hepatic clearances
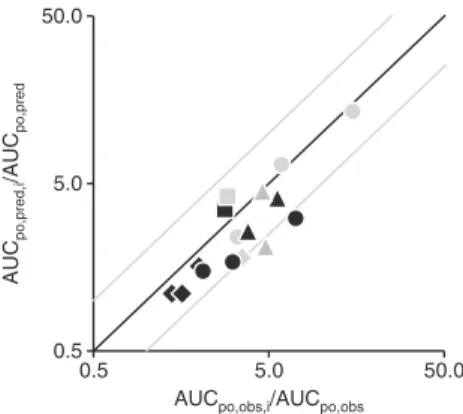
for all marketed statins could be demonstrated. Similarly, using clinical in vivo observations and in vitro information about drug transport and metabolism characteristics, the DDI potential of these statins was successfully assessed and quantitatively evaluated in several retrospective analyses. The correlation between observed and predicted AUC ratios for different combinations of the investigated statins and perpetrator drugs is given in Figure 4 summarizing all rele-vant DDI predictions according to Eqs. 4 and 5 as discussed above. Overall, the observed interaction effects were well-predicted by the extended mechanistic hepatic clearance
comparatively high intrinsic (metabolic and/or sinusoidal efflux) clearance. For the three ECCCS class 4 compounds in the dataset (pravastatin, rosuvastatin, and atorvasta-tin), we predicted highest AUC changes upon concomitant inhibition of hepatic uptake, biliary secretion and metab-olism whereas inhibition of the single clearance path-ways results in comparatively moderate AUC ratios. This concept was well reflected by our DDI predictions and is in good agreement with clinical DDI data.
The static baseline (or worst-case) DDI prediction approach as presented in this manuscript is well-known to provide only conservative estimates of the hepatic in vivo situation as it does not account for the (time-dependent) effective substrate and inhibitor concentrations at the
effector site as well as the actual inhibitor potency (IC50
or Ki) of the perpetrator drug as described previously [6].
Nevertheless, it is confidently offering a conceptual and educational DDI model, which gives some insights into the relative importance of different physiological pro-cesses involved in drug clearance. It is also noteworthy to remember at this point that for present analysis intrinsic metabolic clearance data from different references were taken, possibly impacting the (hepatic clearance and, consequently, DDI) prediction accuracy of mainly ECCCS class 2 and 4 compounds as discussed above. In addi-tion, the approach bases on transport and metabolism data determined in pools of human hepatocytes and liver microsomes from multiple donors [6, 12]. Differences in protein expression levels due to genetic polymorphism were therefore not actively taken into consideration. As polymorphism for some variants ultimately translates into activity changes, it is evident, that such alterations might impact the ECCCS class categorization, hepatic clearance prediction and/or the DDI projections for some statins in our dataset. Susceptibility toward this effect was e.g., reported for atorvastatin (144% greater mean AUC for the SLCO1B1 (OATP1B1) c.521CC genotype [53]), fluvas-tatin (up to 3-fold differences in mean AUC according to the number of CYP2C9*3 alleles [54]), or rosuvastatin (AA haplotype individuals on ABCG2 (BCRP) c.421 exhibited ∼2.4-fold higher AUC compared with individuals carrying the control haplotype [46]).
Conclusions
In summary, we have demonstrated the validity of the ECCCS as a bottom-up assessment for hepatic clearance and as a static “worst-case” model for DDI predictions purely from in vitro data. The ECCCS is therefore expected model as indicated by an afe of 1.3. Out of 16 DDIs, 14 were
predicted within a two-fold error, and linear regression analysis revealed an almost 1-to-1 correlation (slope: 0.857,
intercept: −0.2677, R2: 0.84). Excluding the interaction
pre-dictions for the ECCCS class 4 compounds pravastatin and rosuvastatin in the presence of CsA as perpetrator (legiti-mated by the evident and significant under-prediction of the overall DDI risk due to cross-reactivity with renal and/or intestinal transporters as discussed above), all clinical DDI effects were projected within a two-fold error maximum
(R2 of 0.89) underlying the validity of this static DDI
predic-tion approach to appropriately anticipate the DDI potential of victim drugs in the liver.
For the five statins assigned to ECCCS class 1 (lovas-tatin acid and simvas(lovas-tatin acid) and ECCCS class 2 (flu-vastatin, ceri(flu-vastatin, and pitavastatin), metabolism was anticipated as major clearance mechanism primary responsible for causing DDIs. For compounds assigned to these classes, the overall DDI potential can easily be anticipated from the product of the AUC changes of the individual process. A similar overall DDI behavior would be anticipated for ECCCS class 3 statins with sinusoi-dal transporter inhibition being the major mechanism causing the interaction though. However, none of the statins in this study could be assigned to this ECCCS class which, besides a significant active uptake contribu-tion, is characterized by a low passive permeability and a
0.5 5.0 50.0 0.5 5.0 50.0 AUC po,pred,i /AUC po,pred
AUCpo,obs,i/AUCpo,obs
Figure 4: Correlation of all observed (AUCpo,obs,i/AUCpo,obs) vs. predicted (AUCpo,pred,i/AUCpo,pred) drug-drug interactions between
statins and different perpetrator drugs according to Eq. 4 [applied for pravastatin (black diamonds) and rosuvastatin (black circles)] and Eq. 5 [used for lovastatin acid (black squares), simvastatin acid (gray squares), fluvastatin (gray diamonds), cerivastatin (black tri-angles), pitavastatin (gray triangles) and atorvastatin (gray circles)]. For effective numbers, please refer to text. Predictions prone to misjudgment of the effective DDI potential while underlying some vital assumptions (such as the presence of alternative renal and/or intestinal active processes as discussed in the manuscript) were not considered. The black and gray lines represent the line of unity and the two-fold deviations, respectively.
to be of great value for preclinical drug development, at a time when no human pharmacokinetic data are avail-able. In addition, in combination with clinical (DDI) data applying a top-down approach, the ECCCS concept can be extremely helpful in identifying IVIVE disconnects and in revealing alternative elimination pathways. As such path-ways are passively (by altering the individual fractional pathway contributions) and/or actively (by involvement of metabolism and/or transporter processes likewise being subject to interferences) contributing to the ultimate DDI risk of victim drugs their quantitative integration into static or even dynamic (e.g., with help of the
population-based simulator Simcyp®), pharmacokinetic models
might be crucial for an appropriate assessment and final interpretation of clinical study results.
Acknowledgments: The authors wish to acknowledge the
many Novartis Drug Metabolism and Pharmacokinetic scientists of Basel, Switzerland, who have supported this work. Special thanks go to Francis Heitz for technical assistance.
Author contributions: All the authors have accepted
responsibility for the entire content of this submitted manuscript and approved submission.
Research funding: None declared.
Employment or leadership: None declared. Honorarium: None declared.
Competing interests: The funding organization(s) played
no role in the study design; in the collection, analysis, and interpretation of data; in the writing of the report; or in the decision to submit the report for publication.
References
1. Shitara Y, Sugiyama Y. Pharmacokinetic and pharmacodynamic alterations of 3-hydroxy-3-methylglutaryl coenzyme A (HMG-CoA) reductase inhibitors: drug-drug interactions and interindividual differences in transporter and metabolic enzyme functions. Pharmacol Ther 2006;112:71–105.
2. Staffa JA, Chang J, Green L. Cerivastatin and reports of fatal rhabdomyolysis. N Engl J Med 2002;346:539–40.
3. Li J, Volpe DA, Wang Y, Zhang W, Bode C, Owen A, et al. Use of transporter knockdown Caco-2 cells to investigate the in vitro efflux of statin drugs. Drug Metab Dispos 2011;39:1196–202.
4. Prueksaritanont T, Subramanian R, Fang X, Ma B, Qiu Y, Lin JH, et al. Glucuronidation of statins in animals and humans: a novel mechanism of statin lactonization. Drug Metab Dispos 2002;30:505–12.
5. Umehara K, Camenisch G. Novel in vitro-in vivo extrapolation (IVIVE) method to predict hepatic organ clearance in rat. Pharm Res 2012;29:603–17.
6. Camenisch G, Umehara K. Predicting human hepatic clearance from in vitro drug metabolism and transport data: a scientific and pharmaceutical perspective for assessing drug-drug inter-actions. Biopharm Drug Dispos 2012;33:179–94.
7. Benet LZ, Amidon GL, Barends DM, Lennernas H, Polli JE, Shah VP, et al. The use of BDDCS in classifying the permeability of marketed drugs. Pharm Res 2008;25:483–8.
8. Sharma P, Butters CJ, Smith V, Elsby R, Surry D. Prediction of the in vivo OATP1B1-mediated drug-drug interaction potential of an investigational drug against a range of statins. Eur J Pharm Sci 2012;47:244–55.
9. Yoshida K, Maeda K, Sugiyama Y. Transporter-mediated drug – drug interactions involving OATP substrates: predic-tions based on in vitro inhibition studies. Clin Pharmacol Ther 2012;91:1053–64.
10. Neuvonen PJ, Niemi M, Backman JT. Drug interactions with lipid-lowering drugs: mechanisms and clinical relevance. Clin Pharmacol Ther 2006;80:565–81.
11. Fujino H, Saito T, Tsunenari Y, Kojima J, Sakaeda T. Metabolic properties of the acid and lactone forms of HMG-CoA reductase inhibitors. Xenobiotica 2004;34:961–71.
12. Kunze A, Huwyler J, Camenisch G, Poller B. Prediction of organic anion-transporting polypeptide 1B1- and 1B3-mediated hepatic uptake of statins based on transporter protein expression and activity data. Drug Metab Dispos 2014;42:1514–21.
13. Boulenc X, Barberan O. Metabolic-based drug-drug interactions prediction, recent approaches for risk assessment along drug development. Drug Metabol Drug Interact 2011;26:147–68. 14. Einolf HJ. Comparison of different approaches to predict
meta-bolic drug-drug interactions. Xenobiotica 2007;37:1257–94. 15. Elsby R, Hilgendorf C, Fenner K. Understanding the critical
disposition pathways of statins to assess drug-drug interaction risk during drug development: it’s not just about OATP1B1. Clin Pharmacol Ther 2012;92:584–98.
16. Carlile DJ, Zomorodi K, Houston JB. Scaling factors to relate drug metabolic clearance in hepatic microsomes, isolated hepato-cytes, and the intact liver: studies with induced livers involving diazepam. Drug Metab Dispos 1997;25:903–11.
17. Swift B, Pfeifer ND, Brouwer KL. Sandwich-cultured hepato-cytes: an in vitro model to evaluate hepatobiliary transporter-based drug interactions and hepatotoxicity. Drug Metab Rev 2010;42:446–71.
18. Backman JT, Kyrklund C, Kivisto KT, Wang JS, Neuvonen PJ. Plasma concentrations of active simvastatin acid are increased by gemfibrozil. Clin Pharmacol Ther 2000;68:122–9.
19. Kyrklund C, Backman JT, Kivisto KT, Neuvonen M, Laitila J, Neuvonen PJ. Plasma concentrations of active lovastatin acid are markedly increased by gemfibrozil but not by bezafibrate. Clin Pharmacol Ther 2001;69:340–5.
20. Prueksaritanont T, Tang C, Qiu Y, Mu L, Subramanian R, Lin JH. Effects of fibrates on metabolism of statins in human hepato-cytes. Drug Metab Dispos 2002;30:1280–7.
21. Shitara Y, Hirano M, Sato H, Sugiyama Y. Gemfibrozil and its glucuronide inhibit the organic anion transporting polypeptide 2 (OATP2/OATP1B1:SLC21A6)-mediated hepatic uptake and CYP2C8-mediated metabolism of cerivastatin: analysis of the mechanism of the clinically relevant drug-drug interaction between cerivastatin and gemfibrozil. J Pharmacol Exp Ther 2004;311:228–36.
23. Prueksaritanont T, Zhao JJ, Ma B, Roadcap BA, Tang C, Qiu Y, et al. Mechanistic studies on metabolic interactions between gemfibrozil and statins. J Pharmacol Exp Ther 2002;301:1042–51.
24. Matsushima S, Maeda K, Kondo C, Hirano M, Sasaki M, Suzuki H, et al. Identification of the hepatic efflux transporters of organic anions using double-transfected Madin-Darby canine kidney II cells expressing human organic anion-transporting polypeptide 1B1 (OATP1B1)/multidrug resistance-associated protein 2, OATP1B1/multidrug resistance 1, and OATP1B1/ breast cancer resistance protein. J Pharmacol Exp Ther 2005;314:1059–67.
25. Scripture CD, Pieper JA. Clinical pharmacokinetics of fluvastatin. Clin Pharmacokinet 2001;40:263–81.
26. Bi YA, Qiu X, Rotter CJ, Kimoto E, Piotrowski M, Varma MV, et al. Quantitative assessment of the contribution of sodium-dependent taurocholate co-transporting polypeptide (NTCP) to the hepatic uptake of rosuvastatin, pitavastatin and fluvastatin. Biopharm Drug Dispos 2013;34:452–61.
27. Noe J, Portmann R, Brun ME, Funk C. Substrate-dependent drug-drug interactions between gemfibrozil, fluvastatin and other organic anion-transporting peptide (OATP) substrates on OATP1B1, OATP2B1, and OATP1B3. Drug Metab Dispos 2007;35:1308–14.
28. Fujino H, Yamada I, Shimada S, Yoneda M, Kojima J. Metabolic fate of pitavastatin, a new inhibitor of HMG-CoA reductase: human UDP-glucuronosyltransferase enzymes involved in lac-tonization. Xenobiotica 2003;33:27–41.
29. Hirano M, Maeda K, Matsushima S, Nozaki Y, Kusuhara H, Sugiyama Y. Involvement of BCRP (ABCG2) in the biliary excretion of pitavastatin. Mol Pharmacol 2005;68:800–7. 30. Corsini A, Ceska R. Drug-drug interactions with statins: will
pitavastatin overcome the statins’ Achilles’ heel? Curr Med Res Opin 2011;27:1551–62.
31. Liu Y, She M, Wu Z, Dai R. The inhibition study of human UDP-glucuronosyltransferases with cytochrome P450 selec-tive substrates and inhibitors. J Enzyme Inhib Med Chem 2011;26:386–93.
32. Lau YY, Okochi H, Huang Y, Benet LZ. Multiple transporters affect the disposition of atorvastatin and its two active hydroxy meta-bolites: application of in vitro and ex situ systems. J Pharmacol Exp Ther 2006;316:762–71.
33. Cummins CL, Jacobsen W, Benet LZ. Unmasking the dynamic interplay between intestinal P-glycoprotein and CYP3A4. J Pharmacol Exp Ther 2002;300:1036–45.
34. El-Sheikh AA, Greupink R, Wortelboer HM, van den Heuvel JJ, Schreurs M, Koenderink JB, et al. Interaction of immunosuppres-sive drugs with human organic anion transporter (OAT) 1 and OAT3, and multidrug resistance-associated protein (MRP) 2 and MRP4. Transl Res 2013;162:398–409.
35. Ho RH, Tirona RG, Leake BF, Glaeser H, Lee W, Lemke CJ, et al. Drug and bile acid transporters in rosuvastatin hepatic uptake: function, expression, and pharmacogenetics. Gastroenterology 2006;130:1793–806.
36. Xia CQ, Liu N, Miwa GT, Gan LS. Interactions of cyclosporin a with breast cancer resistance protein. Drug Metab Dispos 2007;35:576–82.
37. Annaert P, Ye ZW, Stieger B, Augustijns P. Interaction of HIV protease inhibitors with OATP1B1, 1B3, and 2B1. Xenobiotica 2010;40:163–76.
38. Eagling VA, Back DJ, Barry MG. Differential inhibition of cytochrome P450 isoforms by the protease inhibitors, ritonavir, saquinavir and indinavir. Br J Clin Pharmacol 1997;44:190–4. 39. Everett DW, Chando TJ, Didonato GC, Singhvi SM, Pan HY,
Weinstein SH. Biotransformation of pravastatin sodium in humans. Drug Metab Dispos 1991;19:740–8.
40. Sasaki M, Suzuki H, Ito K, Abe T, Sugiyama Y. Transcellular trans-port of organic anions across a double-transfected Madin-Darby canine kidney II cell monolayer expressing both human organic anion-transporting polypeptide (OATP2/SLC21A6) and multidrug resistance-associated protein 2 (MRP2/ABCC2). J Biol Chem 2002;277:6497–503.
41. Nakagomi-Hagihara R, Nakai D, Tokui T. Inhibition of human organic anion transporter 3 mediated pravastatin transport by gemfibrozil and the metabolites in humans. Xenobiotica 2007;37:416–26.
42. Kyrklund C, Backman JT, Neuvonen M, Neuvonen PJ. Gemfibrozil increases plasma pravastatin concentrations and reduces pravastatin renal clearance. Clin Pharmacol Ther 2003;73: 538–44.
43. Kunze A, Huwyler J, Poller B, Gutmann H, Camenisch G. In vitro-in vivo extrapolation method to predict human renal clearance of drugs. J Pharm Sci 2014;103:994–1001.
44. Niemi M, Arnold KA, Backman JT, Pasanen MK,
Godtel-Armbrust U, Wojnowski L, et al. Association of genetic polymorphism in ABCC2 with hepatic multidrug resistance-associated protein 2 expression and pravastatin pharmacoki-netics. Pharmacogenet Genomics 2006;16:801–8.
45. Martin PD, Warwick MJ, Dane AL, Hill SJ, Giles PB, Phillips PJ, et al. Metabolism, excretion, and pharmacokinetics of rosuvastatin in healthy adult male volunteers. Clin Ther 2003;25:2822–35.
46. Keskitalo JE, Zolk O, Fromm MF, Kurkinen KJ, Neuvonen PJ, Niemi M. ABCG2 polymorphism markedly affects the pharma-cokinetics of atorvastatin and rosuvastatin. Clin Pharmacol Ther 2009;86:197–203.
47. Verhulst A, Sayer R, De Broe ME, D’Haese PC, Brown CD. Human proximal tubular epithelium actively secretes but does not retain rosuvastatin. Mol Pharmacol 2008;74:1084–91. 48. Windass AS, Lowes S, Wang Y, Brown CD. The contribution of
organic anion transporters OAT1 and OAT3 to the renal uptake of rosuvastatin. J Pharmacol Exp Ther 2007;322:1221–7.
49. Pfeifer ND, Bridges AS, Ferslew BC, Hardwick RN, Brouwer KL. Hepatic basolateral efflux contributes significantly to rosuvas-tatin disposition II: characterization of hepatic elimination by basolateral, biliary, and metabolic clearance pathways in rat isolated perfused liver. J Pharmacol Exp Ther 2013;347:737–45. 50. Pfeifer ND, Yang K, Brouwer KL. Hepatic basolateral efflux
contributes significantly to rosuvastatin disposition I: charac-terization of basolateral versus biliary clearance using a novel protocol in sandwich-cultured hepatocytes. J Pharmacol Exp Ther 2013;347:727–36.
51. Martin PD, Warwick MJ, Dane AL, Brindley C, Short T. Absolute oral bioavailability of rosuvastatin in healthy white adult male volunteers. Clin Ther 2003;25:2553–63.
52. Jamei M, Bajot F, Neuhoff S, Barter Z, Yang J,
Rostami-Hodjegan A, et al. A mechanistic framework for in vitro-in vivo extrapolation of liver membrane transporters: prediction of drug-drug interaction between rosuvastatin and cyclosporine. Clin Pharmacokinet 2014;53:73–87.
53. Pasanen MK, Fredrikson H, Neuvonen PJ, Niemi M. Different effects of SLCO1B1 polymorphism on the pharmacokinetics of atorvastatin and rosuvastatin. Clin Pharmacol Ther 2007;82:726–33.
54. Kirchheiner J, Kudlicz D, Meisel C, Bauer S, Meineke I, Roots I, et al. Influence of CYP2C9 polymorphisms on the pharmacoki-netics and cholesterol-lowering activity of (-)-3S,5R-fluvastatin
and (+)-3R,5S-fluvastatin in healthy volunteers. Clin Pharmacol Ther 2003;74:186–94.
Supplemental Material: The online version of this article (DOI 10.1515/dmdi-2015-0003) offers supplementary material, available to authorized users.