HAL Id: hal-02420790
https://hal.archives-ouvertes.fr/hal-02420790
Submitted on 20 Dec 2019
HAL is a multi-disciplinary open access archive for the deposit and dissemination of sci-entific research documents, whether they are pub-lished or not. The documents may come from teaching and research institutions in France or abroad, or from public or private research centers.
L’archive ouverte pluridisciplinaire HAL, est destinée au dépôt et à la diffusion de documents scientifiques de niveau recherche, publiés ou non, émanant des établissements d’enseignement et de recherche français ou étrangers, des laboratoires publics ou privés.
formage de composites thermoplastiques
Paris Dilip Mulye, Lionel Morancay, Christophe Binetruy, Adrien Leygue,
Sébastien Comas-Cardona, Pierre Pichon, Damien Guillon
To cite this version:
Paris Dilip Mulye, Lionel Morancay, Christophe Binetruy, Adrien Leygue, Sébastien Comas-Cardona, et al.. Modélisation numérique de l’adhésion inter-pli dans le formage de composites thermoplastiques. 21ème Journées Nationales sur les Composites, École Nationale Supérieure d’Arts et Métiers (ENSAM) - Bordeaux, Jul 2019, Bordeaux, Talence, France. �hal-02420790�
Modélisation numérique de l’adhésion inter-pli dans le formage de composites
thermoplastiques
Numerical modeling of interply adhesion in thermoplastic composite forming
Paris Dilip Mulye1,2, Lionel Morançay1, Christophe Binetruy2, Adrien Leygue2, Sebastien Comas-Cardona2,
Pierre Pichon3, Damien Guillon3 1 : Altair RADIOSS Development
Altair Engineering France
1300, route des cretes, WTC Batiment 4, Entree M, 06560 Valbonne e-mail : [email protected] and [email protected]
2 : Research Institute in Civil Engineering and Mechanics (GeM), UMR CNRS 6183 École Centrale de Nantes
1, rue de la Noë, BP 92101, Nantes Cedex 3, 44321, France
e-mail : [email protected], [email protected] and [email protected]
3 : Pôle Ingénierie Polymères & Composite CETIM
Technocampus Composites, Z.I. du Chaffault, 44340, Bouguenais, France e-mail : [email protected]
Résumé
Le procédé QSP®est un procédé de formage d’une préforme composite thermoplastique optimisée constituée de patchs
préimprégnés unidirectionnels et tissés discontinus. Les patchs sont découpés de façon à limiter les chutes, puis sont distribués stratégiquement dans la préforme à plat, chauffés et formés rapidement pour atteindre un temps de cycle court d’environ une minute. L’adhésion interplis joue un rôle important dans le procédé QSP®en raison de l’absence de cadre
serre-flancs et de la présence d’une couche riche en polymère fondu à l’interface des plis qui favorise le glissement entre les couches et assure une certaine cohésion entre les plis. La non prise en compte de l’adhésion inter-couches dans la simulation numérique conduit à des résultats irréalistes où les plis se désolidarisent sans aucune résistance, et entraîne des positions finales incorrectes des plis. Un modèle semi-empirique de contact fondé sur les constatations expérimentales et reposant sur la méthode des pénalités a été développé et implémenté dans le code industriel d’éléments finis Altair RADIOSS™
. Il autorise de grands glissements entre les plis tout en assurant un niveau d’adhésion maximal entre les plis avant séparation. Les comparaisons calcul/expérience indiquent que les positions finales des plis sont prédites avec une meilleure précision.
Abstract
"Quilted Stratum Process" (QSP®) is a unique process in the category of thermoplastic composite forming with the objective
to locally strengthen the composite parts by strategically stacking discontinuous UD/woven prepregs while maintaining the short cycle time of about one minute. Interply adhesion plays an important role in QSP®
due to the presence of resin-rich layer at the ply-ply interface, inability to use blank holders for prepreg patches and high temperature of forming process where the resin is in melt state. Without modeling interply adhesion in the numerical simulation, plies could delaminate without any resistance which is unrealistic and it also results in incorrect final positions of the plies. Thus, a penalty based, semi-empirical contact model for interply adhesion has been developed and implemented in the industrial finite element code of Altair RADIOSS™. This model allows large sliding of plies while providing a finite maximum interply
adhesive stress before delamination. With this semi-empirical model, the final positions of the plies is predicted with better accuracy.
Mots Clés : Formage, préimprégnés thermoplastiques, patchs, modélisation adhésion interplis, simulation numérique Keywords : Forming, thermoplastic prepregs, discontinuous patches, interply adhesion modeling, numerical simulation
1. Introduction
The usage of composites parts in modern day industry has been increasing significantly mainly due to their high strength to weight ratio which makes them good candidates for structural components.
Forming of Thermoplastic Composites (TPC) is a process which is well suited for mass production due to its short cycle time of about one minute, ease of recycling of thermoplastics and its ability to create components with complex shapes. Added with this is the ability to perform one shot operations on the components without any significant overhead in process time [1].
1.1. Quilted Stratum Process : QSP®
In 2012, CETIM, Ecole Centrale de Nantes and other partners developed a modified version of the standard thermoplastic composite forming process called "Quilted Stratum Process" (QSP®) [1]. The
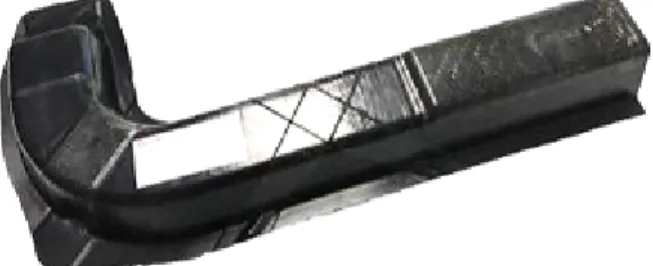
main idea behind this process is to use discontinuous UD/woven thermoplastic prepreg patches instead of using uniformly shaped prepreg stack as is the case with standard thermoforming process. Thus, even components with complex geometries and curvatures can be formed by using near-rectangular discontinuous patches. A stack of such prepreg patches (Fig. 1) can be formed into the final component (Fig. 2) using QSP®. The patch placement is strategically optimized based on the loading to be
experienced by the component. Usage of near-rectangular patches and local strengthening of the components reduce material wastage at the same time creating an optimum component performance.
Fig. 1.: Flat 2D stack of prepregs before QSP®
Fig. 2.: Thermoformed 3D final shape after QSP®
1.2. Challenges with QSP®
Despite the numerous advantages of QSP®
, there are some challenges associated with the process and subsequently its simulation some of which are described in [2]. After the prepreg patches are cut as per requirements, a stack is created with the help of a robotic arm which places the patches at pre-specified locations. During this, the discontinuous patches are spot welded using local heating. After this stage, the stack is transferred to an infrared oven where it is heated above the melt temperature of resin. Then this stack is transferred to a colder mold where it undergoes two main stages : forming and consolidation. This work however focuses on the phenomena occurring in the forming stage. During forming stage, the following observations can be made :
— The resin is in melt state since the temperature during this phase is still in the range of melting temperature of resin.
— A resin-rich layer exists at the ply-ply interface [3, 4]
— Melt state of resin at the interply interface can result in large sliding (maximum patch sliding reported by [2] is 24.5 mm) and rotation of discontinuous patches (maximum patch rotation reported by [4] is 8 − 10◦).
It is important to note that contrary to the standard composite forming process, the use of disconti-nuous patches in QSP®
makes it impossible to use a blank holder. These unique phenomena make it challenging to predict the final position of the patches which is very important in the design of the component.
1.3. Numerical simulation of QSP®
Numerical simulation plays a key role in a design of a manufacturing process by removing the need to do experimental try-and-error tests. It therefore serves the purpose of shortening the process design
cycle both in terms of cost and time. Also, with the availability of realistic simulation tools, process parameters can be optimized virtually, using a computer. Thus, a good numerical simulation needs to be as close as possible to the real physics of the process. At the same time, it should be fast enough to have low impact on overall process design time. Thus, one needs to find a balance while developing a numerical solution. For the simulation of QSP®, one should be able to correctly predict sliding and/or
rotation of patches and other significant physical phenomena involved in the process. Altair RADIOSS™
is on top of the industrial FE codes which are used for crash simulation as well as for fluid-structure interaction or stamping process simulation. Due to the in-built rich database of constitutive material models, element formulations, various contact algorithms, scalability and speed ; Altair RADIOSS™
code is a very suitable candidate for full scale numerical simulation of QSP®
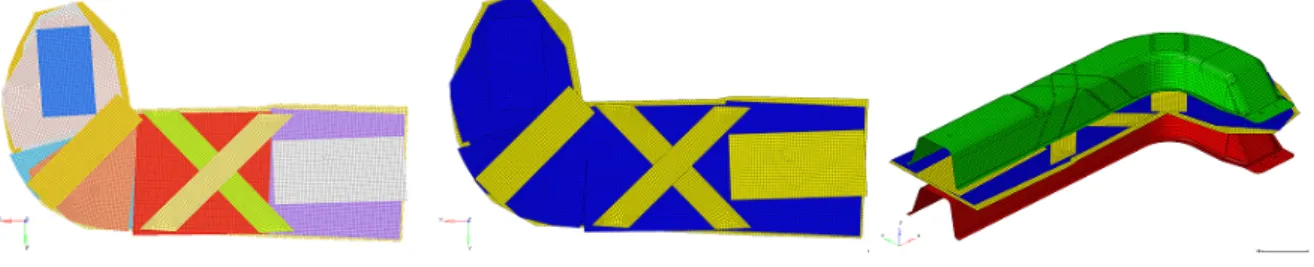
. We consider the numerical simulation of the same component previously shown in Fig. 2. The stack of prepregs consists of 13 plies (Fig. 3), which has both UD and woven thermoplastic prepregs (Fig. 4) of various orientations and thicknesses. Each ply is modeled with 4 node shell elements (created at the mid-surfaces of plies) with full integration using 4 gauss points ([5, 6]). The ply-ply interaction is modeled with a penalty based contact formulation in Altair RADIOSS™. An explicit analysis is
used for the simulation. The material behavior of each prepreg ply is modeled by overlapping (with co-incident nodes) one set of shell elements obeying fabric behavior (Law-58 in [6]) with another set of shell elements obeying resin behavior (Law-42 in [6]).
Fig. 3.: Prepreg 2D stack mo-del, individual plies
Fig. 4.: UD plies (Blue), woven plies (Yellow)
Fig. 5.: Simulation setup : 3D view
Fig. 5 shows the complete assembly of the plies along with punch (shown in green color) and die (shown in red color). The die and the punch are modeled with rigid elements with appropriate contacts defined for the interaction between plies and die/punch.
1.4. Challenges with Numerical simulation of QSP®
During forming phase of the process, since the resin is in melt state, it is important to model the polymer tack. The discussion about tack of polymers can be found in [7, 8, 9]. Several experimental investigations have been done mainly for pressure sensitive adhesives (PSA) [10, 11, 12] and for UD/woven thermoset prepregs [13, 14, 15, 16]. The probe tack test has been used as a standard way to measure tack of PSA [17, 18].
The importance of modeling tack is even more for a process like QSP® due to the absence of blank
holder which would otherwise help in keeping the plies together. Thus, in simulation of QSP®
, if interply tack is not modeled, the stack of plies could delaminate without any resistance which is physically unrealistic. Also, this affects the final position of the discontinuous patches. An interesting approach of cohesive zone elements was used at the interface to model ply-ply interaction in [19], however, this approach is not suitable for QSP®, where the sliding amount could be large. Due to the
lack of a standardized test for characterization of adhesion for thermoplastic prepregs, an educated guess has been used to model interply adhesion in [20].
2. Transverse interply adhesion model 2.1. Mechanism
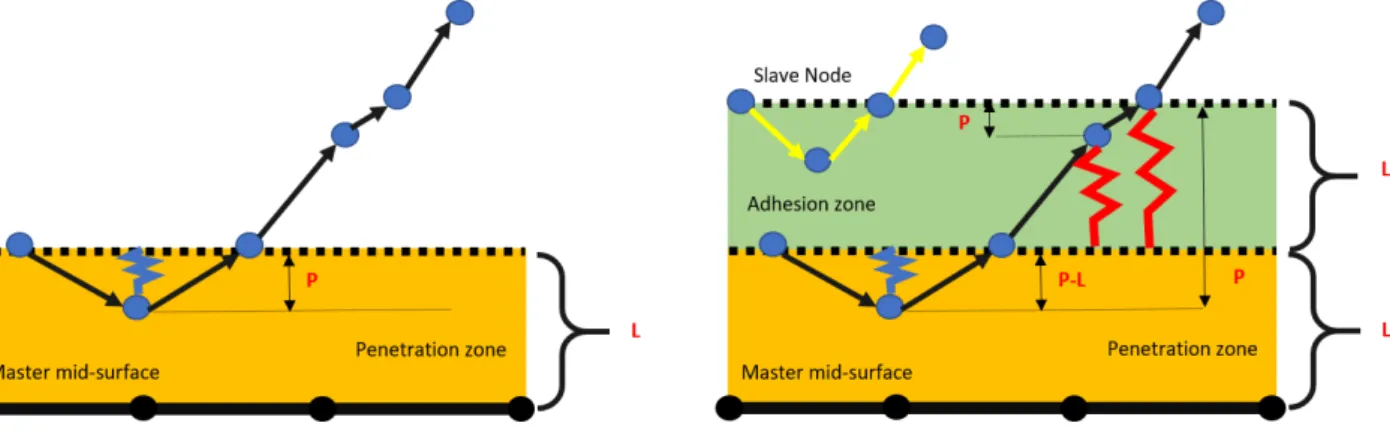
To model the tack which in turn would provide interply adhesion in the direction normal to the surface of the ply, a semi-empirical numerical model is proposed. The standard penalty based contact algorithm is shown in Fig. 6 where a penetration resistive spring is added whenever the slave node enters the penetration zone. The thickness of penetration zone is given by L = 0.5 × (tmaster+ tslave),
where tmaster and tslave are the thicknesses of master and slave respectively. This model is modified
to have an additional zone of thickness L which extends beyond the penetration zone, called adhesion zone (Fig. 7). The main idea is that, as soon as the slave node touches/enters into the penetration zone, an additional adhesive spring is created. This spring has no effect in the penetration zone. Thus, it behaves the same as that of the standard contact algorithm inside penetration zone. However, as the slave node tries to move away from the master and comes in the adhesion zone, adhesive spring (whose base is connected at the interface of adhesion and penetration zone) exerts adhesive forces pulling master and slave pair towards each other. A simple linear force-displacement relationship is used which is given by Eq. 1,
Fadhesion =
σmax A
L (L − P) (Eq. 1)
Where, σmax is the adhesive strength, A is the contact area, P is the distance measured with reference
to the outer boundary of the adhesion zone. As the node is further pulled and it reaches the outer boundary of adhesion zone, adhesion spring ruptures representing delamination. The adhesive spring is recreated in case the slave node enters the penetration zone again.
The first advantage of this mechanism is that transverse adhesive force solely depends on the relative position of the slave with respect to a master. Thus it is suitable for cases where one wants to allow large sliding while exhibiting transverse adhesion. The second advantage is its ability to re-create the adhesive springs if the plies come in contact again after delamination.
Fig. 6.: Standard penalty based contact mecha-nism
Fig. 7.: Modified contact mechanism with adhe-sion
Note that this mechanism takes a computational liberty in assuming that the adhesion zone extends up to a thickness of L which is done for two reasons. The first one is to reduce the amount of characterization involved. The only input this model needs is the adhesive strength σmax. The second
reason is that if the adhesion zone thickness is very small, it will reduce the time step of explicit solver significantly, increasing its computational cost subsequently.
2.2. Flat plates with adhesion
To demonstrate the mechanism, a simple case with two flat plates is considered here. Each plate is of thickness 0.5 mm and is modeled with 4 node shell elements at the mid-surfaces. The side view of
this setup is shown in Fig. 8. The bottom plate is fixed in all DOFs and the top plate is subjected to time varying imposed vertical (normal to the plies) displacement load such that the distance between plates is as shown in Fig. 9.
Fig. 8.: Flat plates with adhesion numerical test setup
Fig. 9.: Imposed vertical displacement on top plate versus time in seconds
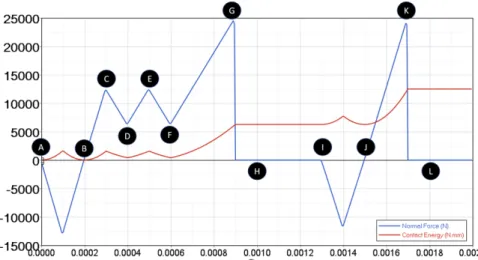
The measured forces (N) and energy (N.mm) response are shown in Fig. 10. During the path A-B, the plate experiences penetration, thus creating an adhesion spring. The force experienced during this path is the penetration resistive force which forces the slave and master away from each other. During path B-C-D-E-F, the adhesion spring undergoes cycles of stretching and relaxation which is reflected in the corresponding force and energy response. Also, it is important to notice that the adhesive force has a different sign compared to the penetration resistive force, since the adhesion forces try to pull master and slave surfaces together whereas penetration resistive forces try to separate them. At location G, the adhesion spring is fully stretched (exhibiting maximum adhesion force) and after this point, the spring ruptures. Note that after point H, even though the top plate enters adhesion zone, the adhesive spring is not created until it reaches the penetration zone again (point I). Path J-K demonstrates the second cycle of adhesion-rupture. With each rupture of the adhesion spring, there is an irreversible storage into the contact energy implying dissipation.
3. Full scale numerical simulation with interply adhesion
For the full scale implementation, a complete representation of the interface mechanisms is needed. Therefore, in addition to the transverse interply adhesion, a model for tangential interaction between the plies is needed. Since, the interest of this work is in the forming phase of the process, there is no significant consolidation pressure on the plies. Therefore, the viscous slip law [21] is chosen for implementation over the stribeck curve approach [22]. In terms of mechanism, irrespective of the zone where a slave node resides, an opposing tangential force is applied which is given by Eq. 2.
Fig. 10.: Measured interply force and contact energy versus time in seconds
Ftangential = S
η A
L (Vr el) (Eq. 2)
Where, η is the viscosity of melt thermoplastic, A is the contact area and Vr el is the tangential relative
velocity of the slave node with respect to master. In many full scale industrial models consisting of multiple plies with different architecture and fibre orientations, it is difficult to measure the thickness of resin rich layer. Therefore, a normalized length L is used in Eq. 2. However, a scaling factor S is provided which can be used to scale-up/down the tangential viscous forces based on the available information about the resin rich layer thickness.
Fig. 11.: Ply delamination : re-gion of interest
Fig. 12.: Interply behavior : without adhesion
Fig. 13.: Interply behavior : with adhesion
The proposed interply adhesion model along with the tangential viscous slip law are added to Altair RADIOSS™and a full scale numerical simulation was performed for the case demonstrated in Fig. 1.
The optimal values of the parameters were found by performing different simulations. The maximum adhesive stress was set to 0.1MPa, a viscosity of 300Pa.s was used. In future, these parameters will be calibrated with material characterization in order to provide a complete solution for the process simulation. An optimal scaling factor was found to be 0.2.
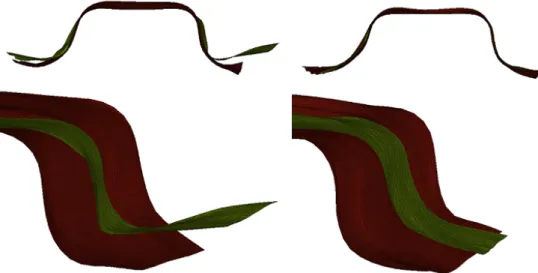
Fig. 11 shows the position of the plies at an intermediate time-step in the simulation. The delamination of plies without any resistance was observed when interply adhesion is not modeled (Fig. 12 and Fig. 14). On the other hand, with the added interply adhesion model, the plies provided a finite resistance before delamination (Fig. 13 and Fig. 15). Also, the final position of the various plies were compared with the experimental observations. It was found that addition of these interface mechanisms results in a better prediction of final position of plies. In Fig. 16, the final experimental shape is shown
Fig. 14.: Interply behavior : without adhesion
Fig. 15.: Interply behavior : with adhe-sion
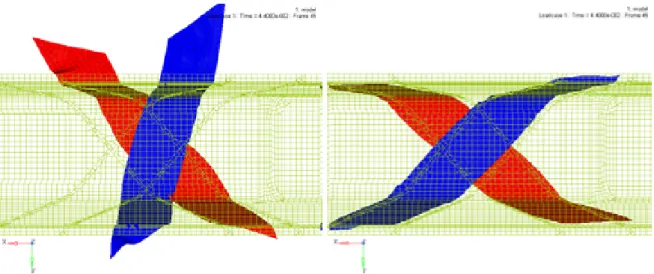
and the ply of interest is outlined in yellow color. As it can be seen from Fig. 17, the final position of the ply is not correctly predicted in the simulation, whereas after the addition of interface mechanisms (Fig. 18), the prediction is closer to the real scenario. Similar comparison is made for the two woven fabric patches shown in Fig. 19. The final ply positions of these discontinuous woven fabric prepreg patches were significantly different from the observed positions when no adhesion is added (Fig. 20). After adding interply mechanisms, it can be seen that the results are much closer to the reality Fig. 21.
Fig. 16.: Final position of a dis-continuous ply : Experiments
Fig. 17.: Final position of a dis-continuous ply : without adhe-sion
Fig. 18.: Final position of a dis-continuous ply : with adhesion
4. Conclusion
To conclude, in this work, we have proposed a semi-empirical model for modeling transverse interply adhesion, which allows sliding of plies while providing a finite resistance for delamination with the possibility of re-creating adhesion if the plies come in contact again. The model requires very less characterization making it suitable for industrial application involving several plies. At the same time, it is flexible to adapt based on additional information such as resin rich layer thickness. The model has improved the prediction of final positions of the plies in QSP® which is a challenge for this process
Fig. 19.: Final position of woven prepreg patches : experiments
Fig. 20.: Final position of woven prepreg patches : without adhesion
Fig. 21.: Final position of woven prepreg patches : with adhesion
due to the discontinuous nature of the prepreg patches. In terms of computational performance, the model has been implemented for shared memory processors (SMP) as well as single program multiple data (SPMD) architecture of parallel programming making is scalable. The ongoing and future work involves calibration and validation of interply adhesion with the use of experiments on melt prepregs thereby providing a complete solution for the forming phase of QSP®
process simulation. Remerciements
The authors want to thank ANRT (CIFRE #2017/1621) for financial support for the PhD thesis of Paris Dilip Mulye.
Références
[1] D. Guillon, A. Lemasçon, C. Callens « QSP® : An innovative process based on tailored preforms for low cost and fast production of optimized thermoplastic composite parts », in : Proceedings of the 17th European Conference on Composite Materials ECCM17, ICM – Internationales Congress Center München, , pp. 5.607–5.614, 2016. [2] J. Schell, L. Amory, D. Guillon « Movement of patches during thermoforming : Experiment and simulation », in :
Proceedings of the 19th International ESAFORM Conference on Material Forming, Nantes, France, , pp. 206.1– 206.6, 2016.
[3] F. N. Cogswell, Thermoplastic aromatic polymer composites : a study of the structure, processing and properties of carbon fibre reinforced polyetheretherketone and related materials, Elsevier, 2013.
[4] G. Sorba, C. Binetruy, A. Leygue, S. Comas-Cardona « Squeeze flow in heterogeneous unidirectional discontinuous viscous prepreg laminates : Experimental measurement and 3D modeling », Composites Part A : Applied Science
and Manufacturing Vol. 103, pp. 196–207, 2017.
[5] E. N. Dvorkin, K.-J. Bathe « A continuum mechanics based four-node shell element for general non-linear analysis »,
[6] Altair RADIOSSTMTheory Manual, Version 2018, January 2018.
[7] C. Gay, L. Leibler « Theory of tackiness », Physical review letters Vol. 82 n° 5, pp. 936, 1999.
[8] C. Gay « Stickiness—some fundamentals of adhesion », Integrative and comparative biology Vol. 42 n° 6, pp. 1123– 1126, 2002.
[9] C. Gay « Some fundamentals of adhesion in synthetic adhesives », Biofouling Vol. 19 n° S1, pp. 53–57, 2003. [10] A. Gillanders, S. Kerr, T. Martin « Determination of prepreg tack », International Journal of Adhesion and Adhesives
Vol. 1 n° 3, pp. 125–134, 1981.
[11] A. Zosel « Adhesion and tack of polymers : Influence of mechanical properties and surface tensions », Colloid and
Polymer Science Vol. 263 n° 7, pp. 541–553, 1985.
[12] H. Lakrout, P. Sergot, C. Creton « Direct observation of cavitation and fibrillation in a probe tack experiment on model acrylic pressure-sensitive-adhesives », The Journal of Adhesion Vol. 69 n° 3-4, pp. 307–359, 1999.
[13] J. Putnam, J. Seferis, T. Pelton, M. Wilhelm « Perceptions of prepreg tack for manufacturability in relation to experimental measures », Science and Engineering of Composite Materials Vol. 4 n° 3, pp. 143–154, 1995. [14] R. Banks, A. Mouritz, S. John, F. Coman, R. Paton « Development of a new structural prepreg : characterisation of
handling, drape and tack properties », Composite Structures Vol. 66 n° 1-4, pp. 169–174, 2004.
[15] R. Crossley, P. Schubel, N. Warrior « The experimental characterisation of prepreg tack », in : The 17th International Conference on Composite Materials (ICCM-17), 2009.
[16] O. Dubois, J.-B. Le Cam, A. Beakou « Experimental analysis of prepreg tack », Experimental Mechanics Vol. 50 n° 5, pp. 599–606, 2010.
[17] B. Lestriez, H. Lakrout, A. Chiche, A. Roos, C. Creton « Probe tack tests as a characterization tool in pressure-sensitive-adhesives », in : Proceedings of the PSTC Technical Seminar TECH XXIV, Orlando, FL, USA, , pp. 2–4, 2001.
[18] D. ASTM « Standard Test Method for Pressure-Sensitive Tack of Adhesives Using an Inverted Probe Machine »,
ASTM D2979–01.
[19] Q. Chen, P. Boisse, C. H. Park, A. Saouab, J. Bréard « Intra/inter-ply shear behaviors of continuous fiber reinforced thermoplastic composites in thermoforming processes », Composite Structures Vol. 93 n° 7, pp. 1692–1703, 2011. [20] S. Haanappel « Forming of UD fibre reinforced thermoplastics », Ph.D. thesis, University of Twente, 2013.
[21] E. A. D. Lamers « Shape distortions in fabric reinforced composite products due to processing induced fibre reorientation », Universiteit Twente , pp. 134, 2004.
[22] U. Sachs, R. Akkerman, K. Fetfatsidis, E. Vidal-Sallé, J. Schumacher, G. Ziegmann, S. Allaoui, G. Hivet, B. Maron, K. Vanclooster, et al. « Characterization of the dynamic friction of woven fabrics : experimental methods and benchmark results », Composites Part A : Applied Science and Manufacturing Vol. 67, pp. 289–298, 2014.