HAL Id: hal-00297937
https://hal.archives-ouvertes.fr/hal-00297937
Submitted on 12 Nov 2007HAL is a multi-disciplinary open access
archive for the deposit and dissemination of sci-entific research documents, whether they are pub-lished or not. The documents may come from teaching and research institutions in France or abroad, or from public or private research centers.
L’archive ouverte pluridisciplinaire HAL, est destinée au dépôt et à la diffusion de documents scientifiques de niveau recherche, publiés ou non, émanant des établissements d’enseignement et de recherche français ou étrangers, des laboratoires publics ou privés.
Effects of CO2 on particle size distribution and
phytoplankton abundance during a mesocosm bloom
experiment (PeECE II)
A. Engel, K. Schulz, U. Riebesell, R. Bellerby, B. Delille, M. Schartau
To cite this version:
A. Engel, K. Schulz, U. Riebesell, R. Bellerby, B. Delille, et al.. Effects of CO2 on particle size distribu-tion and phytoplankton abundance during a mesocosm bloom experiment (PeECE II). Biogeosciences Discussions, European Geosciences Union, 2007, 4 (6), pp.4101-4133. �hal-00297937�
BGD
4, 4101–4133, 2007CO2 effects on particle size and
phytoplankton abundance A. Engel et al. Title Page Abstract Introduction Conclusions References Tables Figures ◭ ◮ ◭ ◮ Back Close
Full Screen / Esc
Printer-friendly Version Interactive Discussion
Biogeosciences Discuss., 4, 4101–4133, 2007 www.biogeosciences-discuss.net/4/4101/2007/ © Author(s) 2007. This work is licensed
under a Creative Commons License.
Biogeosciences Discussions
Biogeosciences Discussions is the access reviewed discussion forum of Biogeosciences
Effects of CO
2
on particle size distribution
and phytoplankton abundance during a
mesocosm bloom experiment (PeECE II)
A. Engel1, K. Schulz2, U. Riebesell2, R. Bellerby3, B. Delille4, and M. Schartau5
1
Alfred Wegener Institute for Polar and Marine Research, Bremerhaven, Germany
2
Leibniz Institute of Marine Sciences, IFM-GEOMAR, Kiel, Germany
3
Bjerknes Centre for Climate Research, University of Bergen, Bergen, Norway
4
Unit ´e d’Oc ´eanographie Chimique, MARE, Universit ´e de Li `ege, Li `ege, Belgium
5
Institute for Coastal Research, GKSS Research Centre, Geesthacht, Germany
Received: 19 October 2007 – Accepted: 23 October 2007 – Published: 12 November 2007 Correspondence to: A. Engel ([email protected])
BGD
4, 4101–4133, 2007CO2 effects on particle size and
phytoplankton abundance A. Engel et al. Title Page Abstract Introduction Conclusions References Tables Figures ◭ ◮ ◭ ◮ Back Close
Full Screen / Esc
Printer-friendly Version Interactive Discussion
Abstract
The influence of seawater CO2 concentration on the size distribution of suspended particles (2–60µm) and on phytoplankton abundance was investigated during a
meso-cosm experiment at the large scale facility (LFS) in Bergen, Norway, in the frame of the Pelagic Ecosystem CO2Enrichment study (PeECE II). In nine outdoor enclosures the
5
partial pressure of CO2 in seawater was modified by an aeration system to simulate past (∼190 parts per million by volume (ppmV) CO2), present day (∼370 ppmV CO2) and future (∼700 ppmV CO2) CO2 conditions in triplicates. Due to initial addition of inorganic nutrients, phytoplankton blooms developed in all mesocosms and were mon-itored over a period of 19 days. Seawater samples were collected daily for analysing
10
the abundance of suspended particles and phytoplankton with the Coulter Counter and Flow Cytometry, respectively. During the bloom period, the abundance of small parti-cles (<4 µm) significantly increased at past, and decreased at future CO2 levels. At that time, the total surface to total volume ratio of suspended particles was significantly related to DIC concentration in all mesocosms. Significant changes with respect to the
15
CO2 treatment were also observed in the phytoplankton community structure. While some populations such as diatoms seemed to be insensitive to the CO2 treatment, others like Micromonas spp. increased with CO2, or showed maximum abundance at present day CO2(i.e. Emiliania huxleyi). The strongest response to CO2was observed in the abundance of small autotrophic nano-plankton that strongly increased during the
20
bloom in the past CO2mesocosms. Together, changes in particle size distribution and phytoplankton community indicate a complex interplay between the ability of the cell to physiologically respond to changes in CO2 and size selection. Size of cells is of gen-eral importance for a variety of processes in seawater such as diffusion-limited uptake of substrates, resource allocation, preditor-prey interactions, and gravitational settling.
25
The observed changes in particle size distribution are therefore discussed with respect to biogeochemical cycling and ecosystem functioning.
BGD
4, 4101–4133, 2007CO2 effects on particle size and
phytoplankton abundance A. Engel et al. Title Page Abstract Introduction Conclusions References Tables Figures ◭ ◮ ◭ ◮ Back Close
Full Screen / Esc
Printer-friendly Version Interactive Discussion
1 Introduction
The increase in atmospheric CO2 since the beginning of industrialisation, associated risks of ocean acidification, and the potential consequences for marine carbon cycling and global climate have recently gathered attention beyond purely scientific interest. Prior to the industrial burning of fossil fuels, CO2 concentration varied between 180
5
and 280 ppmV, with the lower values observed during glacial times. Since the mid-dle of the 18th century, the atmospheric concentration of CO2 (pCO2) has increased rapidly from 280 ppmV to 366 ppmV in 1998, and several future scenarios predict a further increase to 750 ppmV in 2100 (IPCC scenario IS92a) (Houghton et al., 2001). The seawater carbonate chemistry has responded noticeably, with a decrease from
10
preindustrial surface ocean pH of 8.25 down to 8.08 presently. Modelling studies pre-dict a further reduction of pH by 0.7 up to the year 2300, which would be more than experienced by marine life for the last 300 000 years (Caldeira and Wickett, 2003).
Although CO2plays a fundamental role for organic matter production in the ocean, as it is a substrate in algal photosynthesis, the direct effects of changes in CO2availability
15
on organism performance, and their possible transfer to the ecosystem level are still poorly understood. Only recently, studies showed that marine autotrophic communities such as seagrasses (Zimmerman et al., 1997), macroalgae (Gao et al., 1993), diatoms (Riebesell et al., 1993; Chen and Durbin, 1994), coccolithophores (Riebesell et al., 2000; Delille et al., 2005; Engel et al., 2005), and cyanobacteria (Qiu and Gao, 2002;
20
Barcelos e Ramos et al., 2007; Hutchins et al., 2007) exhibit higher rates of production under CO2 enrichment. It has also been shown that phytoplankton assemblages can experience marked shifts in composition under elevated pCO2 conditions (Boyd and Doney, 2002; Tortell et al., 2002).
The previous, rather minor scientific interest in direct effects of CO2 on marine
25
ecosystems largely resulted from the assumption that CO2 is a non-limiting substrate for primary production in seawater. Although CO2 concentrations are only in order
8–22µmol L−1 (Goerike and Fry, 1994), the total reservoir of dissolved inorganic
BGD
4, 4101–4133, 2007CO2 effects on particle size and
phytoplankton abundance A. Engel et al. Title Page Abstract Introduction Conclusions References Tables Figures ◭ ◮ ◭ ◮ Back Close
Full Screen / Esc
Printer-friendly Version Interactive Discussion
bon is about ∼2000 µmol/l. Thus, CO2 is continuously supplied from the pool of bi-carbonate and bi-carbonate. Riebesell et al. (1993) showed that marine phytoplankton may indeed be limited by ambient CO2 availability and that they respond to increased CO2concentration with increased growth rates. These results were somewhat contra-dictory to theoretical considerations that for most phytoplankton cells the supply with
5
CO2 by diffusion is much larger than the cell’s need for carbon (Wolf-Gladrow et al., 1999). Seemingly, it is the inefficiency of the CO2/O2fixing enzyme Ribulose-1,5 bis-phosphate-carboxylase/oxygenase (RubisCo), with a half-saturation constant (Km) of 20–70µmol L−1 (Badger et al., 1998), that can cause a rate limitation of primary pro-duction in marine phytoplankton. However, measurements of primary propro-duction of
10
various phytoplankton species yielded much lower Km values, indicating an enhanced CO2concentration at the site of carboxylation (Raven and Johnson, 1991; Rost et al., 2003; Giordano et al., 2005). Species with a low Km value have a high affinity to CO2 and/or HCO−3 and nearly saturate primary production at present day values, while at the same time minimizing energy loss due to photorespiration. An increase of CO2 in
15
these species must be anticipated to have no effect on primary production. In contrast, for species with high Km, such as the coccolithophore Emiliania huxleyi, an enhance-ment of carboxylation can be expected, if CO2concentration increase from low values
(6–8µmol L−1), as estimated for the last glacial maximum to high concentration as
expected for the future ocean (∼22 µmol/l) (Rost and Riebesell, 2004). Thus, under
20
conditions where CO2 concentration regulates growth (no co-limitation), species with high CO2 affinity perform better and might out-compete those with lower affinity. The Km value for CO2depends, among others, on the capability of the phytoplankton cell to express carbon concentrating mechanisms (CCMs), which include the enzymatically enhanced uptake of CO2 and/ or HCO−3 and/ or conversion of HCO−3 to CO2 (Raven
25
and Johnson, 1991; Giordano et al., 2005). CCM operation has been observed in many marine microalgae, and we can expect selective advantages for those species that most efficiently apply CCM to enhance carbon acquisition and cell growth. How-ever, like any enzymatically driven process, CCMs require energy and substrates, in
BGD
4, 4101–4133, 2007CO2 effects on particle size and
phytoplankton abundance A. Engel et al. Title Page Abstract Introduction Conclusions References Tables Figures ◭ ◮ ◭ ◮ Back Close
Full Screen / Esc
Printer-friendly Version Interactive Discussion
particular nitrogen, phosphate (ATP) and micronutrients for the synthesis and activa-tion of involved enzymes, such as carbonic anhydrase (Young and Beardall, 2005; Beardall et al., 2005). Thus, the ability to express CCM under natural conditions may be restrained by nutrient and light availability.
On the community level, theoretical considerations suggest that phytoplankton
re-5
spond to changes in substrate availability by variation of organism size (Irwin et al., 2006). In general, small cells have a higher surface to volume ratio and can faster satisfy the demand for substrates that are transported into the cell by diffusion. Ac-cordingly, if we assume that diffusion was a significant process for CO2-uptake by the cell, we would expect smaller cells to have a selective advantage over larger cells.
10
Hence, changes in size spectrum of natural phytoplankton communities in response to changes in CO2 concentration could potentially indicate the relevance of diffusive transport processes.
To the best of our knowledge, no studies have addressed direct effects of CO2 con-centration on the size distribution of particles during phytoplankton blooms so far, or
15
have dealt with the selective advantage of cell size variation versus physiological perfor-mance with respect to carbon uptake. Here, we investigate the effect of CO2availability on the size frequency distribution of marine phytoplankton under conditions mimicking a phytoplankton bloom during a mesocosm experiment.
2 Material and methods
20
2.1 Set-up of the mesocosm experiment
The study was conducted in the framework of the Pelagic Ecosystem CO2Enrichment Study (PeECE II) in spring 2003 at the Large Scale Facility in Bergen, Norway. Nine outdoor mesocosms (∼20 m3, 9.5 m depth) were filled with unfiltered, nutrient-poor, post-bloom fjord water, which was pumped from 2 m depth adjacent to the raft and
25
aerated with CO2/air mixtures in order to achieve 3 different CO2 levels (190 ppmV, 4105
BGD
4, 4101–4133, 2007CO2 effects on particle size and
phytoplankton abundance A. Engel et al. Title Page Abstract Introduction Conclusions References Tables Figures ◭ ◮ ◭ ◮ Back Close
Full Screen / Esc
Printer-friendly Version Interactive Discussion
370 ppmV and 700 ppmV) in triplicates. The general set-up of the mesocosm study has been described in Engel et al. (2005) and Delille et al. (2005) for a similar ex-periment (PeECE I) and in Grossart et al. (2006) for the 2003 exex-periment (PeECE II). Nutrients were added initially to obtain concentrations in the seawater of 8.6µmol L−1 nitrate, 0.38µmol L−1 phosphate and 12µmol L−1 phosphate silicate (Carbonel and
5
Chou, personal communication). Daily samples were taken from each mesocosm us-ing 4 m long Polyethylene tubes (10 cm diameter) integratus-ing the upper water column and transferred to 20 L carboys. Immediately after sampling the carboy were brought to the lab and subsamples were taken for various analyses. Intrusion of higher salinity water was observed for mesocosm 9 at day 9. Therefore, data from this mesocosm
10
after day 9 were disregarded. 2.2 Carbonate chemistry
Samples for total alkalinity (TA) and total dissolved inorganic carbon (DIC) were poi-soned with HgCl2on collection, stored in bottles with ground glass stoppers and filtered through GF/F filters prior to analysis. TA was measured using the classical Gran
po-15
tentiometric titration method (Gran, 1952). The reproducibility of measurements was usually within 4µmol kg−1. Dissolved inorganic carbon (DIC) was measured by coulo-metric titration (Johnson et al., 1987) with a precision of 2µmol kg−1. Other CO2 sys-tem variables (pH, CO2−3 , HCO−3) were calculated using the CO2SYS program (Lewis and Wallace, 1998).
20
The pCO2in seawater was measured by means of an equilibrator (Frankignoulle et al., 2001) coupled to an infrared analyzer (Li-Cor 6262). The system was calibrated routinely with air standards with nominal mixing ratios of 0 and 375 ppmV of CO2 (Air Liquide Belgium). Temperature at the inlet of the pump and in the equilibrator was measured simultaneously with two Li-Cor thermosensors. For each measurement of
25
CO2, samples for TA were taken. The pCO2 was corrected for temperature changes using the dissociation constants of Roy et al. (1993) and TA measurement.
BGD
4, 4101–4133, 2007CO2 effects on particle size and
phytoplankton abundance A. Engel et al. Title Page Abstract Introduction Conclusions References Tables Figures ◭ ◮ ◭ ◮ Back Close
Full Screen / Esc
Printer-friendly Version Interactive Discussion
2.3 Particulate organic matter
Total particulate carbon (TPC) and particulate organic nitrogen (PON) were determined by elemental analysis from 1 L (day 0–12) or 0.5 L (day 13–19) samples filtered gently (200 mbar) through precombusted (24 h, 500◦C) glass fibre filters (GF/F, Whatman). For determination of POC, filters were fumed for 2 h with saturated HCl to remove all
5
particulate inorganic carbon, and dried for 2 h at 50◦C. TPC, POC, and PON were subsequently measured on an Europa Scientific ANCA SL 20–20 mass spectrometer. 2.3.1 Solid particles
Concentration and size distribution of solid particles were determined with a Beckmann Coulter Counter (Coulter Multisizer III), according to Sheldon and Parsons (1978).
10
Three replicate samples of 2000µL volume were measured daily for each mesocosm
using the 120µm orifice tube. Particles between 2 and 60 µm equivalent spherical
diameters (ESD) were binned into 256 size classes. 2.3.2 Chlorophyll-a
Concentration of Chl-a was determined fluorometrically from 100 mL samples filtered
15
onto dublicate 0.45µm cellulose nitrate filters and extracted in 90% Acetone overnight.
Chl-a concentration was measured using a Turner Design fluorometer (model 10-AU)
and a standard solution of pure Chl-a for calibration.
2.3.3 Flow cytometry
Phytoplankton counts were performed with a FACSCalibur flow-cytometer (Becton
20
Dickinson) equipped with an air-cooled laser providing 15 mW at 488 nm and with a standard filter set-up. The cells were analysed from fresh prefiltered (30µm mesh)
samples at high flow rate (∼60 µ l min−1). Autotrophic groups were discriminated on 4107
BGD
4, 4101–4133, 2007CO2 effects on particle size and
phytoplankton abundance A. Engel et al. Title Page Abstract Introduction Conclusions References Tables Figures ◭ ◮ ◭ ◮ Back Close
Full Screen / Esc
Printer-friendly Version Interactive Discussion
the basis of their right angle light scatter (RALS) and chlorophyll fluorescence. List-mode files were analysed using WinMDI.
2.4 Statistical treatment of data
Average values are given by the statistical mean ( ¯x) and its standard deviation (SD).
Mean values were compared by means of at-test. Significance of the correlation
co-5
efficient (r2) against Ho:ρ=0 was tested by a Student-test according to Sachs (1974): ˆt = r √ n − 2 p 1 − r2 , (1)
withn = numbers of observations and the degree of freedom, d f =n−2. Ho(r
2 =0) is rejected for ˆt≥ˆtn−2;p. The influence of the CO2-treatment on biological or chemical variables was determined by means of the analysis of variance (ANOVA) or
covari-10
ance (ANCOVA). The effect of the CO2-treatment on a linear relationship between two biological or chemical variables was tested by comparing the slope (b) of the linear
regression (F (x)=b(x)+a), as calculated for each treatment separately, with a t-test (Sachs, 1974) withd F =n1+n2−4. Significance level of each test was p<0.05.
3 Results
15
3.1 Bloom development
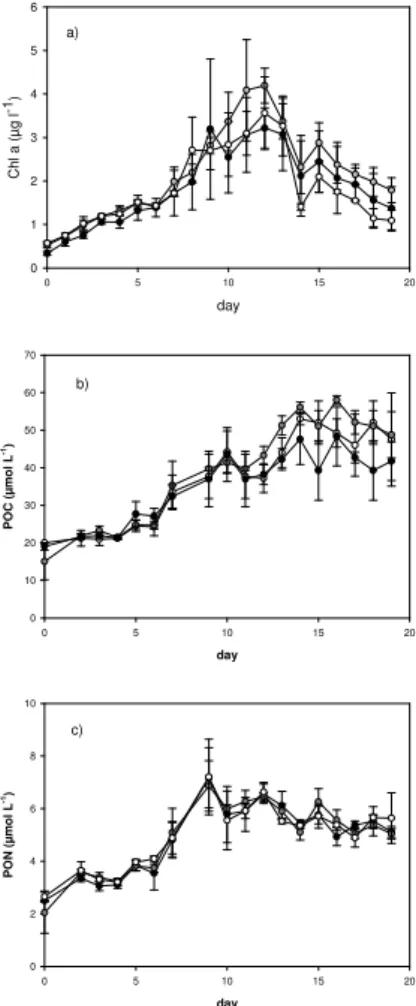
Following the development of the phytoplankton bloom, Chl-a increased exponentially
in each of the mesocosms until a maximum value was reached between day 9 and day 13 of the experiment (Fig. 1a). The peak of the Chl-a concentration coincided
with the depletion of nutrients, which was observed for nitrate between day 11 and 12
20
for all mesocosms (Carbonell and Chou, personal communication). Thereafter,
Chl-a concentrChl-ation declined until the end of the experiment. The bloom cChl-an be divided
BGD
4, 4101–4133, 2007CO2 effects on particle size and
phytoplankton abundance A. Engel et al. Title Page Abstract Introduction Conclusions References Tables Figures ◭ ◮ ◭ ◮ Back Close
Full Screen / Esc
Printer-friendly Version Interactive Discussion
into a pre-bloom phase that covers the first week of the experiment, a bloom phase during the second week, and a post-bloom phase towards the end of the experiment. Small, inevitable variations during the initialisation introduced variability between all mesocosms. This leads to one to three days deviations regarding the timing of the maximum Chl-a concentration and the onset of decline phase within the CO2
treat-5
ments. For later reference we defined more narrow windows for the three phases of the experiment that can clearly be differentiated in all mesocosms; the pre-bloom: days 1–3, the bloom peak: of Chl-a max ±1 day, and the post bloom: day 18–21.
With respect to the CO2-treatment no significant difference in Chl a concentration or the timing of the maximum concentration were observed. Nutrient draw-down was
10
not significantly different between the CO2 treatments at any time of the experiments (Carbonel and Chou, personal communication) either.
Particulate organic nitrogen (PON) concentration was initially 2.4±0.5 µmol L−1 and increased to maximum values of 7.1±1 µmol L−1on day 9 of the bloom (Fig. 1b). PON concentration was remarkably similar in all mesocosms and no significant effects of the
15
CO2treatment on PON concentration was determined (ANOVA).
Particulate organic carbon (POC) concentration started with 15±3.0 µmol L−1 and increased throughout the study in all mesocosms to final values of 23–34µmol L−1
(Fig. 1c). Like for PON, POC concentration was not related to CO2concentration either (ANOVA). Maximum molar [POC]:[PON] ratios were observed during the post-bloom
20
phase with 8.6±0.8, 10±1.0 and 9.7±1.3 for the past, present and future CO2scenario, respectively (average ±1 standard deviation calculated from three mesocosms). No significant CO2effect on the C:N ratios of POM was determined (ANOVA).
3.2 Particles abundance and size distribution
More than 95% of all particles between 2 and 60µm equivalent spherical diameter
25
(ESD) were detected with the Coulter Counter in the size range between 2 and 10µm
ESD. Larger particles were counted randomly, with number counts that fall into the range of uncertainty (variability) of one treatment, represented by three mesocosms
BGD
4, 4101–4133, 2007CO2 effects on particle size and
phytoplankton abundance A. Engel et al. Title Page Abstract Introduction Conclusions References Tables Figures ◭ ◮ ◭ ◮ Back Close
Full Screen / Esc
Printer-friendly Version Interactive Discussion
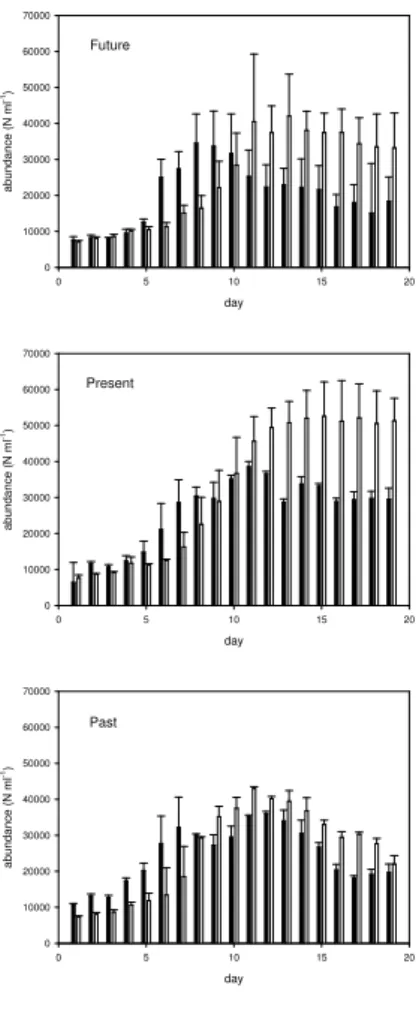
(replicates). Total abundance of Coulter Counter particles (CCP) measured shortly after initialisation in all mesocosms, was indifferent between treatments, yielding an average of 7750±560 N mL−1. The CCP abundance increased exponentially during the bloom until maximum concentrations were reached between day 11 and day 15 (day 9 for M9) (Fig. 2). Maximum CCP abundances, as averaged separately for
5
the three CO2treatments, were 4300±500 N mL−1 for the past, and 5260±9500, and 4250±1160 N mL−1for the present and future CO2treatment, respectively. The net spe-cific growth rate (µt) for CCP during the phase of exponential growth was calculated
for each mesocosm: µt=[ln(Ci)−ln(Ci −1)]/[ti−ti−1], with ln(Ci) and ln(Ci −1) being the
natural logarithms of CCP concentrations at two consecutive days. Maximum values
10
forµt ranged between 0.30 d−1 (M1) and 0.68 d−1 (M7). No significant effects of the
CO2treatment on the parameter (µt) or on the maximum values forµ were identified.
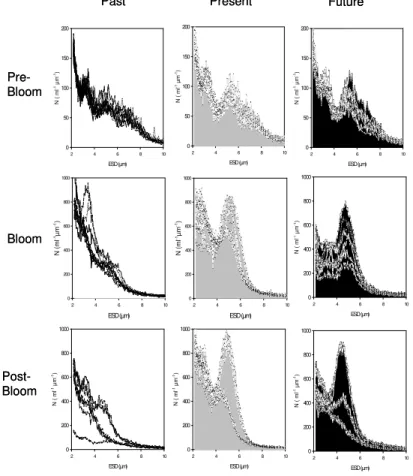
The size frequency distributions, or size spectra, of CCP, changed over time in all mesocosms (Fig. 3). Size spectra were not significantly different for the three treat-ments during the pre-bloom phase (ANOVA), but developed differently during growth of
15
the phytoplankton community. Given the present day CO2treatment as a reference, we find two distinct maxima in the size spectra, one around 2µm ESD and another close
to 5µm ESD. Compared to the present day CO2 treatment, there was a lack of the
larger population in the past CO2 treatment, whereas a drastic reduction of particles abundance was observed at small size (<4 µm) in the future CO2 treatment (Fig. 3).
20
These distinct differences persisted during the post-bloom phase, but with an increase in variability within the individual treatments.
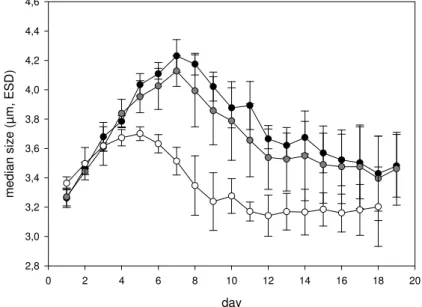
Differences in size distribution were reflected in significant differences of the median particle size of CCP between the CO2 treatments over the course of the experiment (ANOVA,p<0.001, t-testfuture−present p<0.005, t-testpresent−past p<0.001; Fig. 4). The
25
highest value for median particle size of CCP was observed on day 7 in the future CO2 treatment with 4.23±0.11 µm ESD. The maximum value for median size in the present day CO2treatment was observed at day 7 also, but with slightly smaller value of 4.12±0.10 µm ESD. Clearly smaller particles were observed in the mesocosms of
BGD
4, 4101–4133, 2007CO2 effects on particle size and
phytoplankton abundance A. Engel et al. Title Page Abstract Introduction Conclusions References Tables Figures ◭ ◮ ◭ ◮ Back Close
Full Screen / Esc
Printer-friendly Version Interactive Discussion
the past CO2treatment, yielding a maximum median size of 3.70±0.05 µm ESD at day 5. The temporal development of the median size of particles followed similar dynamics irrespectively of the CO2concentration; i.e. the median size increased at the beginning of the experiment, had a maximum value during mid or late pre-bloom, a declining phase during the peak of the bloom, and varied only little during the post-bloom phase.
5
However, median sizes in past CO2treatment deviated from the present day or future CO2already on day 4. Moreover, the maximum value of median sizes was observed on day 5 in past CO2treatment and thus two days earlier than in the other two treatments. This indicated that the absolute value of median size as well as the timing of the saddle point was affected by the CO2-treatment.
10
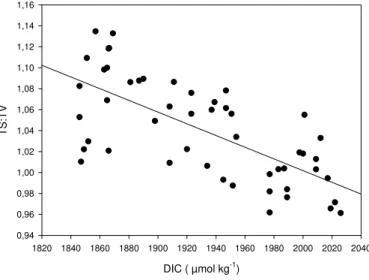
Effects of the CO2 treatment on particles size were also reflected in the ratio of the total surface to total volume (TS:TV), calculated as
TS : TV =Xiii nπ(ESDi)2× ni o /Xi i i n 1/6π(ESDi)3× ni o (2) with ESDi being the smallest (2µm) and ESDiithe largest (60µm) size class observed.
During the 7-day period of the bloom of the phytoplankton community, TS:TV ratios
15
were significantly related to DIC concentration of seawater (p<0.001) and decreased
with increasing DIC (Fig. 5).
3.3 Phytoplankton community composition
Total abundance of autotrophic cells as determined by Flow Cytometry in the size range 1.5–30µm was 6300±1700 N mL−1 initially and increased throughout the
ex-20
periment in all mesocosms (Fig. 3a–c). Maximum average phytoplankton abundance was 36 000±1500 N ml−1, 38 500±9450 N ml−1 and 34 500±3930 N ml−1 for the past, present day and for the future CO2 treatments, respectively. During the course of the experiment, total abundance of phytoplankton cells differed significantly between the treatments (ANOVA, p<0.005), with the future CO2 treatment having the lowest
25
autotrophic cell abundance (t-test, p<0.001). Comparing the total abundance of
phy-toplankton (covering the size range 1.5–30µm) with total CCP abundance in the size
BGD
4, 4101–4133, 2007CO2 effects on particle size and
phytoplankton abundance A. Engel et al. Title Page Abstract Introduction Conclusions References Tables Figures ◭ ◮ ◭ ◮ Back Close
Full Screen / Esc
Printer-friendly Version Interactive Discussion
range 2–60µm revealed a similar temporal development (Fig. 3a–c). However, the
Flow Cytometry data showed systematically higher total phytoplankton abundance dur-ing the pre-bloom and bloom phase up to day 10 of the experiment. This can be at-tributed to the lower size detection limit of the Flow Cytometer. After day 10, the num-ber of CCP increased over the numnum-ber of phytoplankton, indicating the transition from
5
a small-celled autotrophic community to a mixed community including heterotrophic or-ganisms and detritus particles. In general, the relative contribution of autotrophic cells to total particles was highest in the past CO2 treatment and similar in the present day and the future CO2treatment.
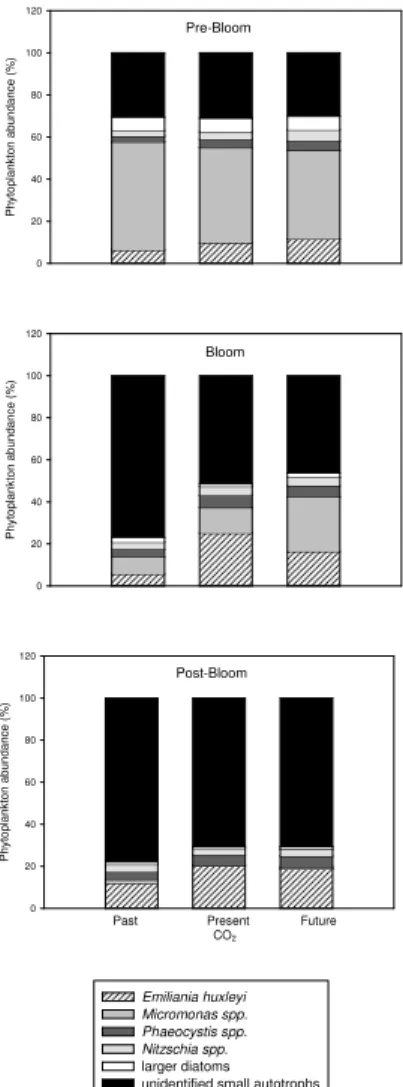
The species composition of phytoplankton, as determined by Flow Cytometry,
indi-10
cate that the phytoplankton community was initially similar in all enclosures and was dominated, in terms of numbers, by the phytoflagellate Micromonas spp. (Fig. 6). Other major phytoplankton species included diatoms, specifically Nitzschia spp., the coccol-ithophore Emiliania huxleyi, and the nanoflagellate Phaeocystis spp. During the bloom, the relative abundance of phytoplankton species developed significantly differently in
15
the CO2treatments (ANOVA,p<0.05). In the past CO2treatment, populations of small unidentified autotrophic cells grew rapidly and dominated the community structure dur-ing the bloom to a large extend. The E. huxleyi population was most prominent in the present, and, although to a smaller degree, in the future CO2treatment. The E.
hux-leyi population was determined by the Coulter Counter in the size range 4–8µm and
20
identified in the future and present day mesocosms by clear peaks. Because no sig-nificant differences between the future and present day CO2treatment were observed for the median particle size in this 4–8µm size window, we can assume that the size of
the E. huxleyi population itself did not vary significantly with CO2. Diatoms contributed between 4 to 12% to total phytoplankton abundance with the higher values observed
25
during the pre-bloom phase. Within the group of diatoms, a smaller size population of
Nitzschia was differentiated from a group of larger diatoms. For both diatom groups,
no significant differences terms of absolute and relative abundance between the CO2 treatment were observed (ANOVA, p>0.05). During the post-bloom phase the
BGD
4, 4101–4133, 2007CO2 effects on particle size and
phytoplankton abundance A. Engel et al. Title Page Abstract Introduction Conclusions References Tables Figures ◭ ◮ ◭ ◮ Back Close
Full Screen / Esc
Printer-friendly Version Interactive Discussion
age phytoplankton composition of the future and present CO2treatment converged to those observed for the past treatment during the bloom and no significant CO2related differences were determined.
4 Discussion
The aim of this study was to test the hypothesis that CO2concentration can affect
parti-5
cle, respectively cell size distribution, during the course of a phytoplankton bloom. Our results revealed that the size distribution of suspended particles in the range 2–60µm
ESD differed significantly between the three CO2 treatments during the bloom phase itself, when biological processes were dominated by autotrophic growth. There were several indications for particles tending to be smaller at lower CO2 concentration and
10
larger at higher CO2concentration relative to the present day concentration, i.e. in the median sizes of suspended particle, in the ratios of total surface: total volume, and in the spectral distribution of particle size. Changes in CO2 also led to significant struc-tural effects on the autotrophic community, as indicated by the different abundance of phytoplankton groups using Flow Cytometry. Thereby, the major phytoplankton
popu-15
lations were affected differently. While some populations such as diatoms seemed to be insensitive to the CO2treatment, others increased in abundance with CO2, or were most abundant at present day CO2.
4.1 CO2effects on size distribution of suspended particles
Causes for changes in the size distribution of autotrophic cells can be manifold. In
gen-20
eral, metabolic processes, such as growth, nutrient and light acquisition, or respiration, are related to organism size (Peters, 1983). Grazers often select their prey accord-ing to size, and the settlaccord-ing rate of most types of marine particles increases with size. For marine phytoplankton, metabolic scaling has previously been shown for some pro-cesses such as nutrient uptake, photosynthesis and growth (Finkel et al., 2004). For
25
BGD
4, 4101–4133, 2007CO2 effects on particle size and
phytoplankton abundance A. Engel et al. Title Page Abstract Introduction Conclusions References Tables Figures ◭ ◮ ◭ ◮ Back Close
Full Screen / Esc
Printer-friendly Version Interactive Discussion
others, such as respiration, the existence of size dependence has been questioned (Falkowski and Owens, 1978). Moreover, the relative surface area can be of greater importance than cell diameter, mass or volume with respect to processes such as nu-trient uptake, because it is the surface that interferes with the outer medium containing the substrate reservoir. The relative surface area of a phytoplankton cell increases with
5
decreasing size, but also with increasing eccentricity of the cells. Small or elongated phytoplankton species should be better competitors for resources, in particular when these limit biomass production (Grover, 1989). Therefore, small-sized phytoplankton cells are likely to dominate under oligotrophic conditions, whereas elevated nutrient concentration induce growth of larger cells (Irwin et al., 2006).
10
During this study, significant effects of the CO2 treatment on particle size distribu-tion were most obvious during the time of the bloom when autotrophic cells dominated particle abundance. This indicates a bottom-up effect of CO2 on size on the phyto-plankton community level. Particle size during this study, however, was derived from volume and expressed as equivalent spherical size without any additional information
15
on the shape of the cells. Information gained from the Flow-Cytometer and from mi-croscopy nevertheless revealed that most species in the size range 1.5–30µm were
indeed rather spherical, with the exception of Nitzschia spp. Although the distal length of Nitzschia spp. is relatively large, their proximal size is small and thus the volume is small. However, abundance of Nitzschia spp. was not significantly different between the
20
CO2 treatments. Hence, eccentricity of cells did not bias the observation of a general decrease in cell size with increasing CO2during this study.
During the bloom phase, the observed differences in particle size spectra and me-dian particle size were related to differences in phytoplankton community composition.
Micromonas spp. and E. huxleyi, for example were more abundant in the present day
25
and future than in the past CO2treatment. In the latter, smaller autotrophic nanoplank-ton clearly dominated the bloom by number. Size variations within individual species were presumably not related to the CO2-treatment. However, at least for E. huxleyi po-tential changes in the protoplast size may have been masked by simultaneous changes
BGD
4, 4101–4133, 2007CO2 effects on particle size and
phytoplankton abundance A. Engel et al. Title Page Abstract Introduction Conclusions References Tables Figures ◭ ◮ ◭ ◮ Back Close
Full Screen / Esc
Printer-friendly Version Interactive Discussion
in coccosphere size due to potential effect of CO2 on calcification (Riebesell et al., 2000). During a similar mesocosm study (PeECE I), when the phytoplankton commu-nity was clearly dominated by E. huxleyi, Engel et al. (2005) observed that the sizes and weights of coccospheres were largest at low CO2. During PeECE I, no significant differences in the phytoplankton community were observed with respect to the CO2
5
treatment. One reason for the different outcome of PeECE I and II with respect to CO2 influence on phytoplankton community composition may be that nutrients in the 2005-experiment were added in a NO3:PO4 ratio of 30 and without any additional supply of silicate in order to favour the blooming of E. huxleyi. In the present study N:P:Si were added in “Redfield-ratio” in order to allow for a mixed assemblage of diatoms,
10
coccolithophores and other autotrophic species.
4.2 CO2effects on phytoplankton community composition
Recent investigations on CO2 acquisition in marine phytoplankton species demon-strated that many phytoplankton groups including diatom species such as Skeletonema
costatum efficiently apply one or several carbon concentrating mechanisms (CCM)
15
(Rost et al., 2003). CCMs can be understood as a physiological regulation of CO2 acquisition to maintain high photosynthetic rates even at reduced CO2 concentration. Goldman (1999) observed no reduction in cell growth of large diatom species until CO2 concentrations fell as low as 4µmol L−1, indicating that growth of these species was not depending on the diffusional uptake of CO2, but supported by CCMs. During this
20
study the abundance of diatoms was not significantly different between the CO2 treat-ments, supporting the idea that diatoms can indeed regulate their C-uptake and are insensitive to changes in CO2concentrations over a relatively wide range. Abundance of E. huxleyi, in contrast, was significantly reduced in the past CO2 treatment. This is in accordance with our expectations, since E. huxleyi has been shown to have a
25
low affinity to CO2(Rost et al., 2003). Abundance of Micromonas spp. increased with increasing CO2, indicating that this species does not apply CCM efficiently, either. How-ever, the strongest response to CO2concentration was observed in the group of small
BGD
4, 4101–4133, 2007CO2 effects on particle size and
phytoplankton abundance A. Engel et al. Title Page Abstract Introduction Conclusions References Tables Figures ◭ ◮ ◭ ◮ Back Close
Full Screen / Esc
Printer-friendly Version Interactive Discussion
autotrophs that grew abundantly in the past CO2treatment, but little in the future CO2 treatment. Changes in the abundance of these small cells were mainly responsible for the changes in size spectra compared to the present day treatment.
Interestingly, it was this group of small-celled algae that numerically dominated phy-toplankton community at low CO2, and not diatoms, which we expected to be good
5
competitors based on their high CO2affinity and physiological capability. Because we did not determine CCM operations in phytoplankton during this study, we can only speculate about possible explanations for the observed CO2-effects on phytoplankton abundance and size distribution. First, CCMs in diatoms, or other species, may have been co-limited by phosphate or light availability (Young and Beardall, 2005; Beardall
10
et al., 2005) and were not efficient enough to give a competitive advantage. Phosphate concentrations during this study decreased strongly within the first week, while at the same time NOX:PO3−4 ratios increased up to 28 (Carbonel and Chou, personal com-munication), indicating high phosphorus demand of phyto- and bacterioplankton cells. To prevent depletion, PO3−4 was added again to all mesocosms on day 8. By this time
15
differences in the particle size spectra had already evolved (Fig. 4). Thus, we cannot exclude that P limitation may have affected CCM of algal species and was co-limiting active C-uptake in the past CO2mesocosms. If P were the potentially limiting nutritious element, we would expect that species allocating PO3−4 efficiently for reproduction have an advantage over those species, which additionally need to allocate PO3−4 for CCM
20
operation. Under these circumstances, reduction of cell size would be beneficial to cir-cumvent both P- and CO2limitation and may help to explain the observed relationship between size and DIC availability during this study. We may then speculate that future effects of elevated CO2concentration increase on the size spectrum of phytoplankton communities may especially occur in oceanic regions, where P is limiting phytoplankton
25
production.
Another hypothesis would be that CCM only acted as a surplus to carbon acquisition and equally well in all phytoplankton species observed in the past CO2treatment. Cas-sar et al. (2004) estimated that 50% of carbon uptake in a natural diatom population
BGD
4, 4101–4133, 2007CO2 effects on particle size and
phytoplankton abundance A. Engel et al. Title Page Abstract Introduction Conclusions References Tables Figures ◭ ◮ ◭ ◮ Back Close
Full Screen / Esc
Printer-friendly Version Interactive Discussion
was comprised by HCO−3 uptake, the remaining 50% by CO2. Reduction of cell size may therefore be pivotal to enhance the fraction of CO2 taken up by diffusion, and to accelerate growth rates of small cells. Certainly, more investigations are needed to elucidate the interplay between size and physiological regulation of carbon uptake dur-ing natural phytoplankton blooms, and the impact on carbon acquisition and species
5
selection in the future ocean.
During the post-bloom phase, species composition was quite similar in all CO2 treat-ments indicating that factors other than CO2, possibly grazing, were influencing species distribution at this time.
4.3 Potential consequences for carbon cycling
10
Particle size distribution and phytoplankton species composition were rather similar in the present day and the future CO2treatment, and clearly different from the past CO2 treatment. This is in accordance with the non-linear relationship between CO2 concen-tration and primary production, indicating that the selective pressure towards a larger relative surface area, i.e. cell size reduction, for species relying on CO2uptake,
whatso-15
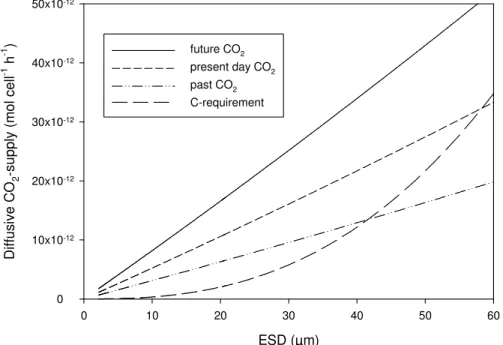
ever, increase with decreasing CO2. As mentioned above, we do not have information about potential enhancement of carbon uptake due to CCM operations in phytoplank-ton during this study. In order to estimate potential differences in carbon acquisition within the three CO2 treatments due to the observed differences in cell size, we can only estimate the treatment effect on the diffusive supply of CO2. To estimate the
spec-20
tral distribution of CO2supply during the bloom phase in the mesocosms, we calculated theoretical rates of CO2 supply to the cell according to the simplified model of Riebe-sell et al. (1993) (Fig. 7); see also Gavis and Ferguson (1975) and Wolf-Gladrow and Riebesell (1997) for further information. In alteration to Riebesell et al. (1993) CO2 -supply rates were calculated for each size class from 2µm ESD to 60 µm ESD using
25
the average observed CO2 concentrations during the “bloom-period”, i.e. 22.34, 14.28 and 8.49µmol kg−1 for the future, present day and past CO
2 treatment, respectively. 4117
BGD
4, 4101–4133, 2007CO2 effects on particle size and
phytoplankton abundance A. Engel et al. Title Page Abstract Introduction Conclusions References Tables Figures ◭ ◮ ◭ ◮ Back Close
Full Screen / Esc
Printer-friendly Version Interactive Discussion
A conversion factor (ak) of 400 was assumed, accounting for the HCO−3-CO2 equilib-rium at the observed pH- and temperature range. The half-saturation constant (Km) was fixed to 10µmol kg−1, assuming that this is a representative value for a mixed phytoplankton community of diatoms, coccolithophores and Phaeocystis spp. How-ever, varying Km from 0.5 to 20 had only little effect on the estimates for CO2 fluxes
5
(<0.1%) in our model. To calculate the maximum CO2− supply rate (Vmax=µmax×Qc),
the maximum growth rate of cells (µmax, d−1) was calculated with a parameterization that scales with cell volume (V , µm3): µmax=a(V )
b
; witha=5.37, b=−0.25 after Irwin
et al. (2006); the carbon cell quota (Qc; pg C) was calculated using Qc=d (V )e , with
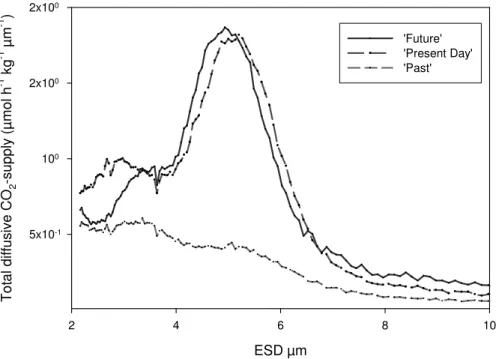
d =0.436, e=0.863 after Verity et al. (1993). The results of these calculations show that
10
the spectral distributions of total diffusive CO2-supply during the time of the bloom were different in the three CO2 treatments (Fig. 8). With the exception of the very the low size range (<4 µm) the estimated total CO2-supply at all size classes was higher in the present day and future CO2 treatment than in the past. Only at particle sizes<4 µm, the higher abundance of particles in the past CO2 treatment could partially
compen-15
sate for the lower supply rates per cell. Integration over the size range 2–60µm ESD
yielded similar values for potential CO2-supply for the future and present day CO2 treat-ment with 100µmol h−1kg−1, and a much lower value for the past CO
2treatment with
46µmol h−1kg−1. It has to be emphasized that these rates address only the aspect
of diffusive flux of CO2 to the cells. Averaged rates of primary production during this
20
experiment yielded much lower values (Egge et al., 20071). Nevertheless, our calcu-lations indicate that the total supply of cells with CO2was lowest in the past treatment despite the strong increase in the abundance of small cells, whereas the present day and future CO2 treatment may have been equally productive despite the lower abun-dance of particles and autotrophic cells in the latter. A potentially higher CO2-supply
25
1
Egge, J. K., Thingstad, T. F., Engel, A., and Riebesell, U.: Primary production during nutrient-induced blooms at elevated CO2concentrations, Biogeosciences Discuss., submitted, 2007.
BGD
4, 4101–4133, 2007CO2 effects on particle size and
phytoplankton abundance A. Engel et al. Title Page Abstract Introduction Conclusions References Tables Figures ◭ ◮ ◭ ◮ Back Close
Full Screen / Esc
Printer-friendly Version Interactive Discussion
of cells in the future and present day CO2treatment is in accordance with earlier ob-servations obtained during PeECE I, showing that the ∆DIC:∆ cell ratio increased with CO2concentration (Engel et al., 2005).
It is interesting to note that neither the potential differences in CO2 supply nor the structural differences in the size spectra and in the phytoplankton community
composi-5
tion were reflected in the standing stocks of POC and PON. One might argue that PON production was rather related to the supply of inorganic nitrogen than to the availability of carbon, as inorganic nitrogen became exhausted in all mesocosms during the bloom development. Then, however the smaller cells in the past CO2treatment should have contributed to PON in a higher proportion. In fact, Verity et al. (1993) showed that the
10
scaling exponent for the increase of nitrogen and carbon with cell volume is less than 1, and thus the volume of cells increases faster with size than the concentration of elemental components. Moreover, the scaling exponent for nitrogen is lower than for carbon leading to an increase of C:N ratios with cell size. However, estimates for the carbon and nitrogen content of cells vary even for cultures of the same species
(Mon-15
tagnes et al., 1994) and may not be representative for particles encountered during this study.
Assuming that CO2-supply rates were potentially higher in the present day and future CO2-treatments, and assuming that a higher supply with CO2 resulted in higher car-bon uptake rates, the fate of this excessive carcar-bon remains unclear. Dellile et al. (2005)
20
and Engel et al. (2005) suggested that carbon exudation and formation of extracellular organic particles, such as transparent exopolymer particles (TEP), as well as subse-quent differential aggregation and settlement of organic matter may represent a poten-tial pathway for a CO2depended sink for carbon. In fact, Engel et al. (2004) observed higher per cell production of TEP at high CO2during PeECE I. TEP concentrations
de-25
termined during PeECE II also indicate higher production with increasing CO2(data not shown). Coccolithophores as well as diatoms are known to produce copious amounts of TEP (Passow, 2002; Engel et al., 2004). A species shift towards these phytoplank-ton groups may therefore also contribute to higher TEP production at present day and
BGD
4, 4101–4133, 2007CO2 effects on particle size and
phytoplankton abundance A. Engel et al. Title Page Abstract Introduction Conclusions References Tables Figures ◭ ◮ ◭ ◮ Back Close
Full Screen / Esc
Printer-friendly Version Interactive Discussion
future CO2concentrations.
4.4 Potential consequence for ecosystem functioning
Structural changes in the size distribution of particles were observed during this meso-com experiments, together with changes in the meso-composition of the phytoplankton meso- com-munity. Phytoplankton species responded to changes in CO2 in way that cannot be
5
explained with a single general scaling law (Enquist et al., 1998; Belgrano and Brown, 2002). Rather, our observed CO2response suggests a complex interplay between a variety of scaling effects: 1) Pico- and small nanoplankton cells with a large surface-to-volume ratio are efficient in taking up resources, of which only a small fraction is needed for enzymes involved in C-fixation. These cells have a potential advantage
10
under low substrate and low CO2 conditions but are susceptible to grazing by small protozoans and micro-zooplankton; 2) Large phytoplankton cells have a small surface-to-volume ratio and are less competitive in terms of resource uptake, but they can allocate more luxury resources that may allow them to better compensate environmen-tal changes (e.g. better acclimation to varying environmenenvironmen-tal factors). Their larger size
15
can moreover be advantageous to escape micro-zooplankton grazing; 3) Intermediate-sized nano-phytoplankton have to find a balance between resources needed purely for growth, those that enhance physiological acclimation, and those resources that sup-port predation defence. Thus, intermediate-sized nano-phytoplankton have no obvious advantage when it comes to escape grazing pressure, but also with respect to resource
20
uptake. Instead, they rely on a fine balance (trade-off). However, exceptions may be given for species growing in chains, colonies or filaments, such as Phaeocystis and diazotrophic cyanobacteria.
Due to the structural change of the phytoplankton community, effects of CO2can po-tentially be transferred to higher trophic levels. During this experiment, CO2-sensitivity
25
was found within a size spectrum that is rather narrow compared to the total phyto-plankton size range (i.e. 1–5×103µm). Nevertheless, the sensitive size range
over-lapped with those inherent to the microbial food web of pico- and nano-plankton. The 4120
BGD
4, 4101–4133, 2007CO2 effects on particle size and
phytoplankton abundance A. Engel et al. Title Page Abstract Introduction Conclusions References Tables Figures ◭ ◮ ◭ ◮ Back Close
Full Screen / Esc
Printer-friendly Version Interactive Discussion
microbial food web comprises a tight linkage between trophic interactions and DOM utilisation (Azam et al., 1983). Therefore, CO2related changes in the size distribution of phytoplankton involved in the microbial food web can be anticipated to also affect DOM quality and grazing response of micro-zooplankton.
Acknowledgements. The staff at the Marine Biological Station, University of Bergen, in
particu-5
lar T. Sørlie and A. Aadnesen, and the Bergen Marine Research infrastructure (RI) are gratefully acknowledged for support in mesocosm logistics. We also thank A. Terbr ¨uggen for technical assistance. V. Carbonel and L. Chou are gratefully acknowledged for providing information on nutrients. This study was supported by EU-TMR contract no. HPRI-CT-2002-00181 and by the Helmholtz Association contract no. HZ-NG-102.
10
References
Azam, F., Fenchel, T., Field, J. G., Gray, J. S., Meyer-Reil, L. A., and Thingstad, F.: The ecolog-ical role of water-column microbes in the sea, Mar. Ecol.-Prog. Ser., 10, 257–263, 1983. Barcelos e Ramos, J., Biswas, H., Schulz, K. G., LaRoche, J., and Riebesell, U.: Effect of
rising atmospheric carbon dioxide on the marine nitrogen fixer Trichodesmium, Global.
Bio-15
geochem. Cy., 21, GBC2028, doi:10.1029/2006GB002898, 2007.
Belgrano, A. and Brown, J. H.: Oceans under the macroscope, Nature, 419, 128–129, 2002. Boyd, P. W. and Doney, S. C.: Modelling regional responses by marine pelagic ecosystems to
global change, Geophys. Res. Lett., 29, doi:10.1029/2001GL014130, 2002.
Caldeira, K. and Wickett, M. E.: Anthropogenic carbon and ocean pH, Nature, 425, 365, 2003.
20
Cassar, N., Laws, E. A., and Bidigare, R. R.: Bicarbonate uptake by Southern Ocean phyto-plankton, Global. Biogeochem. Cy., 18, GB2003, doi:101029/2003GB002166, 2004.
Chen, C. Y. and Durbin, E. G.: Effects of pH on the growth and carbon uptake of marine phytoplankton, Mar. Ecol.-Prog. Ser., 109, 83–94, 1994.
Badger, M. R., Andrews, T. J., Whitney, S. M., Ludwig, M., Yellowlees, C. D., Leggat, W., and
25
Price, G. D.: The diversity and coevolution of Rubisco, plastids, pyrenoids, and chloroplast-based CO2-concentrating mechanisms in algae, Can. J. Botany, 76, 1052–1071, 1998. Beardall, J., Roberts, S., and Raven, J. A.: Regulation of inorganic carbon acquisition by
phos-phorus limitation in the green alga Chlorella emersonii, Can. J. Botany, 83, 859–864, 2005.
BGD
4, 4101–4133, 2007CO2 effects on particle size and
phytoplankton abundance A. Engel et al. Title Page Abstract Introduction Conclusions References Tables Figures ◭ ◮ ◭ ◮ Back Close
Full Screen / Esc
Printer-friendly Version Interactive Discussion
Delille, B., Harlay, J., Zondervan, I., Jacquet, S., Chou, L., Wollast, R., Bellerby, R. G. J., Frankignoulle, M., Borges, A. V., Riebesell, U., and Gattuso, J.-P.: Re-sponse of primary production and calcification to changes of pCO2 during experimental blooms of the coccolithophorid Emiliania huxleyi, Global. Biogeochem. Cy., 19, GB2023, doi:10.1029/2004GB002318, 2005.
5
Engel, A., Delille, B., Jacquet, S., Riebesell, U., Rochelle-Newall, E., Terbr ¨uggen, A., and Zondervan, I.: TEP and DOC production by Emiliania huxleyi exposed to different CO2
con-centrations: A mesocosm experiment, Aquat. Microb. Ecol., 34, 93–104, 2004.
Engel, A., Zondervan, I., Aerts, K., Beaufort, L., Benthien, A., Chou, L., Delille, B., Gattuso, J.-P., Harlay, J., Heemann, C., Hoffmann, L., Jacquet, S., Nejstgaard, J., Pizay, M. D.,
Rochelle-10
Newall, E., Schneider, U., Terbrueggen, A., and Riebesell, U.: Testing the direct effect of CO2concentration on a bloom of the coccolithophorid Emiliania huxleyi in mesocosm exper-iments, Limnol. Oceanogr., 50, 493–507, 2005.
Enquist, B. J., Brown, J. H., and West, G. B.: Allometric scaling of plant energetics and popu-lation density, Nature, 395, 163–165, 1998.
15
Falkowski, P. and Owens, T. G.: Light-shade adaptation, Plant Physiol., 66, 592–595, 1978. Finkel, Z. V., Irwin, A. J., and Schofield, O.: Resource limitation alters the 3/4 size scaling of
metabolic rates in phytoplankton, Mar. Ecol.-Prog. Ser., 273, 269–279, 2004.
Frankignoulle, M., Borges, A. V., and Biondo, R.: A new design of equilibrator to monitor carbon dioxide in highly dynamic and turbid environments, Water Res., 35, 1344–1347, 2001.
20
Gao, K., Aruga, Y., Asada, K., and Kiyohara, M.: Influence of enhanced CO2 on growth and photosynthesis of the red algae Gracilaria sp. and G. chilensis, J. Appl. Phycol. 5, 563–571, 1993.
Gavis, J. and Ferguson, J. F.: Kinetics of carbon dioxide uptake by phytoplankton at high pH., Limnol. Oceanogr., 20, 211–221, 1975.
25
Goldman J. C.: Inorganic carbon availability and the growth of large marine diatoms, Mar. Ecol.-Prog. Ser., 180, 81–91, 1999.
Gran, G.: Determination of the equivalence point in potentiometric titrations of seawater with hydrochloric acid, Oceanol. Acta, 5, 209–218, 1952.
Grover, J. P.: Influence of cell shape and size on algal competitive ability, J. Phycol., 25, 402–
30
405, 1998.
Irwin, A. J., Finkel, Z. V., Schofield, O. M. E., and Falkowski, P. G.: Scaling-up from nutrient physiology to the size-structure of phytoplankton communities, J. Plankton. Res., 28, 459–
BGD
4, 4101–4133, 2007CO2 effects on particle size and
phytoplankton abundance A. Engel et al. Title Page Abstract Introduction Conclusions References Tables Figures ◭ ◮ ◭ ◮ Back Close
Full Screen / Esc
Printer-friendly Version Interactive Discussion
471, 2006.
Giordano, M., Beardall, J., and Raven, J. A.: CO2concentrating mechanisms in algae: mecha-nisms, environmental modulation, and evolution, Annual Plant Biology, 56, 99–131, 2005. Goerike, R. and Fry, B.: Variations of marine plankton δ13C with latitude, temperature, and
dissolved CO2in the world ocean, Global Biogeochem. Cy., 8, 85–90, 1994.
5
Grossart, H.-P., Allgaier, M., Passow, U., and Riebesell, U.: Testing the effect of CO2
concentra-tion on the dynamics of marine heterotrophic bacterioplankton, Limnol. Oceanogr., 51, 1–11, 2006a.
Hinga, K. R.: Effects of pH on coastal marine phytoplankton, Mar. Ecol.-Prog. Ser., 238, 281– 300, 2002.
10
Houghton, J. T., Ding, Y., Griggs, D. J., Noguer, M., Van der Linden, P. J., Dai, X., Maskell, K., and Johnson, C. A.: Climate Change 2001: The Scientific Basis: Contribution of Working Group I to the Third Assessment Report of the Intergovernmental Panel of Climate Change, Cambridge University Press, 2001.
Hutchins, D. A., Fu, F.-X., Zhang, Y., Wagner, M. E., Feng, Y., Portune, K., Bernhardt, P. W.,
15
and Mulholland, M. R.: CO2 control of Trichodesmium N2 fixation, photosynthesis, growth rates, and elemental ratios: Implications for pat, present and future ocean biogeochemistry, Limnol. Oceanogr., 52, 1293–1304, 2007.
Irwin, A. J., Finkel, Z. V., Schofield, O. M. E., and Falkowski, P. G.: Scaling-up from nutrient physiology to the size-structure of phytoplankton communities, J. Plankton. Res., 28, 459–
20
471, 2006.
Johnson, K. M., Williams, P. J., Brandstrom, L., and Sieburth, J. McN.: Coulometric total carbon analysis for marine studies: automation and calibration, Mar. Chem., 21, 117–133, 1987. Lewis, E. and Wallace, D. W. R.: Program Developed for CO2 System Calculations,
ORNL/CDIAC-105, Carbon Dioxide Information Analysis Center, Oak Ridge National
Lab-25
oratory, U.S. Department of Energy, Oak Ridge, Tennessee, 1998.
Li, W. K. W.: Macroecological patterns of phytoplankton in the northwestern North Atlantic Ocean, Nature, 419, 154–157, 2002.
Montagnes, D. J. S., Berges, J. A., Harrison, P. J., and Taylor, F. J. R.: Estimating carbon, nitrogen, protein, and chlorophyll-a from volume in marine phytoplankton, Limnol. Oceanogr.,
30
39, 1044–1060, 1994.
Passow, U.: Transparent exopolymer particles (TEP) in aquatic environments, Prog. Oceanogr., 55, 287–333, 2002.
BGD
4, 4101–4133, 2007CO2 effects on particle size and
phytoplankton abundance A. Engel et al. Title Page Abstract Introduction Conclusions References Tables Figures ◭ ◮ ◭ ◮ Back Close
Full Screen / Esc
Printer-friendly Version Interactive Discussion
Peters, R. H.: The ecological implications of body size, Cambridge University Press, Cam-bridge, 1983.
Raven, J. A. and Johnston, A. M.: Inorganic carbon acquisition mechanisms in marine phyto-plankton and their implications for the use of other resources, Limnol. Oceanogr., 36, 1701– 1714, 1991.
5
Riebesell, U., Wolf-Gladrow, D. A., and Smetacek, V.: Carbon dioxide limitation of marine phytoplankton growth rates, Nature, 361, 249–251, 1993.
Riebesell, U., Zondervan, I., Rost, B., Tortell, P. D., Zeebe, R., and Morel, F. M. M: Reduced calcification of marine plankton in response of increased atmospheric CO2, Nature, 407, 364–367, 2000.
10
Rost, B. and Riebesell, U., Burkhardt, S., and S ¨ultemeyer, D.: Carbon acquisition of bloom-forming marine phytoplankton, Limnol. Oceanogr., 48, 55–67, 2003.
Rost, B. and Riebesell, U.: Coccolithophores and the biological pump: responses to environ-mental changes, in: Coccolithophores, From Molecular Processes to Global Impact, edited by: Thierstein, H. R. and Young, J. R., 99–127, 2004.
15
Roy, R., Roy, L. N., Vogel, K. M., Portemoore, C., Pearson, T., Good, C. E., Millero, J., and Campbell, D. M.: The dissociation constants of carbonic acid in seawater at salinities 5 to 45 and temperatures 0 to 458◦C, Mar. Chem., 44, 249–267, 1993.
Qiu, B. and Gao, K.: Effects of CO2 enrichment on the bloom-forming cyanobacterium
Mi-crocystis aeruginosa (Cyanophyceae): physiological responses and relationships with the
20
availability of Dissolved Inorganic Carbon, J. Phycol., 38, 721–729, 2002.
Sciandra, A., Arlay, J. H, Lef `evre, D., Lem ´ee, R., Rimmelin, P., Denis, M., and Gattuso, J.-P.: Response of the coccolithophorid Emiliania huxleyi to elevated pCO2under nitrate limitation, Mar. Ecol.-Prog. Ser., 261, 111–122, 2003.
Sheldon, R. W. and Parsons, T. R.: A practical manual on the use of of the Coulter Counter in
25
marine science, Coulter Electronic Sales Co., 1978.
Tortell, P. D., DiTullio, G. R., Sigman, D. M., and Morel, F. M. M.: CO2 effects on taxonomic composition and nutrient utilization in an Equatorial Pacific phytoplankton assemblage, Mar. Ecol.-Prog. Ser., 236, 37–43, 2002.
Koroleff, F. and Grasshof, K.: Determination of nutrients, in: Methods of seawater analyses,
30
edited by: Grasshof, K., Erhardt, M., and Kremling, K., p. 125–188, Verlag Chemie, Wein-heim, 1983.
Sachs, L.: Angewandte Statistik, Springer Verlag Berlin, Heidelberg, New York, 1974.
BGD
4, 4101–4133, 2007CO2 effects on particle size and
phytoplankton abundance A. Engel et al. Title Page Abstract Introduction Conclusions References Tables Figures ◭ ◮ ◭ ◮ Back Close
Full Screen / Esc
Printer-friendly Version Interactive Discussion
Verity, P. G., Robertson, C. Y., Tronzo, C. R., Andrews, M. G., Nelson, J. R., and Sieracki, M. E.: Relationships between cell volume and the carbon and nitrogen content of marine photosynthetic nanoplankton, Limnol. Oceanogr., 37, 1434–1446, 1993.
Wolf-Gladrow, D. and Riebesell, U.: Diffusion and reactions in the vicinity of plankton: A refined model for inorganic carbon transport, Mar. Chem., 59, 17–34, 1997.
5
Wolf-Gladrow, D., Riebesell, U., Burkhardt, S., and Bijma, J.: Direct effects of CO2
concentra-tion on growth and isotopic composiconcentra-tion of marine plankton, Tellus, 51, 461–476, 1999. Young, E. B. and Beardall, J.: Modulation of photosynthesis and inorganic carbon acquisition
in a marine microalga by nitrogen, iron, and light availability, Can. J. Botany, 83, 917–928, 2005.
10
Zimmerman, R. C., Kohrs, D. G., Steller, D. L., and Alberte, R. S.: Impacts of CO2enrichment on productivity and light requirements of eelgrass, Plant Physiol., 115, 599–607, 1997.
BGD
4, 4101–4133, 2007CO2 effects on particle size and
phytoplankton abundance A. Engel et al. Title Page Abstract Introduction Conclusions References Tables Figures ◭ ◮ ◭ ◮ Back Close
Full Screen / Esc
Printer-friendly Version Interactive Discussion a) day 0 5 10 15 20 C h l a ( µ g l -1) 0 1 2 3 4 5 6 b) day 0 5 10 15 20 P O C ( µ m o l L -1) 0 10 20 30 40 50 60 70 c) day 0 5 10 15 20 P O N ( µ m o l L -1) 0 2 4 6 8 10
Fig. 1. Temporal development of Chl-a, (a), POC, (b), and PON, (c), concentrations as
av-eraged for the three mesocosms in the future, present and past CO2treatment, respectively. Error bars denote ±1 SD. Open circles: past, grey circles: present, and solid circles: future treatment.
BGD
4, 4101–4133, 2007CO2 effects on particle size and
phytoplankton abundance A. Engel et al. Title Page Abstract Introduction Conclusions References Tables Figures ◭ ◮ ◭ ◮ Back Close
Full Screen / Esc
Printer-friendly Version Interactive Discussion Future day 0 5 10 15 20 a b u n d a n c e ( N m l -1) 0 10000 20000 30000 40000 50000 60000 70000 Present day 0 5 10 15 20 a b u n d a n c e ( N m l -1) 0 10000 20000 30000 40000 50000 60000 70000 Past day 0 5 10 15 20 a b u n d a n c e ( N m l -1) 0 10000 20000 30000 40000 50000 60000 70000
Fig. 2. Temporal changes in the average total abundance of autotrophic cells (solid bars) and
total particles (open bars) as determined by Flow Cytometry and Coulter Counter, respectively, averaged for the future, present and past CO2treatment, respectively. Error bars denote ±1 SD.
BGD
4, 4101–4133, 2007CO2 effects on particle size and
phytoplankton abundance A. Engel et al. Title Page Abstract Introduction Conclusions References Tables Figures ◭ ◮ ◭ ◮ Back Close
Full Screen / Esc
Printer-friendly Version Interactive Discussion EGU ESD (µm) 2 4 6 8 10 N ( m l -1 µ m -1) 0 50 100 150 200 ESD (µm) 2 4 6 8 10 N ( m l -1 µ m -1) 0 200 400 600 800 1000 ESD (µm) 2 4 6 8 10 N ( m l -1 µ m -1) 0 200 400 600 800 1000 ESD (µm) 2 4 6 8 10 N ( m l -1 µ m -1) 0 50 100 150 200 ESD (µm) 2 4 6 8 10 N ( m l -1µ m -1) 0 200 400 600 800 1000 ESD (µm) 2 4 6 8 10 N ( m l -1 µ m -1) 0 200 400 600 800 1000 ESD (µm) 2 4 6 8 10 N ( m l -1 µ m -1) 0 50 100 150 200 ESD (µm) 2 4 6 8 10 N ( m l -1µ m -1) 0 200 400 600 800 1000 ESD (µm) 2 4 6 8 10 N ( m l -1 µ m -1) 0 200 400 600 800 1000
Past Present Future
Pre-Bloom Bloom Post-Bloom ESD (µm) 2 4 6 8 10 N ( m l -1 µ m -1) 0 50 100 150 200 ESD (µm) 2 4 6 8 10 N ( m l -1 µ m -1) 0 200 400 600 800 1000 ESD (µm) 2 4 6 8 10 N ( m l -1 µ m -1) 0 200 400 600 800 1000 ESD (µm) 2 4 6 8 10 N ( m l -1 µ m -1) 0 50 100 150 200 ESD (µm) 2 4 6 8 10 N ( m l -1 µ m -1) 0 200 400 600 800 1000 ESD (µm) 2 4 6 8 10 N ( m l -1 µ m -1) 0 200 400 600 800 1000 ESD (µm) 2 4 6 8 10 N ( m l -1 µ m -1) 0 50 100 150 200 ESD (µm) 2 4 6 8 10 N ( m l -1µ m -1) 0 200 400 600 800 1000 ESD (µm) 2 4 6 8 10 N ( m l -1 µ m -1) 0 200 400 600 800 1000 ESD (µm) 2 4 6 8 10 N ( m l -1 µ m -1) 0 50 100 150 200 ESD (µm) 2 4 6 8 10 N ( m l -1µ m -1) 0 200 400 600 800 1000 ESD (µm) 2 4 6 8 10 N ( m l -1 µ m -1) 0 200 400 600 800 1000 ESD (µm) 2 4 6 8 10 N ( m l -1 µ m -1) 0 50 100 150 200 ESD (µm) 2 4 6 8 10 N ( m l -1µ m -1) 0 200 400 600 800 1000 ESD (µm) 2 4 6 8 10 N ( m l -1 µ m -1) 0 200 400 600 800 1000
Past Present Future
Pre-Bloom
Bloom
Post-Bloom
Fig. 3. Spectral distribution of Coulter Counter particles in the size range 2–10µm during
the pre-bloom, bloom and post-bloom phases of the experiments for the three different CO2
treatments. Figures show the spectral distributions of the three mesocosms of each treatment during days 1–3 in the pre-bloom, and days 18–20 in the post-bloom phase. For the bloom phase, the time span includes the day of Chl-a maximum for each mesocosm and ±1 day.
BGD
4, 4101–4133, 2007CO2 effects on particle size and
phytoplankton abundance A. Engel et al. Title Page Abstract Introduction Conclusions References Tables Figures ◭ ◮ ◭ ◮ Back Close
Full Screen / Esc
Printer-friendly Version Interactive Discussion day 0 2 4 6 8 10 12 14 16 18 20 m e d ia n s iz e ( µ m , E S D ) 2,8 3,0 3,2 3,4 3,6 3,8 4,0 4,2 4,4 4,6
Fig. 4. Median size of Coulter Counter particles in the size range 2–60µm ESD, averaged for
three mesocosms per CO2 treatment over the course of the experiment. Open circles: past, grey circles: present, and solid circles: future treatment. Error bars denote ±1 SD.
BGD
4, 4101–4133, 2007CO2 effects on particle size and
phytoplankton abundance A. Engel et al. Title Page Abstract Introduction Conclusions References Tables Figures ◭ ◮ ◭ ◮ Back Close
Full Screen / Esc
Printer-friendly Version Interactive Discussion DIC ( µmol kg-1) 1820 1840 1860 1880 1900 1920 1940 1960 1980 2000 2020 2040 T S :T V 0,94 0,96 0,98 1,00 1,02 1,04 1,06 1,08 1,10 1,12 1,14 1,16
Fig. 5. The total surface (TS) to total volume (TV) ratio of particles determined with the Coulter
Counter in the size range 2–60µm ESD was significantly related to the concentration of DIC in
the seawater (p<0.001). Data: bloom phase of each mesocosm; n=50.