HAL Id: hal-01411582
https://hal-mines-paristech.archives-ouvertes.fr/hal-01411582
Submitted on 7 Dec 2016
HAL is a multi-disciplinary open access archive for the deposit and dissemination of sci-entific research documents, whether they are pub-lished or not. The documents may come from
L’archive ouverte pluridisciplinaire HAL, est destinée au dépôt et à la diffusion de documents scientifiques de niveau recherche, publiés ou non, émanant des établissements d’enseignement et de
The Digital Energy System 4.0 2016
Pieter Vingerhoets, Maher Chebbo, Nikos D. Hatziargyriou, Georges
Kariniotakis, Rory Donnelly, Steven de Boeck, Anna-Carin Schneider,
Anderskim Johansson, Stephane Dotto, Paul Hickey, et al.
To cite this version:
Pieter Vingerhoets, Maher Chebbo, Nikos D. Hatziargyriou, Georges Kariniotakis, Rory Donnelly, et al.. The Digital Energy System 4.0 2016. [Research Report] European technology platform for the electricity networks of the future 2016, pp.72. �hal-01411582�
The Digital
Energy System 4.0
2016
Authors and Contributors:
Main authors:
Pieter Vingerhoets, Working Group coordinator Maher Chebbo, ETP SG Digital Energy Chair Nikos Hatziargyriou, Chairman ETP Smart Grids
Authors of use cases:
Speakers on the digitalization workshop: Rolf Riemenscheider (European Commission), Patrick Van Hove (European Commission), Antonello Monti (Aachen University), Joachim Teixeira (EDP), Alessio Montone (ENEL), Paul Hickey (ESB), Tom Raftery (Redmonk), Svend Wittern (SAP), Jean-Luc Dormoy (Energy Innovator).
ETP experts and reviewers: Venizelos Efthymiou, George Huitema, Fernando Garcia Martinez, Regine Belhomme, Miguel Gaspar, Joseph Houben, Marcelo Torres, Amador Gomez Lopez, Jonathan Leucci, Jochen Kreusel, Gundula Klesse, Ricardo Pastor, Artur Krukowski, Peter Hermans.
Special Thanks To: Patrick van Hove of the European Commission for his input, review and fruitful discussions, Marie Latour and Manuela Wunderlich of the ETP SmartGrids secretariat to organize the workshop.
Authors Company Chapters E-mail Project
Georges Kariniotakis Rory Donnelly Mines-Paritech 3E 3.2 3.1. [email protected] [email protected] Anemos/Safewind SWIFT
Steven de Boeck Energyville,
KU Leuven 4.1. [email protected] iTesla
Anna-Carin Schneider RWE 4.2. [email protected] GRID4EU
Anderskim Johansson Vattenfall 4.3 [email protected] GRID4EU
Stephane Dotto SAP 4.4. [email protected] SAP view
Nikos Hatziargyriou NTUA 4.5,
5.1., 6.2.
[email protected] NOBEL grid,
SmarterEMC2, Smarthouse Smartgrid
Paul Hickey ESB 4.6. [email protected] Servo
Antonello Monti RWTH Aachen 6.3, 6.4., 7.1.
[email protected] FINESCE, IDE4L, COOPERATE Pieter Vingerhoets Energyville
KU Leuven 6.1. [email protected] Linear
Nina Zalaznik,
Sasha Bermann Cybergrid 7.2., 7.3. [email protected] eBadge, Flexiciency
Marcel Volkerts USEF 7.4. [email protected] USEF
Disclaimer: The opinions expressed in this document are the sole responsibility of the Smart Grids European Technology Platform and do not necessarily represent the official position of the European Commission.
1) Foreword 04
2) What does Digital Transformation mean? What are the use cases ? 05
3) Practical use cases and field trials 07
3.1. Digital use cases for power generation 08
3.1.1 Probabilistic forecasting of wind generation, forecasting of extremes and optimal use of forecasts in power system operations and markets.
3.1.2 Smart curtailment, dynamic line rating and Improved forecasting tools to maximize integration of wind
3.2. Digital use cases for transmission & distribution networks 16
3.2.1 The STAR project: Remote operation and Grid Automation systems 3.2.2 Innovative Tools for Electrical System Security within Large Areas 3.2.3 Autonomous grid reconfiguration and forecasting in the MV grid 3.2.4 Meter data management for network operation in the LV grid 3.2.5 Collaborative Asset Management
3.2.6 Advanced tools and ICT servicers for Distribution System Operators 3.2.7 A Platform to interface demand side management with DSO needs
3.3. Digital use cases for retailers and aggregators 38
3.3.1 Empowering SG Market Actors through Information and Communication Technologies 3.3.2 IDE4L Use Cases on technical and commercial aggregators
3.4. Digital use cases for consumers & Prosumers 45
3.4.1 Dynamic pricing and Demand Response Management 3.4.2 Smart houses in a smart grid environment
3.4.3 Smart charging of electric vehicles 3.4.4 Neighborhood energy management 3.4.5 Use cases
3.4.6 Technology development needed to meet the challenges
3.5. Digital use cases for new market platforms 56
3.5.1 Local Energy Markets
3.5.2 ICT tools for cross-border markets 3.5.3 The DSO as market facilitator
3.5.4 The Universal Smart Energy Framework
4) Main recommendations on Digital roadmap 64
Conclusions 67
Appendix: ETP SG Workshop on Energy Digitalization 68
THE DIGITAL ENERGY SYSTEM 4.0
The European Digital Single Market initiative will ensure that Europe’s economy, industry and employment take advantage of digital technologies as a key driver for growth. All industrial sectors need to integrate these new technologies and manage the transition to a smart industrial society. Key initiatives include investment in ICT infrastructure such as cloud computing and Big Data, and ensuring that the massive amounts of data created by people or recorded mechanically bring added value that can be captured in Europe. Standardisation and “free flow of data” are also promoted to support these aims. In addition to the industry transition, digitisation will have key implications for the way our societies manage health, food, water and energy. It is important to experiment with the digital age in these contexts and ensure that the digitisation helps shaping these areas to the advantage of European citizens.
In particular, digital technologies will bring key contributions to the achievement of the Energy Union objectives for the transition to a 21st century secure, affordable and climate-friendly energy. They will support a service-oriented energy system as customers expect a high-quality, personalised service available 24/7. As a first step, the current roll-out of smart meters and smart metering infrastructure in Europe will open up wide opportunities for connecting the smart homes, smart buildings and industry 4.0 with the energy grids.
The increasing amounts of variable renewable generation (e.g. wind, solar) will require controls with very fast reaction times and will need to be balanced with flexibility of generation, active demand, storage and interconnections. Their decentralised real-time monitoring will be made possible by a mix of physical and virtual data: accurate measurements from cheap sensors connected through the Internet of Things and complex forecasting based on Big Data and cloud computing.
1) Forward
The energy system infrastructure is based on large expensive technical assets with long life times. Sensor data and information will drive smart asset management and maintenance and allow optimised investments in operational and capital costs of the European energy infrastructure.
The smart management of energy systems based on Internet of Things data will also enable the development of optimised decentralised solutions based on a closer integration of various elements of the energy system, exploiting the combined capacities and flexibilities of electricity, gas, heating and cooling, and transport sectors.
Patrick van Hove, European Commission
EUROPEAN TECHNOLOGY PLATFORM FOR SMARTGRIDS – DIGITAL ENERGY 4.0
The challenges to operate the power system in a dynamic way all require an appropriate, reliable and secure communication system. Therefore, more and more players enter the market with expertise in other sectors like mobile telecom. However, outlining the required functionalities of the communication infrastructure, taking into account the rapidly changing electricity generation mix, the ageing power assets and changing market models is not a straightforward task.
In this report, we define ‘Digitalization of the energy system’ as ‘The process of implementing and operating a set of assets by monitoring, transferring and analysing data which have been generated by one of the actors in the energy system’.
This includes smart operation of the grid at all voltage levels to reduce losses and outage times, retailers that optimize their portfolio by balancing based on forecasting algorithms, aggregators that control flexible consumption for various business cases, and new market platforms that provide suitable interaction between all these actors to optimize the overall efficiency.
The Digitalization of Energy includes as well the Digital Multichannel interaction with the Customers, the transactions operated through Business Networks like buying and selling on electronic marketplaces and the digital management of information collected and operated by the workforce.
In this report, we present several of these use cases illustrated by practical examples in the field. In every use case, a digital aspect is
present that facilitates transition to a new way of energy system operation, either for Generators, Transmission or Distribution Network Operators, Retailers, Aggregators or Consumers.
The table below describes important use cases and their benefits for the different actors. Note that it is not the intention of this report to provide an exhaustive overview of all possible use cases that use digitalization. We list and describe some promising use cases through projects in Europe, based on which we can build a vision on the future power system. Most of the use cases described in this project are still in the innovation stage, which is in line with the ETP mission to discuss the future technologies and applications. In the last chapter, the top 10 recommendations are given to various stakeholders.
2) What does Digital Transformation mean?
What are the use cases?
EUROPEAN TECHNOLOGY PLATFORM FOR SMARTGRIDS – DIGITAL ENERGY 4.0
Table 1: Description and benefits of digital use cases
GENERAL USES DESCRIPTION PRACTICAL USE CASES IN THIS REPORT EXPECTED BENEFITS
Forecasting generation Improved forecasting tools can allow a more efficient operation of the grid, in com-bination with curtailment, reactive power injection and dynamic line rating
The SWIFT project, discussing a prac-tical case where forecasting, dynamic line rating, curtailment and reactive power injection allow connection of a wind farm without a costly grid upgrade
Increase reliability of supply
Increace renewable energy penetration Increase reliability of supply, reduce cost of Operations and Capex and improve quality of service
Network planning and
operations Improved digital options for digital network planning. Smart operation of the net-work using IT & OT integra-tion, Big Data and Predictive Services (a large Dutch DSO collects 1.5 billion Grid sen-sor measurements to fore-cast the required operations in real time). Transmission & Distribution Networks and Power Generators’ Assets new models: Smart products, Data-driven business models, Technology-driven customer engagement and New allianc-es.
The STAR grid project: Grid manage-ment at LV and MV level
The iTesla project, Electrical system security within large areas
The GRID4EU German demonstrator, autonomous grid reconfiguration and forecasting in the MV grid
The GRID4eu Swedish demonstrator: Meter data management for network operation in the LV grid
Collaborative asset management, the SAP view
NOBEL GRID: Advanced tools and ICT services for DSO’s
The Servo Platform: interfase demand side management with DSO needs
Increase reliability of supply, reduce cost of Operations and Capex and improve quality of service
Reduce CAPEX investments
Improve quality of service
Provide real time Asset Cockpits reducing inci-dents and outages
Defer grid upgrades Enable flexible demand
Increase renewable energy penetration Digital use cases for
Re-tailers and aggregators The data that market facilita-tor provides (e.g. DSO) can be offered to other commercial parties to facilitate market operation
The Smarter EMC2 project: Empower-ing market actors through ICT technol-ogies.
IDE4L: digital tools for the technical and the commercial aggregator
Integrate flexible demand in the market Take grid constraints into account in market operation
Customer participation
in the market Full Customer Energy Manage-ment using Big Data and IOT. Smart devices to understand customer behavior by Utili-ties. Storage assets and EV’s can become a part of the solu-tion to integrate DER
The Linear project, dynamic pricing and residential demand response SmartHouse/Smartgrid
FINESCE: Smart charging of electric vehicles
COOPERATE: Neighborhood energy management
Peak shifting and portfolion optimization Integrate flexible demand
Defer grid upgrades and peak shifting Reduce losses and ensure safe grid operation Balancing Digital tools allow the TSO to
balance the network more ef-ficiently
IOT big data collection from end
cus-tomers and data aggregation balancing Better matching of demand and supply across the energy mix Integration of EV and
storage Storage assets and EV’s can become a part of the solution to integrate DER (estimated total world energy storage market by the year 2020 is 50 billion $)
Decentralised operation using DER
EV coordination schemes
Increase reliability of supply Decreasing grid upgrade costs Avoid over-voltages
Peak shaving for the consumer Enable flexibility by
le-veraging electronic mar-ket places
The data that market facilita-tor provides (e.g. DSO) can be offered to other commercial
FINESCE Local Energy markets eBadge: ICT tools for cross-border
Enable flexibility to support the local grid Improved international market model
3) Practical use cases and field trials
In this chapter, an overview of practical use cases is given per stakeholder. The objective of this chapter is not to present an exhaustive list of use cases, rather than providing practical information on actual field trials and projects, to build a vision on how digital technologies are changing the energy landscape.
Table 2: Overview of the discussed use cases
STAKEHOLDER PRACTICAL USE CASE PROJECT/FIELD TRIAL
(3.1) Power Generator (3.1.1) Probabilistic forecasting of wind generation, extremes and optimal use in the system
(3.1.2) Smart curtailment, dynamic line rating and Improved forecasting tools to maximize integration of wind
Anemos/Safewind SWIFT
(3.2) Transmission & Distribution Networks
(3.2.1) Innovative Tools for Electrical System Security within Large Area (3.2.2) Autonomous grid reconfiguration and forecasting in the MV grid (3.2.3) Meter data management for network operation in the LV grid (3.2.4) Collaborative Asset Management
(3.2.5) Advanced tools and ICT servicers for Distribution System Operators (3.2.6) A Platform to interface demand side management with DSO needs
iTesla FP7 GRID4EU FP7 GRID4EU
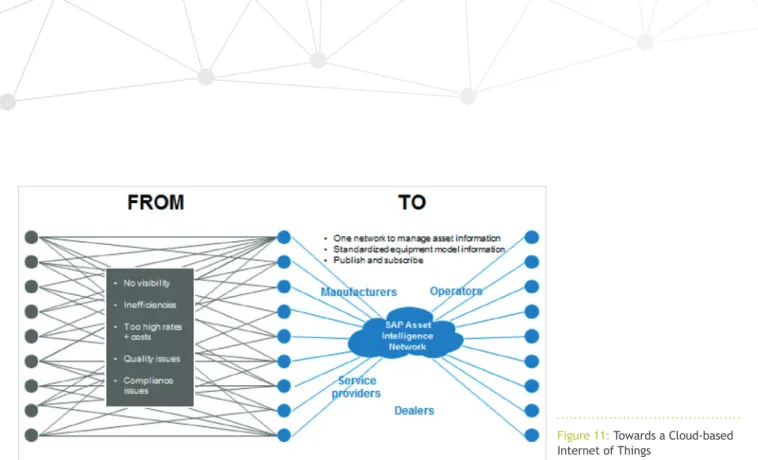
SAP Asset Intelligence Network NOBEL GRID
SERVO (3.3) Retailers and Aggregators (3.3.1) Empowering SG Market Actors through Information and Communication
Technologies SmarterEMC2
(3.3.2) IDE4L Use Cases on technical and commercial aggregators IDE4L (3.4) Consumers & Prosumers (3.4.1) Dynamic pricing and Demand Response Management Linear
(3.4.2) Smart houses in a smart grid environment SmartHouse/SmartGrid (3.4.3) Smart charging of electric vehicles FINESCE
(3.4.4) Neighborhood energy management FP7 COOPERATE (3.5) New Market Platforms (3.5.1) Local Energy Markets FINESCE
(3.5.2) ICT tools for cross-border markets eBadge (3.5.3) The DSO as market facilitator FLEXCIENCY (3.5.4) The Universal Smart Energy Framework USEF Foundation
3.1. Digital use cases for power generation
3.1.1 Probabilistic forecasting of wind generation, forecasting of extremes and optimal use of forecasts in power system operations and markets.
Overview of the ANEMOS, ANEMOS.plus and SafeWind projects
Integrating wind generation into power systems brings challenges because it depends on weather conditions. Forecasting the power output of wind farms, and the related uncertainties, is a means to facilitate large-scale integration of wind generation, in line with the EU goals for 20% of renewables by 2020.
Research in wind power forecasting in Europe dates back to the mid-80’s, when the first publications on statistical approaches appeared. In the 90s the first “hybrid” forecasting systems were applied at end-users mainly in Denmark. It was only in 2002 when efforts were federated at EU level to work jointly on improving wind power predictability. Leading research organizations in the field together with pioneer industrial partners formed a consortium that developed the ANEMOS project (2002-2006), supported in part by the EC under the 5th Framework Programme. This project brought together competencies from different disciplines and developed a systematic work that permitted to advance significantly the state of the art in the field:
• The wind forecasting technology was mapped through an extensive state of the art report [1]. The first benchmarking exercise was organized where 11 European forecasting systems were evaluated using a standardised evaluation protocol.
• A number of statistical and high-resolution physical methods were developed. A new approach based on the combination of forecasting models and Numerical Weather Predictions (NWP) was proposed outperforming each individual model. This approach later became main stream in operational systems. Also, the first probabilistic approaches were proposed with formal ways to evaluate uncertainty in the forecasts.
• To provide a common framework to operate and evaluate different models, the ANEMOS forecast platform was developed and integrated multiple models in a standardised way. This platform was evaluated in real conditions at demonstrations at several end-users. After the end of the project it was industrialised and is used today by end-users like the Australian TSO and market operator AEMO.
Following ANEMOS, two main types of research gaps were identified:
• The first concerned the integration of forecasts and the associated uncertainty in the decision making processes of the end users.
• The second concerned the need to improve wind power predictability at “challenging” or “extreme” conditions, when most of the forecast error appears with an impact to end-users.
As a result, two follow-up European projects were developed: ANEMOS.plus (2008-2011) and SafeWind (2008-2012), funded in part by the EC under the 6th and 7th Framework Programmes
EUROPEAN TECHNOLOGY PLATFORM FOR SMARTGRIDS – DIGITAL ENERGY 4.0
respectively. Together with ANEMOS, the three projects had a very focused goal: improving wind power forecasts and the associated value from their use. To achieve this objective, it was necessary to bring together experts with specific competences, such as meteorologists, forecasters, statisticians, engineers and others. Each project had as much as 23 partners from 9 countries. The projects were coordinated by ARMINES/MINES ParisTech.
The ANEMOS.plus project aimed at the development and demonstration of probabilistic approaches for the optimal management of electricity grids integrating large-shares of wind power generation. Traditionally, system operators manage the power system based on forecasts of the electricity demand which is highly predictable (typical errors are less than 4%). For this reason, power system management tools (i.e. unit commitment, economic dispatch a.o.) are in general based on deterministic approaches and thus not appropriate when high amount of intermittent resources are considered in the process.
In ANEMOS.plus project, at a first stage, the wind forecasting tools were enhanced with new functionalities such as probabilistic forecasting. At a second stage new probabilistic operational tools for managing wind generation and for trading in an electricity market have been developed. The project then focused on demonstrations identified as key challenges for large-scale integration of wind power into the electricity supply including:
1. Allocation of balancing power and definition of reserves for TSOs with demo cases in
Portugal (REN) and in UK/Northern Ireland (SONI);
2. Optimal scheduling of power systems with high wind penetration with demos in Ireland (EIRGRID and SONI) and in the island of Crete (PPC);
3. Congestion management in large power systems as well as local grids with demo in Germany (EWE);
4. Trading of wind power in electricity markets using advanced bidding strategies with demos in Denmark and Germany (Dong Energy and EWE) and finally
5. Management of storage associated to wind farms with test cases in Portugal and Spain. The project has shown that the probabilistic approach brings several gains. As it provides “hedging” to a broader range of scenarios of wind generation than the deterministic approach, it enhances the security of the power systems without increasing the costs of operation. The adoption though of fully probabilistic tools in the daily practice is challenging and far from straightforward. It requires the development of a stochastic optimization paradigm, which is technically challenging and implies a change of operator’s attitudes and practices. In general it can be said that there is a mismatch between advances in research and their adoption by the industry. In the case of trading in electricity markets the use of probabilistic forecasts permitted to avoid 15% of imbalance costs compared to the current practice.
Prior to SafeWind project, the focus was on forecasting “usual” operating conditions.
EUROPEAN TECHNOLOGY PLATFORM FOR SMARTGRIDS – DIGITAL ENERGY 4.0
However, challenging or extreme situations can result in severe forecasting errors that can be costly for both infrastructures (i.e. damage of wind turbines) and the electricity grid (i.e. black-out). SafeWind emerged to satisfy end-users’ need for specific approaches that substantially improve wind power predictability by reducing large errors, or by predicting extremes at local scale through to European scale. In addition, wind predictability was considered as a system design parameter linked to the investment phase, where the aim is to take optimal decisions when installing new wind farms.
SafeWind developed forecasting approaches for time scales ranging from few minutes ahead to some days ahead, and were considered single wind farms or aggregations at different geographical scales (region up to national). The resulting methods include:
• forecasting of large and severe variations of wind power (ramps);
• approaches for the generation of forecast scenarios taking into account the spatial and temporal correlations in the forecasts; • new tools like prediction risk indices able to
predict the level of error for the next day; • methods to predict specific situations like
cut-off of wind turbines that have a major impact in the production of a wind farm, etc.
• The project developed a “European vision” of wind power forecasting by establishing a database of 2000 meteorological stations throughout Europe that permitted to assess the weather situation over Europe. This was combined with data from around 150 wind farms. Exploiting this “big data” potential, spatiotemporal models were developed for
short term wind power forecasting that were found to outperform classical approaches by up to 20%. Also innovative tools for alarming and warning end-users on forthcoming situations involving large forecast errors were proposed.
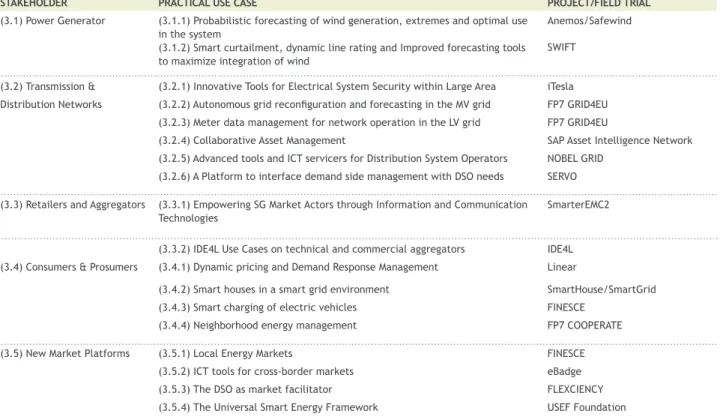
Figure 1: Example of a probabilistic forecast for a wind farm. Ramps forecasting based in ensemble NWPs, Illustration of the prediction risk index concept based on ensembles.
The role of the industrial partners was crucial since they provided among others real-world data that were used for the validation of the developed models. Recognising the role of meteorology when integrating renewables into power systems, a strategic collaboration was developed with the European Centre for Medium Range Weather Forecasts (ECMWF), the central research and operational weather forecasting centre in Europe. This permitted for first time to have research activities in the meteorology sector oriented to the renewable energy industry needs.
The SafeWind project developed Academic excellence and there were more than 150 scientific contributions to conferences and journals from which more than 44 were the papers to A rang peer-reviewed journals. In total, the three projects during the period 2002-2012 permitted significant advances in the state of the art with a total of more than 250 contributions at scientific conferences and journals imposing a European leadership in the field.
These experiences in wind forecasting acted as an accelerator for research in solar power forecasting, which in fewer years came at similar levels. The RES forecasting technology has reached a satisfactory level of maturity today. Operational systems are used in several countries and by different actors (TSOs, DSOs, producers, traders, a.o.). On-going research activities range from medium to high TRLs. There is a number of national or EU projects, mainly demonstration ones, that integrate renewable energy forecasting activities, but given that the topic is not the main focus in these projects, the impact in terms of improving predictability is in general smaller than that of dedicated projects.
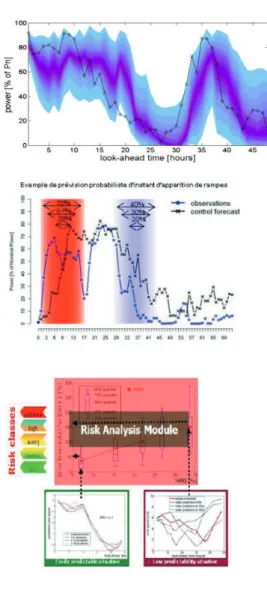
Figure 2: Network of 2000 weather stations considered in SafeWind. Analysis of weather patterns to detect large errors and model their propagation in space, Illustration of the spatiotemporal forecasting for the case of Denmark.
Improving accuracy remains though a requirement by end-users. Lots of projects are carried out today aiming at developing “flexibility” technologies like active demand or storage that permit to handle uncertainties in RES generation. The large scale deployment of flexibilities sources involves high investment costs. One should consider in parallel how to reduce uncertainties and forecasts errors. This can be done by further multidisciplinary research in meteorology and renewable energy forecasting, by going “back to the basics”, that is, by carrying out more fundamental research at low TRLs (2-3) to permit breakthroughs.
3.1.2 Smart curtailment, dynamic line rating and Improved forecasting tools to maximize integration of wind
OVERVIEW OF THE SWIFT PROJECT
Given current trends in renewable energy technologies, the realization of Europe’s ambitious renewable energy targets are expected to rely heavily on large wind farms. However, grid operators face substantial challenges to integrate these new production units: The requirement for substantial investments to extend the capacity of the network to accommodate the new production capacity at distribution grid level can result in the postponement of developments. Such projects can sometimes be approved before such upgrades are completed under strict curtailment rules resulting in the loss of substantial amounts of energy, impacting significantly the business case of the project and often leading to their cancellation.
The long-term objective of the Flemish innovation agency IWT funded project Smart Wind Farm conTrol (SWiFT), was to show how to maximize windfarm integration in distribution grids while minimizing the amount of lost wind energy at the lowest possible overall cost. This has been shown in an integrated case study in the Port of Antwerp through the application of real-time Active Network Monitoring and Control (ANMC) comprising innovative forecasting, dynamic line rating, and demand side management methods. Lead partner was the DSO Eandis, with contributions from iMinds, GE, 3E, Distrinet, EElab and IBCN.
Through the successful application of these methods, SWIFT has achieved a substantial breakthrough for smart grids; laying a baseline for how distribution grids can be designed in the future. The results of this project show that
[1] “The State of the Art in Short-Term Prediction of Wind Power, A Literature Overview, 2nd Edition, http://www.safewind.eu/images/ Articles/Deliverables/swind_deliverable_dp-1.4_sota_v1.1.pdf
[2] http://www.anemos-plus.eu [3] http://www.safewind.eu
EUROPEAN TECHNOLOGY PLATFORM FOR SMARTGRIDS – DIGITAL ENERGY 4.0
a smart and flexible operation of assets allows the reduction of grid component dimensions and costs with no impact on safety margins and security of supply.
ROLE OF FORECASTING IN THE PROJECT
The monitoring and control system involves real-time control of production and consumption with the goal to optimize the use of the grid infrastructure. The system is built on (i) maximum exploitation of time-varying grid constraints through real-time line rating (RLR), (ii) advanced wind power production forecasting, and (iii) demand-side management (DSM) optimization algorithms using both Real-time Line Rating and wind forecast as inputs. The wind power forecasting yields an estimate of the variable power injected in the distribution grid. This allows prediction of when the transformer connecting the distribution grid to the transmission grid will be overloaded, i.e. when local wind turbine generator (WTG) production will be very high. This then allows scheduling of variable loads within the local grid based on this prediction. In the case that sufficient loads cannot be scheduled, curtailment is minimized by means of Real-time Line Rating. Very short term forecasts are used, in combination with the RLR system, to ensure that curtailment is confirmed at the latest responsible moment, ensuring that the minimum curtailment possible is realized. Various methods for very-short term forecasting were tested within the project and combined with a numerical weather prediction (NWP) model based approach. The prediction was also further developed using the real-time data from the wind turbine generators. Both methods allow calculation of the prediction intervals of the forecast. These confidence values are critical in allowing users to make
informed decisions based on the forecast, e.g. for inclusion in bidding strategies and market interaction, as described below.
SUMMARY OF MAIN RESULTS OF THE PROJECT Improvements to both numerical weather prediction based (short term) and statistically based (very short term) approaches were tested. Historical production data made available within the research project allowed the development of automated data cleaning algorithms and the inclusion of these data into the definition of measured power curves. The NWP-based forecasts were significantly improved by this modification compared to the use of Manufacturer Power curves in combination with wake models. Additionally, the availability of real-time data access allowed the use of advanced statistical methods for very-short term predictions.
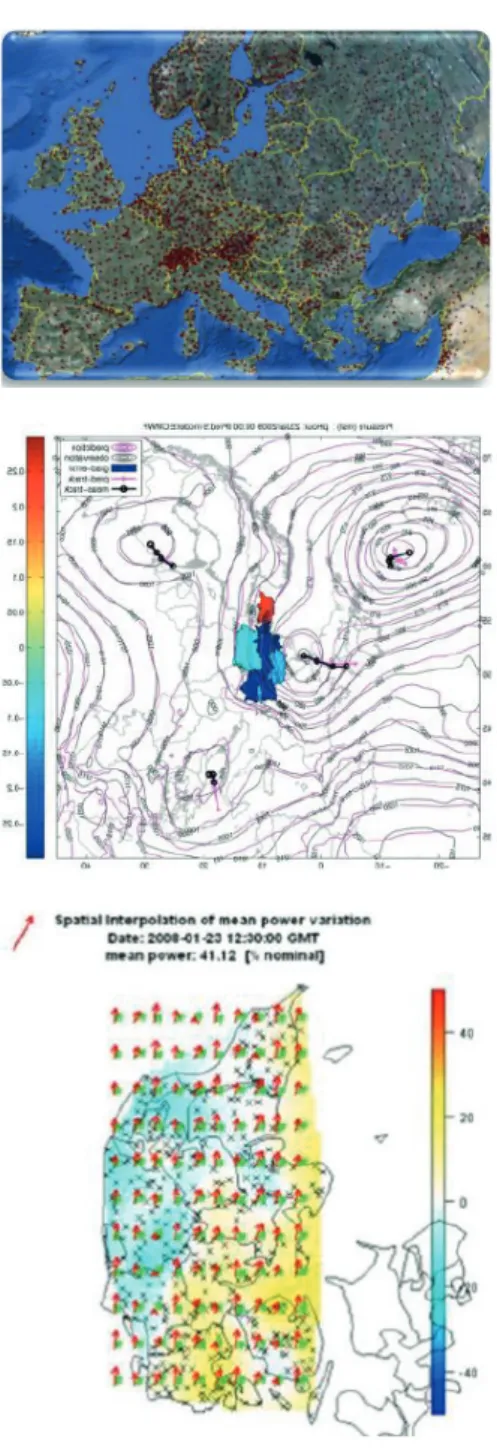
The optimal combination of these two approaches resulted in significant improvements over the baseline system, as shown in Figure 3. The resulting improvement in forecast accuracy is 1.8% in terms of park-level normalized mean absolute error (NMAE) over the entire 48h horizon. This improvement allows more certainty for implementation of DSM techniques such as industrial load shifting, which must be planned at least 1 day in advance.
Flexible operation of assets allows
the reduction of grid component
dimensions with no impact on
safety margins or security of supply.
EUROPEAN TECHNOLOGY PLATFORM FOR SMARTGRIDS – DIGITAL ENERGY 4.0
Figure 3: Normalised mean average error over 48 hour forecast horizon.
Over the very-short term (2 hours ahead), an optimal combination of very-short term algorithms and the NWP forecast resulted in a further 1.5% reduction in NMAE, allowing forecasts with NMAE lower than that of simple persistence, which remains today the benchmark over such short timeframes.
The improved forecast accuracy reduces the safety margin used by grid operators when preventing network congestion, meaning less curtailment is required to ensure grid stability and safety. With the development of a real-time system to incorporate the inclusion of these data for determination of curtailment requirements at the latest responsible moment, the improvements over the very-short term are of particular importance.
One of the key challenges for day-ahead forecasting of wind energy remains unscheduled outages. Either from planned maintenance or curtailment that is not communicated to the forecaster or unplanned maintenance or stop due to alarms, these outages can have large effects on the forecasts for small systems. Thankfully, the impact is then small on the overall grid. This should be considered if a
penalty system is adopted to enforce accurate predictions.
BENEFITS AND CHALLENGES OF DIGITALIZATION With the development of the smart-grid in Europe and the trend towards distributed generation, storage and flexibility, these technologies will become increasingly required to supply ancillary services for grid stability at an acceptable cost.
3E is currently involved in a research project (FutureFlow [1]) targeting the development of a cross-border automatic frequency response reserve (aFRR) market allowing full participation by renewable energy aggregators (both solar and wind). One of the key aspects here is the determination of a market structure that will allow aggregators to contribute not only with downward reserve (power reduction), but also with upward reserve (power increase).
Market possibilities to realize this include reservation payments for under-production, or frequency support activation prices attractive enough to warrant the necessary economic risk by aggregators. Additionally, as described by Kreutzkamp et al. 2013 [2], intra-day forecasts which show increased production at the 97.5% confidence limit (required to deliver the same reliability as conventional plants) compared to day-ahead predictions allow this ‘newly available’ generation to be bid on a frequency support market, as shown in Figure 2.
The curtailment system is also
useful to not disconnect when a
fault is occurring at higher voltages
in the grid.
Figure 4: Updated intra-day forecasts can be used to allocate production to different markets.
Along with these market restructures, the shift of ancillary services from a limited number of fossil power plants to a vast amount of distributed generators with flexible reserve offerings will require grid operators to further develop their procurement strategies for these new reserves to guarantee grid stability at an acceptable cost, i.e. adapting requirements to offer support during all moments over a day which exclude renewable energy sources. The challenge in the coming years will be to further reduce forecast uncertainties at all time horizons and further automate decision systems built upon these forecasts (flexibility activation approvals, curtailment requirements etc.) to reduce the lead time for such decisions and allow the ‘lost energy’ shown in Figure 4 to be minimised.
[1] FutureFlow Project H2020 GA 691777
[2] Kreutzkamp, Paul, Omar Gammoh, Karel De Brabandere, and Manoël Rekinger, “PV Forecasting Confidence Intervals for Reserve Planning and System Operation: Results of the
3.2. Digital use cases for power generation
3.2.1 The STAR project: Remote operation and Grid Automation systems
STAR (“Sistemas de Telegestión y Automatización de Red” - Remote Operation and Grid Automation Systems) is the name of a deployment Smart Grid project leaded by IBERDROLA which is integrating Smart Grid technologies and research results. As a matter of fact STAR has become the fundamental base for the digitalization of the Networks Business in Iberdrola Group. From the very beginning STAR coupled the Smart Meter (SM) deployment with the integration of new supervision and control systems at MV as well as at LV. Abundant equipment and systems developed at R&D projects have been included in the field deployment and operation procedures. Now they are the business as usual: • Automatic Grid Recovery system solves
automatically eventual faults in the grid, in 100.000 km of MV lines, not only using the feeder affected but also using other feeders and substations to correct the problem without human participation. A centralized approach has been the bases for a quick deployment after development in GRID4EU (demo-3). Initially using the existing remotely controlable infrastructure, now using also FD.
• The modification of settings for the Fault Detectors (FD) is nowadays made automatic and remotely, using web-services which are manufacturer-independent.
• The concentrators used for SM data collection at secondary substation (SS) level include now the functionality to detect
through LV measurements open circuits at one phase of the MV lines which frequently, normal protection systems cannot detect (GRID4EU demo-3).
• LV real-time supervision systems are reporting information about secondary substations including LV feeders.
• Tools for fraud detection compare the information from Data Concentrators at SS level with the SM measurements collected by the MDM system to search for SS with high probability of non-technical losses. • Since 2016, 2nd of July, it is compulsory
for Distribution companies at Spain to have 100% of hourly consumption curves from all SM to provide retailers with complete information for billing establishing the appropiate base for future demand response services. Consumers have also access to this information to make optimization decisions. At the beginning of 2016, 7 million of Smart Meters are already installed from a total of 10.5 million. More than 6 million of them are effectively integrated in the high end systems (MDC, MDM), showing an average unavailability of 0.09 which is equivalent to 9 days for 1% of SM in operation. The capabilities of this solution include the remote update of SM firmware (2.2 million of SM were remotely updated in 2015 to incorporate new functionalities).
Most of people associate SM to measurements for billing but they are providing other important added value. They provide also low voltage grid information like unbalances at transformers and LV lines level, information about the voltage
EUROPEAN TECHNOLOGY PLATFORM FOR SMARTGRIDS – DIGITAL ENERGY 4.0
at transformers and consumer premises, certain customer’s events like phase or neutral opened, and information under request about overvoltage duration, for example.
All this new information is producing a change in the operation methods and the qualification required for certain works. A new dispatching centre is being developed for LV grids at UPGRID project to take advantage of the information provided for this infrastructure. IGREENGrid project analysed, among other supervision solutions the capabilities of SM to provide voltage real-time measurements for areas with high DRES penetration, and STAR is taking advantage of these capabilities of PRIME. These kinds of projects are providing the bases to support a different way of operating low voltage grids.
Telecommunication is also a crucial element, enabler of all these Smart Grid technologies that is always evolving quickly. Research projects have also provided abundant improvements in this field, such as PRIME technology originated long ago in a European research collaborative project called OPERA, today implemented at STAR deployment, but currently, research continues producing results:
• A “high availability” solution for a critical element which is the MV broadband power line (MV-BPL) to link secondary substations among them using utility infrastructure. Master-slave systems have a weak point in the master element. Now, certain slave-elements have the capability to detect a failure in the Master and to assume its role re-stablishing the telecommunications. • A field study about the “guard distance” on
the MV BPL has allowed reducing the security distances among telecommunication cells using the same frequency, to half
previous values. This is increasing the possibilities while guarantying the absence of disturbances among cells.
• A compact solution for “data concentrator” integrating telecommunications was developed as R&D and now is used for SS that present a low concentration of customers • New and more performant PLC coupling
systems
The deployment of so large Smart Grid project has required new management tools, specific for STAR, to control the progress of work, the incidences, the status of the different systems, the pending tasks and to deal with the new information available for all stakeholders, inside and outside the company.
EUROPEAN TECHNOLOGY PLATFORM FOR SMARTGRIDS – DIGITAL ENERGY 4.0
3.2.2 Innovative Tools for Electrical System Security within Large Areas
The iTesla project aims at improving network operations with a new security assessment tool able to cope with increasingly uncertain operating conditions and take advantage of the growing flexibility of the grid.
Framework and goals:
Pan-European transmission system security issues will become more and more challenging due to:
• the growing contribution of renewable energy sources
• the introduction of new controllable devices • a partially controllable electricity demand;
the increasing difficulty to build new overhead transmission lines
• and the progressive construction of a single European electricity market.
This will result in more complex system operation, a grid working closer to its operational limits and therefore a need for a major revision of operational rules and procedures. Coordinated operation initiatives have already emerged for different regions of the pan-European transmission system (CORESO, TSC), but they require a new generation of tools allowing the different TSOs to increase coordination.
The developed toolbox supports the decision making process for network operation from two-days ahead to real time, based on these main features:
• provide a risk-based assessment taking into account and modelling the different sources of uncertainties (in particular intermittent power generation), the probabilities of contingencies and the possible failures of corrective actions.
Figure 5: Position of iTesla platform and tools compared to state of the art
• perform accurate security assessment taking into account the dynamics of the system using time-domain simulations.
• provide operators with relevant proposals of preventive and corrective actions to keep the system in a secure state.
• handle a continuous multi-period optimization problem from 2 days ahead to real time under uncertainty.
The toolbox allows TSOs to address network simulations of their own system, of coordinated regional systems or of the whole Pan-European system.
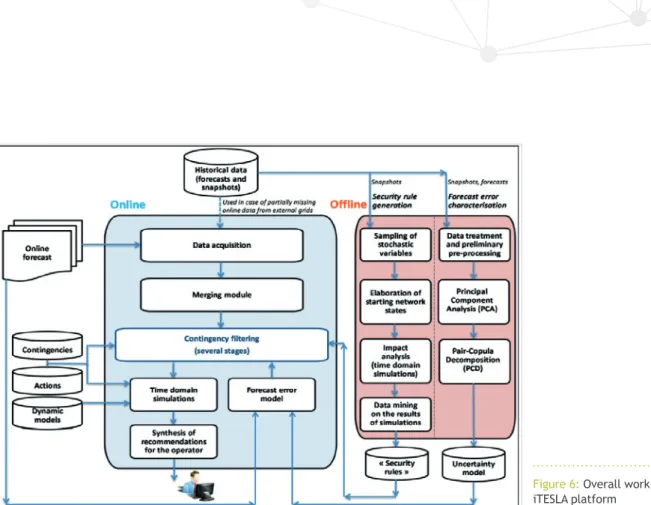
Figure 6: Overall work flow of the iTESLA platform
THE ITESLA PLATFORM AND MODULES:
The overall work flow of the iTESLA platform is given in the figure above.
The iTesla platform consists of two major parts, namely the offline and online analysis. The offline toolbox generates the generation rules and forecasts the error characteristics based on historical data. This analysis is performed once every week as it requires more computational capacity. The online analysis is a continuously running analysis that performs the security analysis from D-2 up to real time based on snapshots, online forecast of the system state and the results of the offline analysis. As such this analysis is not the same as a real time analysis. The online analysis differs from the currently used online analysis on three aspects: contingency filtering, uncertainty model and time domain simulations. The contingency filtering comprises several filter stages, such
as the worst state approach, Monte Carlo-like approach and corrective control optimization, to minimize the computational burden. The goal of the security rules in the contingency filtering is to provide a security judgement for the post-contingency outcome based on the pre-contingency system quantities without performing any power flow or time domain simulations. After the contingency filtering based on the security rules, the remaining set is analysed in detail with dynamic simulations. As such a dynamic model for all network components is needed. Therefore also a dynamic models library has been composed and validated inside the iTesla project. Finally a synthesis of these simulations is made and control actions are recommended to the operator.
The construction of the offline security rules is performed by applying data mining methods on the results of a large set of time domain
simulated contingencies, taking static and dynamic constraints into account. The input for the time domain simulations is generated by sampling all stochastic variables for all possible starting states of the network. The data mining is performed by applying the decision tree and K-nearest neighbour algorithms.
The uncertainty model is composed based on historical data by using the principal component analysis and pair-copula decomposition.
Finally the toolbox has been validated on several national and regional use cases, including different type of stability phenomena.
Defence plans and restoration
A different part of the iTesla project focused on the last line of defence, when the system enters the alert or emergency state, and the automatic restoration scheme composition. The work on defence plans first identified the weak points in the current implemented defence plans. Subsequently more detailed studies have been done to identify the role of renewable generation plants (focus on wind), Pan-European coordination, PMUs and out of step relays and distributed energy sources in defence plans. The work on renewable generation plants concluded that:
• Wind farms can contribute during over frequency situations
• Increasing the volume of secondary reserves contributes in reducing the risk of temporary imbalances caused by wind power uncertainties
• Wind power can reduce the time required for power system restoration.
The work on Pan-European coordination of controllable device concluded that:
• Coordinated control can contribute significantly in managing alert and emergency situations in the power system, specifically overloads and inter-area oscillations
• Tools for automatic control actions with power flow controlling devices are recommended as support for operators and backup for failed control actions.
The work on PMU and out of step relay tuning showed that:
• A tool for automatic tuning of out of step relay parameters is developed and implemented on a realistic power system. • The use of PMUs in out of step relays is
promising.
The work on distributed energy sources in under frequency load shedding schemes showed that: • The robustness of current UFLS schemes
comes under pressure from the increased penetration of distributed generation
• Different feeder ranking methods have been designed and successfully implemented on real power system data of different DSOs. The scheme robustness can be improved while reducing consumer impact. Therefore it recommended to take distributed generation into account for the feeder ranking in UFLS scheme design.
EUROPEAN TECHNOLOGY PLATFORM FOR SMARTGRIDS – DIGITAL ENERGY 4.0
3.2.3 Autonomous grid reconfiguration and forecasting in the MV grid
The German Demonstrator in the GRID4EU project (www.grid4eu.com) addressed the challenge of integrating more distributed energy sources in the grid with the demonstrator built up in the area of “Reken”, located in North Rhine-Westphalia. In this demonstration, monitoring and control are implemented for a smart operation of the grid. The considered grid was well selected since it showed already at the beginning of the project a balance between installed generation power and maximum demand. Further increase in renewables to be connected was forecast. The grid focused on consists of 85 secondary substations.
The following objectives are targeted:
• Integrating an increasing number of Renewable Energy Sources (RES) in the medium-voltage (MV) network and underlying low-voltage (LV) networks
• Achieving higher reliability, shorter recovery times after grid failures
• Avoiding unknown overloads and voltage violations
• Fulfilling the needs of surveillance and remote-control in MV networks
• Reducing network losses
The principle idea is to implement an Autonomous Switching System (ASS) that is based on an autonomous interaction between de-centrally installed modules in selected secondary substations and a lean control centre in the primary substation. All decentralized modules provide measured values and, furthermore, some of them are equipped with remote controlled switching gear. The central module collects all needed data and generates switching programs
derived from the current state of the grid. The possibility of autonomous switching provides dynamic topology reconfiguration which is a new concept of operation.
AUTONOMOUS MODULES
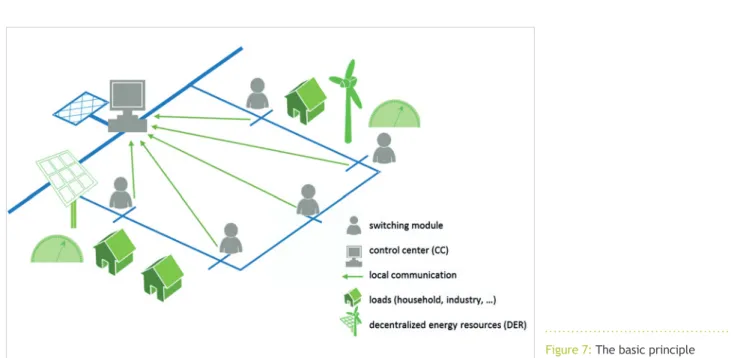
The Autonomous Switching System is based on an autonomous interaction between modules implemented in secondary substations and a control centre located in the primary substation. The modules are divided into two groups: • Measuring modules that provide field
measurements,
• Switching modules which perform field measurements and execute the switch gear. The control centre and all modules are equipped with a Remote Terminal Unit (RTU). The interaction between the three components is illustrated in the Figure 7
EUROPEAN TECHNOLOGY PLATFORM FOR SMARTGRIDS – DIGITAL ENERGY 4.0
Figure 7: The basic principle
For safety reasons, the modules have to be equipped with a service-modus (deactivation of autonomous switching and remote-control) for work on the grid (e.g. maintenance). If service or maintenance works are in progress, earthed parts of the grid have to stay earthed and modules are not allowed to switch.
To get more information about the implementation of the modules on the field, please refer to the “Autonomous modules” and “Autonomous Switching System infrastructure” spotlights of the GRID4EU German demonstrator. THE COMMUNICATION INFRASTRUCTURE
For all information exchanges, the protocol IEC 60870-5-104 is used, whether it is within the Autonomous Switching System or with the SCADA. This exchange of data is not limited to the measured information, like status of a switch or the voltage, also all information about the status of the modules is transferred by using this protocol.
Concerning the communication structure, the necessary ICT infrastructure has been set up to ensure the communication between:
• The central RTU in the Control Centre and the grid control system (SCADA).
• The central RTU and the decentralised RTUs in the switching and measuring modules. The secondary substations (modules) send data via a GPRS connection to an APN . The information is then forwarded to the central RTU through the backbone of the process data network. Finally, the central RTU collects all the data and provides it to the control system (SCADA).
All these information exchanges are performed thanks to a hierarchic network based on the following communication structure:
• A basic level, the TCP/IP data flow, going through the VPN-router located at the communication centre.
• A second layer, the encrypted VPN. As a central approach was chosen (communication towards one single “Master module”, the RTU in the primary substation), it is always established from the master RTU towards the VPN-router.
• A third level, the dedicated “modules-network”. As soon as the master RTU is connected to the VPN, logical IEC 60870-5-104 connections can be established between the modules and the master module, as well as with the SCADA system. This is always initiated by the master or SCADA (controlling substation).
The RTU information, like indications, goes through all these levels.
To get more information about the communication infrastructure, please refer to the “communication infrastructure” spotlights of the GRID4EU German team.
The IT solutions are usually adapted
to the needs in the new Smart
Grid domain and are often vendor
specific. A lot of work needs to
be done to combine the different
domains network, IT and SCADA
into a working system.
THE GRID RESTORATION ALGORITHM
After a fault occurred in the MV grid (e.g. short circuit) the circuit breaker at the primary substation switches off the entire bay so that every secondary substation in the feeder suffers an outage. Thus, the objective of the restoration algorithm is to identify the faulty grid section, to isolate the most compact part of the grid and to recover the energy supply in the remaining grid. This procedure is often defined by the term FDIR – fault detection, isolation and restoration.
Four tasks are involved in the overall procedure. First, the short circuit (SC) detections put the system in the post-fault state. SC indications provide a data basis for finding the affected network section between monitored secondary substations. Then, an algorithm for finding the minimal switchable section of the network computes the switching programme which would isolate this part of the network. The isolation phase is carried out by the execution task. In the following step a restoration scheme has to be computed. This new topology enables repowering the previously switched-off parts of the network, which are by now isolated from the faulty section. The final step is carried out by the execution task. To get more information about the restoration algorithm, please refer to the dD1.4 Deliverable document of the GRID4EU German team.
SWITCHING PROGRAM MANAGEMENT ALGORITHM The switching program management is a supporting routine which is required for performing switching actions in all use cases: decentralized grid operation, fault management and loss reduction. A switching program describes a sequence of switching actions and some additional information: • Activation time
• Initial topology • Switches to close • Switches to open
The activation time is use case dependent and can express an immediate execution or a scheduled switching action. In order to guarantee a consistent topology reconfiguration the assumed initial topology state is attached. If the topology has been changed (e.g. by manual operation) before the execution of the switching program, the execution of the programme has to be cancelled.
All switching programs are stored in a queue object and are managed by the switching program management task.
To get more information about the switching program management algorithm, please refer to the dD1.3 Deliverable document of the GRID4EU German team.
THE GRID RECONFIGURATION ALGORITHM
The developed Autonomous Switching System uses a grid reconfiguration algorithm in different cases:
• Decentralized medium voltage network operation: as a reaction to congestions or overvoltages in the grid
• Failure management: as an algorithm for finding a new network topology when restoring the grid
• Loss reduction: for finding a loss-optimal network topology for a certain period of time, predicted by a forecast-based algorithm Due to its nature the reconfiguration algorithm is implemented centrally on the master RTU unit. Data from all secondary substations is collected and used as input. Secondary substation RTUs are also responsible for the execution of switching commands.
The algorithm flow is depicted in Figure 8, based on the “Decentralized medium voltage network operation” Use case, considering an occurred congestion. The triggering event is a decentrally detected state violation (voltage or current), which is forwarded to the master RTU.
Necessary input data for this functionality, the present [P, Q] snapshot and the online topology are continuously forwarded to the master unit. In the next step the static reconfiguration algorithm is applied. A target topology is calculated and the switching program management task schedules a switching action sequence for immediate execution.
When the reconfiguration execution is completed, a secure state is supposed to be reached. This concept cannot be directly compared with the closed control loop principle. Though, a feedback of the behaviour of the system is given indirectly by the state machine mechanism.
As input data, current active and reactive power measurements and online switch states are used. A load flow based algorithm determines an optimal topology which eliminates voltage or current limit violations. A switching program is prepared for immediate execution. After the reconfiguration the overall system state is being optimized.
EUROPEAN TECHNOLOGY PLATFORM FOR SMARTGRIDS – DIGITAL ENERGY 4.0
Figure 8: Congestion Management Algorithm
To get more information about the grid reconfiguration algorithm, please refer to the “grid reconfiguration algorithm” spotlight of the GRID4EU German Demonstrator.
THE FORECAST ALGORITHM
For the loss reducing grid operation knowledge of middle-term grid behaviour is required. In order to provide this information, active and reactive power flow forecasts are computed locally at the secondary substation level. Every 15 minutes forecast data is forwarded to the central RTU at the primary substation and used as input for the loss reduction algorithm.
Especially with regard to the limited hardware capabilities of the RTUs a double seasonal exponential smoothing forecast technique is used. This does not require any additional information (e.g. weather data) and uses only measurements and their 15 minutes average values as input data for the forecast.
To get more information about the grid forecast algorithm, please refer to the “forecasting algorithms” spotlights of the GRID4EU German demonstrator.
THE FORECAST BASED LOSS REDUCTION ALGORITHM
On the one hand, every significant network state change should be followed by a reconfiguration process for gaining maximal loss-reducing
effect. On the other hand, a high number of switching actions results in faster wear of the switching devices.
A trade-off for less switching actions and still good loss reducing operation is to be found. In order to find this balance a network state forecast is carried out. The network state might be represented by the residual load, which consists of the sum of the active nodal power measurements acquired at the secondary substation level.
The proposed loss reduction algorithm is applied periodically (every 15 minutes) and consists of the following structure (see the Figure 9).
Figure 9: Forecast based loss reduction algorithm
EUROPEAN TECHNOLOGY PLATFORM FOR SMARTGRIDS – DIGITAL ENERGY 4.0
Table 4:* One switching action = switch on/off
Table 3:Losses reduction over one year simulation
After the local power forecasts have been collected, they are mapped onto a reduced network model which is required for load flow computations. Based on local forecasts the residual load is calculated. This variable provides possible times for switching actions. To obtain target topologies for these times average forecasted active and reactive power values for the supposed time interval are calculated. When switching time and target topology are obtained, the corresponding switching action is scheduled for possible future execution. Every 15 minutes the scheduled actions are checked by applying more precise data from the updated forecast. When the scheduled time is reached the switching action has to be executed.
To get more information about the forecast based loss reduction algorithm, please refer to the “forecasting algorithms” spotlights of the GRID4EU German demonstrator.
IMPACT ON SUPPLY RELIABILITY
Simulations of different events of fault indicated that a higher level of automation leads to an improved security of supply. The calculated values for SAIDI and ASIDI are available in the following table:
IMPACT ON GRID LOSSES
The testing results in MATLAB showed that the mean absolute percentage error varies between <1% and 12%. With this forecast precision, it is possible to reduce significantly the number of switching actions when compared with the optimal reference:
To get more information about these algorithms, the German demonstrator and the entire GRID4EU project, download the final report via the website www.grid4eu.eu
3.2.4 Meter data management for network operation in the LV grid
The LV network that VATTENFALL Distribution operates in Sweden is to a large extent considered as rural / semi-rural. Indeed about 83% of the secondary substations and approximately 57% of the Swedish customers supplied by Vattenfall are classified as part of the LV rural/semi-rural network. Moreover the number of customers per secondary substation in these parts of the network is relatively low with an average of 14.4.
The Swedish GRID4EU demonstrator aims at testing a solution for improved outage and power quality
Situation SAIDI in min/a SAIDI in min/a
Current state 12.8 14.9 System applied 6.1 7.5
Network losses Switching actions*
Static topology 100% 0 Optimal
reconfig. 71.3% 17814 Forecast-based 79.7% 3142
On average, the Autonomous Switching System reduces the time of reconfiguration by 21,5%.
SPECIFICATION SHEET
management of the LV network. The implemented solution allows the monitoring of the LV network by deploying intelligent equipment in secondary substations (RTUs) and using the existing Smart Meters that have been deployed at all customers’ premises several years ago.
Apart from addressing the objective mentioned in the previous paragraph, Swedish Demonstrator also analyzed the possibility of using only the power quality events provided by the AMM system to monitor the LV network. Although such analysis would not be as beneficial as the combined analysis of meter and RTU data for monitoring the LV network, it would still be very valuable in cases in which there were no RTUs installed. Today most of all the secondary substations are not equipped with any advanced measuring devices.
Information from two different sources are used and combined in an integrated back office system environment. The solution supports different user needs and operating functions such as network planning, optimization, power quality analysis, field service processes etc.
THE ADVANCED METERING INFRASTRUCTURE (AMI) The Swedish Demonstrator has included some 10,600 Smart Meters connected to 100+ Data Concentrators. Together with the PLC communication infrastructure and integrations with the AMM collecting system, this forms the Smart Metering Infrastructure.
Data Concentrators (DC) are collecting metering data from the meters being installed on the same power line structure as the DC. The DC is in turn connected to the overlying collection system via GPRS. The data traffic uses common standards (OSGP) and passes the telecom operator communication platform and servers before being exported to the AMM Collecting system server through VPN integration.
The AMI system exports date to the MDMS: • Smart Meter data
• Measurement values
• Events/alarms. The SCADA generates an alarm, which is instantly processed by the DMS to red mark the line in questions to indicate the loss of power. This improves the fault location time. Events are divided into general and real time events. General events are collected once a day and real time events are collected as soon as possible after occurrence. Real time events are defined to be of more importance for power quality monitoring and quality of supply to the customers.
The Swedish Demonstrator also analyzed the possibility of using only the power quality events provided by the AMM system to monitor the LV network. Although such analysis would not be as beneficial as the combined analysis of meter and RTU data for monitoring the LV network, it would still be very valuable in cases in which there were no RTUs installed. Today most of all the secondary
substations are not equipped with any advanced measuring devices.
THE MDMS
The MDMS platform provides a tool for in-depth analysis of customer and network behaviour. The high level functional configurations and integrations relevant to MDMS testing in order to run MDMS properly are:
• VPN environment
- The demonstration application is installed as a “stand alone” solution, separated from the operating Vattenfall system environment.
• Asset Synchronization
- Network assets and relationships was made in a one-time synch with Vattenfall Master systems and the MDMS. The same with DMS/RTU system data.
• Meter Read and Event processing
• Interfacing with the AMI system (measurement values and events/alarms) is done via VIP (Vattenfall Integration Platform).
- Data from the DMS_RTU is processed using a file format point to point connection. The reporting framework Analytics Foundation is designed to pull data out of the MDMS and create a purpose built database.
From the wide range of reports, only Load Analysis and Device Event reports were used for the Swedish Demonstrator analysis.
Load analysis reports show load usage data, load curves and load duration curves. These reports provide a way to drill into load usage from a high-level view (secondary substation).
Device Event reports are used to track outage issues, trends and impacts. These reports provide
a way to drill down into events from a high level view to individual customers or single delivery points (SDP). Events are sorted into predetermined buckets for easier analysis. For instance, the following Device Event summary table shows that 192 SDPs experienced an outage at that time:
Figuare 10: Device event summary table
Partners of the Swedish Demonstrator agreed on the most interesting events coming from the smart metering system from power quality point of view and that would be useful for monitoring the LV network. Those events and their definitions are listed below:
• Events generated at smart meters
- Reverse Energy. The meter has registered reverse power. Typically occurs if the consumer is generating power, otherwise the meter may be mis-wired. Could also be considered as a possible tamper event. - Sag. This event occurs when a voltage
sag is detected in any phase. The voltage must drop below 10% of the rated voltage (230 V) to be recorded as an event.
- Surge. This event occurs when a voltage surge is detected in any phase. The voltage must be above 10% of the rated voltage to be recorded as an event.
EUROPEAN TECHNOLOGY PLATFORM FOR SMARTGRIDS – DIGITAL ENERGY 4.0
- Phase Loss. Voltage below 61% of the rated voltage has occurred on at least one phase.
- Power Outage. Power outage occurred at the meter. Expected when power outages occur. The event will be reported after power is restored.
• Events generated at data concentrators
- Phase Inversion. This event occurs when the meter experiences phase inversion. This alarm may occur because the meter is mis-wired, although in some cases it can occur simply due to noise on the power line.
• Events generated in AMM Platform Titanium, as an algorithm
- Zero Fault. A zero fault event is triggered when there is a surge above 270 V and also a sag event.
- Extremely High Voltage. This event is triggered when there is a surge above 270 V and no sag event.
- High Voltage Fuse Broken. This event is triggered when two phases are below 30% of the nominal value and one phase is within 10% up or down the nominal value. RTUS
RTUs are deployed at secondary substation and are connected to each outgoing LV line.
All three phases are measured. RTU’s are communicating with built in GPRS modem, using IEC 60870-5-104 protocol.
The use of a RTU solution in secondary substations allows the detection of outages and LV faults through the following process:
• The RTU detects an outage or a LV fault, e.g. a drop in current on one or more phase, and
reports a warning to the SCADA system. This improves the fault awareness time.
• The SCADA generates an alarm, which is instantly processed by the DMS to red mark the line in questions to indicate the loss of power. This improves the fault location time. • The isolation work is done manually by the
operator who uses information mainly from the RTU to work more efficiently. This information will help to reduce the isolation time in field. The system environment, the location to host the system hardware, was selected based on primarily IT and Information security regulations. The hardware is located outside Vattenfall ordinary network, on a test net operated by Vattenfall R&D department. “Open” network connections between the Vattenfall corporate network and the Swedish Demonstrator environment was not allowed to be established. Data was also needed to be anonymous.
The future LV monitoring solution
will contain a combination of
different technical solutions,
from only using smart meters to
advanced equipment in secondary
substations.
THE DISTRIBUTION MANAGEMENT SYSTEM
The Distribution management system (DMS600) in the Swedish Demonstrator comprises two functionalities. Both target operator awareness and in aim to shorten lead time in fault location and fault resolution times (SAIDI);
• AMR Meter Event visualization
- A functionality which processes selected high priority events from the meters at customer premises and maps them to the