Predictors of PSA test and Mammography use in the
Canadian population
By : Shankar Kamath KAMS16077703 Winter 2005Abstract
Background
The effectiveness of the use of mammography as a medical screen for women aged 50-69 is well-documented; however, there exists much uncertainty in the effectiveness of mammography screening for women aged 40-49. Additionally, much uncertainty lies in the use of the PSA test as a medical screen. The objectives of this study were (1) to determine the rates of PSA test and mammography test use and (2) to compare and contrast the factors that predict the use of mammography and the PSA test, respectively. Methods
The Canadian Community Health Survey, Cycle 1.1 was used. It is survey of
approximately 133,300 people and it covers all health regions, provinces and territories. Probit regressions were used to analyze the statistically significant determinants of PSA test in men and mammography uptake in women. Mammography uptake in women aged 40-49 was also analyzed independently.
Table of Contents
1 Introduction... 5
1.1 Screening for Prostate Cancer – The PSA Test... 6
1.2 Screening for Breast Cancer – The Mammogram... 6
1.3 Evidence for screening... 7
2 Recommendations for Screening... 10
3 Issues surrounding PSA and mammography screening... 12
3.1.1 Effectiveness of Screening... 12
3.1.2 Harmful effects... 13
3.1.3 High and informed uptake... 15
3.1.4 Effectiveness of treatment... 16
3.1.5 Cost... 16
4 Cost-Effectiveness Analysis in Health Economics... 16
4.1 CEA of mammography - Salzmann et al... 19
4.2 CEA of PSA test - Ross et al... 20
5 Previous Research on Determinants of Screening... 21
5.1 Review of empirical evidence – Jepson et al... 23
5.2 Sickness - Wu... 25
5.2.1 Results... 25
5.3 The Physician’s perspective - Tudiver et al... 26
6 Determinants of PSA test and mammography use... 29
6.1 Data and Empirical Strategy... 29
6.2 Results and Analysis... 29
7 Conclusions... 35
8 Appendix A – CTFPHC and USPSTF ranking... 36
9 Appendix B – Sample vignette... 36
10 Appendix C – Full Probit results... 37
11 Appendix D - Description of variables... 45
11.1 Weighting... 45
11.2 Dependent variables... 46
List of Tables
Table 1 - Guidelines on PSA test and mammography for screening purposes... 11
Table 2 – Determinants of decision to undergo screening... 21
Table 3 – Determinants of PSA screening... 23
Table 4 – Determinants of mammography screening... 24
Table 5 – Physician perceptions of guideline recommendations... 27
Table 6 – Determinants of physician decision to refer for medical screens... 27
Table 7 – Summary statistics... 29
Table 8 – Cross-tabs of screening and several predictors... 31
Table 9 – Coefficients of probit regressions... 33
Table 10 - Ranking methodology of CTFPHC and USPSTF... 36
Table 11 – Probit results for determinants of use of PSA test (ever)... 37
Table 12 - Probit results for determinants of use of PSA test (last year)... 38
Table 13 - Probit results for determinants of use of mammogram (ever)... 40
Table 14 - Probit results for determinants of use of mammogram (last year)... 41
Table 15 - Probit results for determinants of use of mammogram for women aged 40-49 (ever)... 42
Table 16 - Probit results for determinants of use of mammogram for women aged 40-49 ( last year)... 43
List of Figures
Figure 1 – Issues surrounding screening programs... 121 Introduction
Breast cancer and prostate cancer are the two most frequently diagnosed cancers in Canadian men and women, respectively. In 2004, an estimated 20,100 men will be diagnosed with prostate cancer and 21,200 women will be diagnosed with breast cancer. One in 8 men will develop prostate cancer during his lifetime and one in 9 women will develop breast cancer in her lifetime. As such, there has been a tremendous effort by government, the medical community and non-profit organizations, such as the Canadian Cancer Society, to reduce the incidence of breast and prostate cancer.
Early detection using screening procedures such as the Prostate Specific Antigen (PSA) test for prostate cancer or the mammogram for breast cancer are widely perceived to be beneficial - if you discover it early, then it can be treated early and you will live longer, is the usual refrain. The goal of screening is to detect a condition before it produces
symptoms. They are usually quick, relatively painless and inexpensive. If the screen is positive then the patient discovers the condition early, if it is negative then the patient is reassured. So, on the face of the issue, screening seems to be highly desirable.
This is, however, partly misleading. Screening is a complex set of procedures that involves many tradeoffs and risks. There are important costs – both financial and health, which make these procedures more controversial than is perceived by the general public. Mass screening for a disease involves testing a large number of people in order to detect a condition in a relatively small number of people. Therefore, it is possible that the people who experience harm from the screening program far outnumber those who benefit.
This paper examines the determinants of use of two of the most widely used medical screens – the mammogram, an X-ray used to detect breast cancer and the PSA test, which is a blood test used to detect prostate cancer. It should be emphasized that the issues discussed in this paper relate to mass screening. It is generally acknowledged that PSA testing and mammography are useful tools to detect the incidence and severity of prostate and breast cancer, respectively. However, the use of the PSA test for mass screening in
men over 50 and the use of mammography in mass screening for women aged 40-49 is still controversial.
The relevance of this study is threefold – first, to discuss the underreported downsides of screening; second, a literature review of previous research on determinants of medical screening; and third, an econometric analysis of the determinants of PSA testing and mammography in Canada. Additionally, the determinants of use of the PSA test and mammography will be compared.
1.1 Screening for Prostate Cancer – The PSA Test
There are 2 main methods of screening for prostate cancer - the first is the Digital Rectal Examination (DRE), which is the most common and least expensive way to screen for prostate cancer. The other main medical screen for prostate cancer is the PSA test, which is a blood test to help detect prostate cancer. The PSA test measures a substance called prostate specific antigen made by the prostate. It is normal to find small quantities of PSA in the blood and levels rise with age.
To confirm a case of prostate cancer, a biopsy and further imaging studies (X-rays, ultrasound, CT scans, MRIs) are performed. Treatment options include surgery, radiation therapy and hormone therapy.
1.2 Screening for Breast Cancer – The Mammogram
There are three main methods of screening of screening for breast cancer – two are the Clinical Breast Examination and Breast Self-Examination, which are simply the procedures where a doctor or an individual manually examines the breast. The third procedure is mammography, which is a type of x-ray that can see changes inside your breasts that are too small to feel.
To confirm a case of breast cancer, a biopsy and further imaging studies (X-rays,
the cancer, as well as other factors such as the patient’s fitness. Options include surgery, radiation therapy, chemotherapy and hormone therapy.
1.3 Evidence for screening
As with many medical procedures, the only way to determine the effectiveness of screening using the PSA test and mammography is with a comprehensive Randomized Control Trial (RCT), where one group of people is randomly assigned to the screening procedure and the other is not. No comprehensive RCT has been yet completed for the PSA test. Two are currently in progress: the European randomized study of screening for prostate cancer (ERSPC), which is scheduled to be completed in 2006, and the Prostate, Lung, Colorectal & Ovarian Cancer Screening Trial (PLCO), which is scheduled to be completed in 2015 (preliminary results available in 2006).
Conversely, several RCTs have been performed for breast cancer screening
(mammography) in Canada12, the USA3, Scotland4, and five trials in Sweden (the latest in Gothenburg5). The general consensus is that screening results in a 20-30% reduction in mortalityi but the degree of effectiveness for different age groups, especially women aged 40-50 is uncertain5.
This contrasts the degree of certainty regarding these two screening procedures: there is little knowledge of the benefits, risks and costs of the use of the PSA test as a screen, whereas there is strong evidence that the use of mammography in a mass screening program is beneficial.
Although no RCT has been done to examine the effectiveness of PSA screening, there are several notable studies. McDavid et al6 examined prostate cancer mortality and incidence in the U.S. in Canada over the last 30 years. Canada and the U.S. experienced 3.0% and 2.5% growth in age-adjusted incidence from 1969-90 and 1973-85, respectively. Annual
i There are, however, detractors. In an article that rocked the medical community, Gotzsche and Olsen6
criticized the randomization methodology of 6 of the 8 major RCTs examining mammography for screening and concluded that “screening for breast cancer with mammography is unjustifiable”. But, this opinion is in the minority.
age-adjusted mortality rates in Canada were increasing 1.4% per year from 1977-93 and then fell 2.7% per year from 1993-99. They conclude that the incidence patterns
observed between the U.S. and Canada suggest a strong relationship to PSA test use. On the other hand, 3 “natural experiments” performed in the USA7 and Canada89 found that while the PSA test may be associated with a rise in incidence of prostate cancer, it is not associated with a decrease in mortality. This suggests that many of the cancers that were detected and treated with the PSA test were clinically insignificant.
As noted before, there has been no RCT for the PSA test, so one must be even more wary when analyzing incidence and mortality statistics for prostate cancer vis-à-vis the PSA test. Reductions in mortality could be due to, for example, better treatment techniques. Additionally, there are less obvious sources of biases:
1. Lead time bias - many cancers, especially prostate cancer, become more prevalent with age. Autopsy studies have shown that up to 30% of men aged 50-70 have evidence of prostate cancerii. Therefore, there are a large percentage of men who have prostate cancer, but it does not need to be treated because it never causes significant symptoms and did not pose an imminent danger. To understand lead time bias, consider an example - a man undergoes screening and is diagnosed with prostate cancer at age 62 and subsequently dies at 70. Another man does not opt for screening, however, at age 66 he develops symptoms and dies of prostate cancer at 70. Assume that both men had prostate cancer at the age of 62 but only the first man, who underwent screening, discovered it. Notice that the treatment
administered to the first man was not effective, i.e. he lived no longer than the man who did not undergo treatment. However, for statistical purposes, his length of survival is 8 years whereas it is only 4 years for the second man. Often, when the media reports of increasing survival rates due to screening, they do not take into account such possible lead time bias.
2. Heterogeneity - Cancers are heterogeneous; they grow at different rates in different people. This heterogeneity leads to another bias – slow growing cancers are in a
pre-symptomatic state for a longer period so they are more likely to be discovered during screening. Consider another example – one man, who undergoes a PSA test screening yearly, is found to have a slow growing form of prostate cancer. Another man, who also undergoes a yearly PSA test screening, does not discover his quick growing form of prostate cancer because it was too small to be detected during last year’s check-up but it progressed extremely quickly and symptoms developed before this year’s check-up. The statistical bias is evident – slow growing cancers are more likely to be detected by screening than fast growing ones, thus giving the impression that screening reduces mortality.
3. Natural History / Over-diagnosis – Doctors often tell their patients that ‘more men die with prostate cancer than of prostate cancer’. This is because, in many instances, a cancer grows so slowly that it never becomes fatal or does not cause symptoms. Therefore, screening can detect cancers that would never have caused symptoms, much less death. The detection of such non-life threatening cancers will contribute to inflated survival statistics. The over-diagnosis of prostate cancer, i.e. the proportion of cancers diagnosed by screening that would not have otherwise been detected during the individual’s life, has been estimated to be 29% in white men and 44% in black men10. This over-diagnosis can possibly lead to unnecessary treatment, which can almost never be identified – i.e., it is impossible to prove, after the fact, that a prostatectomy was unnecessary.
2 Recommendations for Screening
There exist many governmental and non-governmental organisations that review the evidence and make recommendations on preventative health and screening. These
include medical associations such as the American Medical Association and the Canadian Urological Association; and government associations such as Agence d’évaluation des technologies et des modes d’intervention en santé (AETMIS) and the British Columbia Office of Technology Assessment.
In the interest of brevity, I have included only the recommendations of two of the most respected governmental organisations - the Canadian Task Force on Preventive Health Care (CTFPHC) and the U.S. Preventative Services Task Force (USPSTF), and two non-governmental organisations - the Canadian Cancer Society (CCS) and the American Cancer Society (ACS).
The CCS is privately funded, non-profit organization, whose areas of interest are research, advocacy, prevention, information and support. Its American counterpart, the American Cancer Society adopts a similar role in the United States.
The CTFPHC is a government funded (by Health Canada) and managed organization whose stated mission is “to determine how the periodic health examination might enhance or protect the health of Canadians and to recommend a plan for a lifetime program of periodic health assessments for persons living in Canada”iii. Similarly, the U.S. Public Health Service (Department of Health and Human Services) convened the USPSTF; its stated goal is to “evaluate clinical research in order to assess the merits of preventive measures, including screening tests, counseling, immunizations, and
chemoprevention”iv.
iii http://www.ctfphc.org/
The CTFPHC as USPSTF evaluate the evidence associated with preventative health care procedures and makes recommendations whether to incorporate these procedures in Periodic Health Examinations (PHE). The system of ranking recommendations by degree of evidence available is described in
Appendix A.
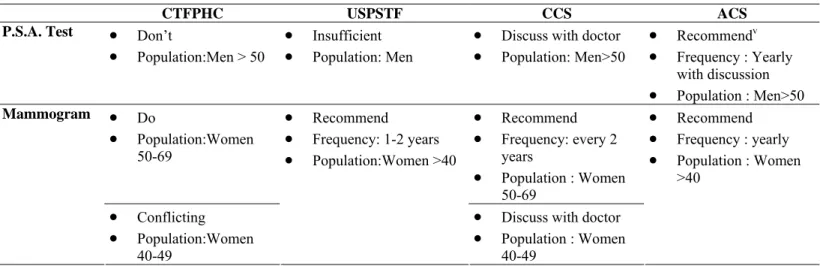
Table 1 shows the current guidelines for screening proposed by these four agencies. Note that the government agencies are less enthusiastic than the non-profit agencies regarding the benefits of PSA screening in men and mammography screening in women aged 40-49.
Table 1 - Guidelines on PSA test and mammography for screening purposes
CTFPHC USPSTF CCS ACS
P.S.A. Test • Don’t
• Population:Men > 50
• Insufficient • Population: Men
• Discuss with doctor • Population: Men>50 • Recommendv • Frequency : Yearly with discussion • Population : Men>50 • Do • Population:Women 50-69 • Recommend • Frequency: every 2 years • Population : Women 50-69 Mammogram • Conflicting • Population:Women 40-49 • Recommend • Frequency: 1-2 years • Population:Women >40
• Discuss with doctor • Population : Women 40-49 • Recommend • Frequency : yearly • Population : Women >40
It is clear from Table 1 that there is a great degree of uncertainty surrounding the use of the PSA test – the government agencies, which are usually assumed to act in the best interest of citizens, recommend against systematic screening of men using the PSA test. However, non-profit agencies such as the American Cancer Society recommend that men over 50 receive a PSA test regularly, or at least be given the option by their doctor.
Conversely, all of the government and non-profit agencies in Table 1 recommend regular mammograms for women aged 50-69. Note, however, that the Canadian agencies have some reservations about recommending mammography screening for women aged 40-49.
v For “high risk” cases. Men>50 that are of “average risk” should be offered a yearly test by their doctor.
“High risk” include African Americans and men who have a first-degree relative (father, brother or son) diagnosed with prostate cancer. For a more complete definition of “high risk” and “average risk”, see the ACS website – http://www.cancer.org
In summary, there is much uncertainty surrounding the use of the PSA test as a medical screen, little uncertainty surrounding the use of mammography as a medical screen for women aged 50-69 and some uncertainty regarding the use of mammography as a medical screen for women aged 40-49.
3 Issues surrounding PSA and mammography
screening
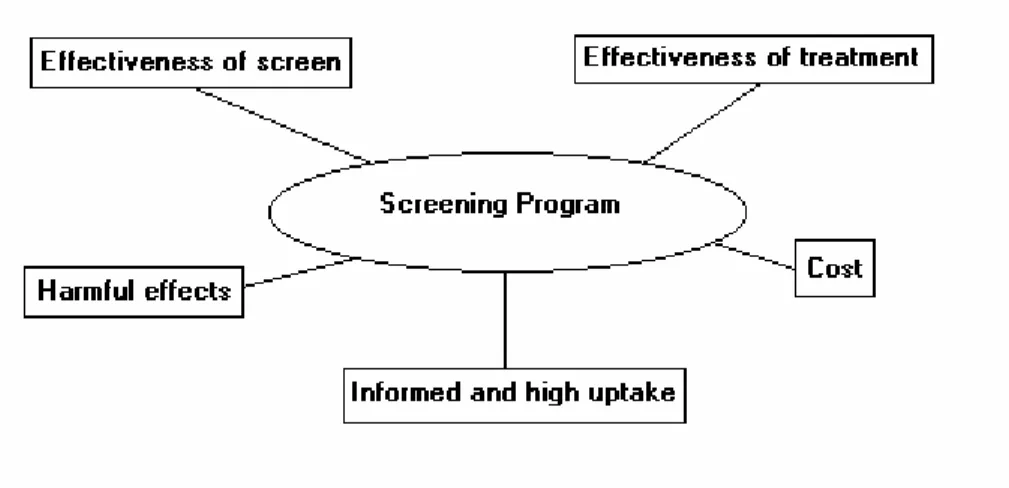
There are several factors that affect the decision whether to implement a mass screening program, as shown in Figure 1. These factors are inter-related – for example, a change in the cut-off age for mass screening using mammography, i.e. from women aged 50+ to women aged 40+, affects the financial cost of the program and the number of people exposed to possible harmful effects. In addition, the effectiveness of the screen may vary by the age of the target group.
Figure 1 – Issues surrounding screening programs
3.1.1 Effectiveness of Screening
For an effective program, the screen should be accurate, i.e. have a low rate of false positives (sensitivity) and false negatives (specificity). A false positive is when the screen identifies someone as suffering from the disease when they are in fact healthy. Conversely, a false negative is when the screen does not identify the disease when it is in fact present in the individual.
The effectiveness of PSA testing is dependent on the cut-off level between “normal” and “abnormal” results. The general consensus in the medical community is that 4 ng of PSA per ml or lower is “normal”. Surprisingly, this level was originally proposed in 1986 by a private corporation, Hybritech (now Beckman Coulter)11. This standard was later
published in the New England Journal of Medicine12; however, there seems to have been little scientific research or cost/benefit analysis is determining this cut-off. The fact that the “normal” level of PSA increases with agevi exacerbates the problem of determining the cut-off level.
A similar cut-off conundrum is present in screening for breast cancer – there is
disagreement whether mammography screening should begin at age 40 or at age 50 in women1.
Ultimately, to determine the effectiveness of a screening program, a RCT must
demonstrate improved health outcomes. This has yet to be done conclusively for both the PSA test in men and mammography in women aged 40-49.
3.1.2 Harmful effects
The cut-off levels for screening directly impact the harm caused to individuals. For example, if a new consensus was reached and a “normal” PSA reading went from 4ng/ml to 10ng/ml, then this would have a major impact on false positives and false negatives. Presumably, the rate of false positives would decrease, sparing many men the anxiety of a biopsy and potential unneeded treatment. But, the rate of false negatives would likely increase and more relevant cases of prostate cancer would avoid detection.
The rate of false-positives for PSA test results of between 4.0ng/ml and 9.9ng/ml is 88%13, i.e. only 22% of patient’s with PSA test readings between 4.0 and 9.9 ng/ml are subsequently found to have prostate cancer with a needle biopsy. The rate of false negatives, i.e. those with a PSA level of 4ng/ml or below but who are subsequently found to have prostate cancer, is up to 12.5%13. A recent influential study14 in the New England
Journal of Medicine has highlighted the issue of false negatives associated with PSA testing and concluded that “Biopsy-detected prostate cancer, including high-grade cancers, is not rare among men with PSA levels of 4.0 ng permillilitre or less”.
The harmful effects of false positives and false negatives are significant - false positives cause people a high level of anxiety, which does abate immediately even when
subsequent tests show that the disease is not present.15 If a false positive results in unnecessary treatment or surgery, then the individual is exposed to possible serious side effects such after prostate cancer surgery, such as impotence and incontinence. But the medical communityvii is generally aware that the PSA test is controversial; as such, the test is rarely used to determine if a man does or does not have prostate cancer, but rather acts as a gatekeeper for biopsies, which are required to confirm the disease. The
probability that a false positive test leads to an unnecessary biopsy is itself dependent on how the doctor uses the total PSA level provided by the test, in addition to other
information such as the patient’s age, free PSA level, PSA velocity, gland volume and digital rectal exam.
False negatives are also harmful – a man or woman who undergoes screening that does not detect his/her condition feels cheated; this can also result in potential legal action and may undermine public confidence in the screening program16.
When considering screening, it is important to consider risks not only for a single screen, but the cumulative risks for the series of tests after the recommended age. For example, women who follow the guidelines of the American Cancer Society have a 43% chance of eventually experiencing a false-positive test17. Elmore et al.18 estimated that 49% of women who undergo screening will experience at least one false-positive during ten rounds and that 19% will be subjected to an unnecessary biopsy.
normal range for a man aged 70-79 is 0-6.5 ng/ml.
3.1.3 High and informed uptake
The success of a screening movement depends on the participation of the target group. The most important factor in determining whether an individual participates in a screening program is their perception of the worth and efficacy of the program.
However, even if there was an accord by physicians and health organizations on the value of certain screening procedures, individuals may not comply with themviii - uptake is also dependent on other factors such as high anticipated or actual pain, discomfort or
embarrassment30.
The considerable uncertainty and lack of RCT evidence on the usefulness of mass screening using the PSA test in men and mammography in women (aged 40-49), has introduced an important ethical question: should doctors require informed consent from their patients before performing these tests?
Informed consent usually means a deliberate process that includes a written, as opposed to verbal, agreement. There are theoretical benefits to informed consent for both the provider and patient – the provider is somewhat protected from accusations of malpractice, which is especially important in the US19. The patient, for his part, is provided with information on the benefits and risks associated with screening and the autonomy to make his own decision, which partly solves the ethical dilemma of the physician. Informed consent requires time for the physician to explain complicated medical issues to patients – time that many busy physicians do not have20, therefore, it is usually only done in research context (i.e. new cancer trials), where the risk of adverse outcomes is relatively high because the procedure does not have an established clinical benefit; the PSA test does not yet have an established clinical benefit, however, the medical community had not deemed the risk of adverse outcomes to be “high”. This is perhaps because a biopsy is required to confirm prostate cancer after a positive PSA test.
3.1.4 Effectiveness of treatment
If there is no effective treatment for a condition, then a screening program is useless - the target group will incur major psychic costs with no benefits21. To justify a mass
screening program, the treatment must additionally be more effective when administered early. Fortunately, there are treatment programs for prostate and breast cancer, such as surgery, radiation and hormone therapy – all these treatment options are more effective when administered early.
3.1.5 Cost
Health care costs are substantial in Canada – in 2002, total health care costs were 9.6% of GDP, 70% of which was public sector spendingix. In addition to financial concerns, health spending has important political ramifications – the solvency of the public medical system is one of the highest priorities for Canadians.
Screening programs are generally large and divert scarce funds from other areas of the health care system. As such, the cost carefully examined and compared with alternatives.
4 Cost-Effectiveness Analysis in Health Economics
Cost-effectiveness analysis (CEA) is a method of comparing the relative value of various clinical strategies. Usually considered as a ratio, the cost effectiveness a procedure relates the cost of that procedure to the health benefits resulting from it. In health terms, it is often expressed as the cost per year per life saved or as the cost per quality adjusted life-year saved. It is similar to the more popular cost-benefit analysis (CBA) - the primary difference being that CBA refers to the evaluation of benefits and costs, which are both measured in monetary terms; whereas, CEA refers to the evaluation of
alternatives using their costs and effects of producing some desired outcome. Using CEA, two strategies are compared using the following ratio:
The CE ratio represents the cost of switching from the current practice to the new
strategy divided by the change in effect of switching from the current to the new practice. The lower the cost and the greater the positive change in effect, the more cost-effective is the new strategy.
The effectiveness of health interventions are usually associated with their effect on life expectancy, i.e. by how many years does a particular medical treatment or testing strategy lengthen one's life? This, however, does not take into account the quality of life that individuals derive from these additional years of life. The metric that is commonly used to incorporate quality of life into the analysis is the Quality-Adjusted Life-Year (QALY). The estimation of quality-of-life weights that reflect the satisfaction derived from various health states is required to determine the QALYs produced by a medical treatment. These weights vary for each individual; however, health service researchers have attempted to quantify these using various methods such as self-evaluation and observed behaviour.
One of the salient features of medical interventions is the presence of uncertainty. Costs can be relatively easily measured; however, the health effects are much more difficult to quantify. For example, in the case of PSA testing, prostate cancer prevalence, death rate, treatment results, mortality and the discount rate are all associated with at least some uncertainty. Variations in all or any of these variables have a major impact on the CEA analysis. To allow for this variance in possible results, most researchers use sensitivity analysis. This involves determining a reasonable range over which the parameters might vary. The most likely value is the baseline value. In cases where there is only one variable for which the value is uncertain, the process is straightforward - separate CEA analyses are performed using the baseline value, the "high" value and the "low" value. When there are several uncertain variables, the process becomes more complex. There could be many possible CEA results depending on the values of individual variables. In
such cases, simulation techniques such as Monte Carlo analyses, which randomly generate values for uncertain variables repeatedly to simulate a model, are employed.
Another challenge in performing cost-effectiveness analyses of health interventions is the modelling of the natural history of the disease. Markov models are most often used, with several health states and probabilities associated with transfer between states. A simple model is shown below:
Markov models can be made more complicated; however, they can never perfectly model the natural history of the disease because the transitions between states are discrete, whereas the transition in reality is continuous. More transition states can be added but transition probabilities become increasingly more difficult to quantify because of lack of medical evidence.
A screening program that has a favourable cost-effectiveness analysis in one country may not have one in another country due to variations in the screening interval or target population. For example, the Canadian Cancer Society recommends that women 50-69 years of age undergo a mammogram every two years, whereas the American Cancer
No Cancer
Stage 1 cancer
Stage 2 cancer
Mortality due to cancer Mortality not due to
Society recommends yearly mammograms. The cost difference associated with the screening interval could prove to be prohibitively high. Additionally, the organization of the health care system would have an effect: in Canada, user charges are not permitted, whereas they are in the US. This would also have an effect of cost and on uptake of the screening procedure.
Analyses can be performed from the societal perspective or from the individual
perspective. The vast majority of cost-effectiveness analyses are generally used to make public policy decisions; therefore, the societal perspective is most often examined. Such analyses usually ignore individual costs such as psychic costs associated with a false positive. These costs, though not quantifiable, can be very important and should also be taken into consideration, if possible.
4.1 CEA of mammography - Salzmann et al.
22Salzmann et al. performed a cost-effectiveness analysis of mammography screening programs. Previous research had shown that mass screening using mammography can be achieved at a reasonable cost for women aged 50-692324. Salzmann et al. added to the literature by performing an analysis that included women aged 40-49. Because CEA involves marginal costs and benefits, the choice of which strategies to compare affect the results of the analysis and, potentially, the conclusion. For example, a previous study performed a CEA analysis for a screening program for women aged 40-69 vs. no screening program at all25. Most of the benefits of this program may have accrued to women aged 50-69 and not those aged 40-49; therefore, the question of whether
screening women aged 40-49 was not properly addressed. Other analyses have examined the incremental benefits for women aged 40-4926 – their methodology is similar to that of Salzmann et al. Salzmann et al. used a Markov model that examined women undergoing the following breast cancer screening strategies:
1. No screening.
3. Screeningevery 18 months from 40 to 49 years of age, followed by screening biennially from 50 to 69 years of age.
Using information derived from the medical literature on the benefits, costs and mortality rates, Salzmann et al. found the cost-effectivenessof screening 50- to 69-year-old women to be $21,400 per yearof life saved and the incremental cost-effectiveness of screening 40- to 49-year-old women to be $105,000 per year of life saved. They noted that the choice of discount rate had a considerable effect on cost-effectiveness ratios – an increase in discount rate alters the CEA ratio because it reflects the lower economic value of an expense that is delayed and the higher value of a benefit that is realized sooner.
It is also interesting to examine the disaggregated benefits - If 10000 40-year-old women did not undergo screeningmammography at all, 308 would die of breast cancer by 80 yearsof age. A total of 3546 would die of other causes.A biennial screening
mammography program applied to this cohortfrom 50 to 69 years of age would avert 37 deaths; 52 deathsfrom breast cancer would be prevented, but 15 of these womenwould die of other causes by 80 years of age. Expanding thescreening program to include every-18-month screening for 40-to 49-year-old women would avert an additional 4 deaths (fora total of 41); 6 deaths from breast cancer would be prevented,but 2 of these women would die of another cause by 80 yearsof age.
4.2 CEA of PSA test - Ross et al.
27Although studies do exist on the cost-effectiveness of screening using the PSA test, the value of such studies is questionable because the benefits of prostate cancer screening have not yet been proved or quantified. Ross et al. performed a Monte Carlo analysis on a Markov model to determine the cost-effectiveness of various PSA screening strategies. They determined that rather than starting a screening strategy at age 50, a more cost-effective program would start at an earlier age but screen biennially instead of annually. But, because the results of the RCTs of the PSA test are not yet available, this study is susceptible to biases described in Section 1.3 and, furthermore, they cannot conclude that this strategy is better than no strategy at all.
5 Previous Research on Determinants of Screening
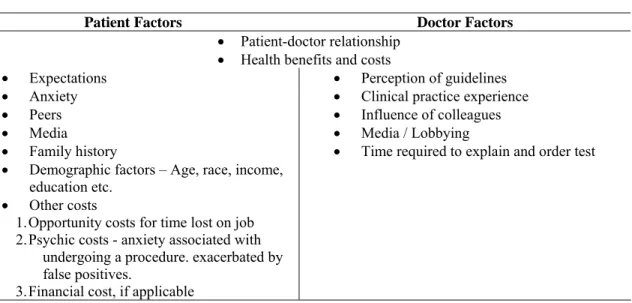
Patient and doctor factors that affect the decision to undergo screening are listed in Table 2. It is difficult to empirically examine some of the determinants - for example, it is impossible to quantify the effect of the media on the decision for individuals to undergo a PSA test or mammography.
Table 2 – Determinants of decision to undergo screening
Patient Factors Doctor Factors
• Patient-doctor relationship • Health benefits and costs
• Expectations • Perception of guidelines
• Anxiety • Clinical practice experience
• Peers • Influence of colleagues
• Media • Media / Lobbying
• Family history • Time required to explain and order test
• Demographic factors – Age, race, income, education etc.
• Other costs
1. Opportunity costs for time lost on job 2. Psychic costs - anxiety associated with
undergoing a procedure. exacerbated by false positives.
3. Financial cost, if applicable
Below are some of the findings of previous analyses on the determinants of undergoing screening.
Health benefits and costs – Both the patient and doctor are attempting to maximize the benefits associated with medical screening. This may or may not increase the use of medical screens, depending on the risks associated with screening and the evidence that screening improves health outcomes. The funding agency is also concerned with
maximizing benefits, but it is also attempting to minimize costs. This may either increase screening to reduce long-run costs or it may reduce unnecessary screening.
Patient-doctor relationship43 – It has been shown that a good patient-doctor relationship can lead to fewer medical screens.
Expectations28 – An individual’s perceptions and knowledge of the condition as well as the nature and consequences of the screening process affect uptake. Individual
perceptions of risk may be biased29, which results in too much or too little demand for screening.
Anxiety - Low-perceived need and unpleasantness of the procedure reduce uptake of screening30.
Peers31 - Personal experience of the disease via friends and family increase uptake. Media – The media plays an important part increasing awareness of cancer and screening options.
Family History32 – As with all cancers, genetic predisposition is a significant determinant of risk. People who have a family history of prostate or breast cancer derive higher expected benefits from P.S.A. tests and mammograms than the general population. Race33 – For prostate cancer, men of African descent are at a higher risk than the general population. For breast cancer, Ashkenazi Jews are at higher risk. As with family history, it is reasonable to expect that people who derive the most benefit from screening would be more likely to undergo such tests.
Income / Economic Status34 – Sensitivity to monetary and time costs is dependent on an individual’s economic status.
Education35 – Individuals with more education may be better informed on the potential benefits and drawbacks to screening.
Employment status36 – Individuals who work have a higher opportunity cost of going to the doctor than retired or stay-at-home people.
Intrinsic utilization37 – People use varying amounts of health care. Even in Canada,
where health care is free (with some exceptions) and readily available; some people choose to not use the health care system, whereas others are high users.
Expected longevity38 – Expected longevity has positive effects on demand for some medical screens.
Age6 – The utility associated with health care may vary with age.
Healthy behaviour39 – There are people who engage in healthy habits, such as regular exercise, a balanced diet and non-smoking. Such people, who are especially health conscious, may be more likely to undergo medical screens.
Health Status42 – Rehabilitation and treatment may be more difficult for people that are already sick, therefore, they have may have a higher cost to getting other diseases and may be more likely to engage in medical screening. Additionally, such people have regular contact with health professionals, who might include medical screens in the course of treatment for an unrelated condition. Conversely, people that are already sick may have physical limitations and thus less likely to visit their doctor for medical screens.
Time costs40 - Limited access to transportation or not being able to take time off work affects the uptake of screening.
5.1 Review of empirical evidence – Jepson et al.
41Jepson et al. provide a review of the empirical literature on the determinants for screening uptake. They reviewed four studies (two “controlled” trials and two cohorts) that
examined screening tests for prostate cancer. The four studies were published from 1993-1998 and were done in the USA. All four studies examined the DRE; two of the four additionally examined the PSA test. Three of the studies examined primarily African-American men. Although the studies are far from perfectx, their conclusions are nonetheless worth examining. They are shown in Table 3:
Table 3 – Determinants of PSA screening
Category Determinant Studies in which
found significant at 5% level
Individuals with the following determinants are more likely to attend screening
Socio-Demographic Having higher level of education 2/3 studies
Being older than 65 years 1/4 studies Individuals with the following determinants are less likely to attend screening
Socio-Demographic Being African-American 2/3 studies
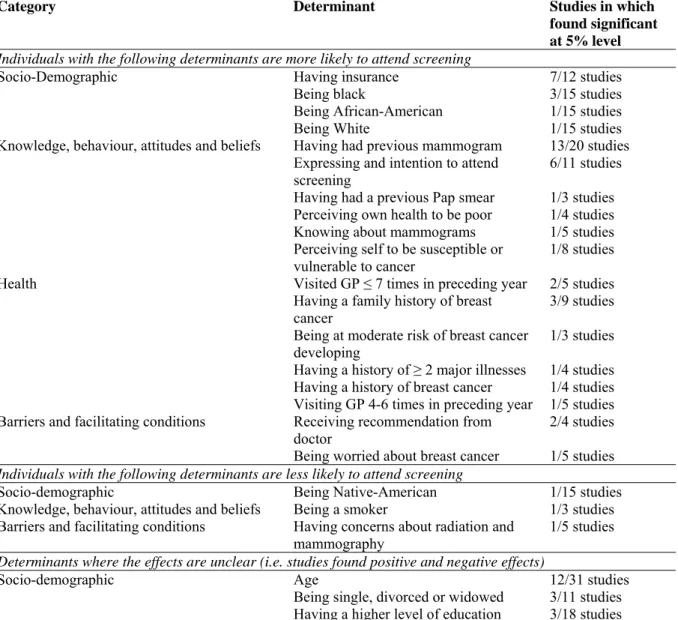
Jepson et al. also examined 34 breast cancer screening studies (16 RCTs, four controlled trials, four quasi-RCT studies, nine cohorts and one case-control study). 19 of the studies were published from1995-2000 and 15 were published before 1994. 29 of the studies were done in the USA, two in the U.K., two in Australia and one in Italy. One of the studies examined physician factors while the rest examined patient factors. The studies
were carried out by a variety of organizations – health maintenance organizations (HMOs), primary-care practices, community screening programmes, hospitals,
universities and other organizations. 16 of the 34 studies included women aged 40-49; eight studied only women aged 50+; three of the studies targeted only women aged 60+.
The determinants of whether a women participates in mammography screening are shown in Table 4:
Table 4 – Determinants of mammography screening
Category Determinant Studies in which
found significant at 5% level
Individuals with the following determinants are more likely to attend screening
Socio-Demographic Having insurance 7/12 studies
Being black 3/15 studies
Being African-American 1/15 studies
Being White 1/15 studies
Knowledge, behaviour, attitudes and beliefs Having had previous mammogram 13/20 studies Expressing and intention to attend
screening 6/11 studies
Having had a previous Pap smear 1/3 studies Perceiving own health to be poor 1/4 studies
Knowing about mammograms 1/5 studies
Perceiving self to be susceptible or vulnerable to cancer
1/8 studies
Health Visited GP ≤ 7 times in preceding year 2/5 studies
Having a family history of breast
cancer 3/9 studies
Being at moderate risk of breast cancer
developing 1/3 studies
Having a history of ≥ 2 major illnesses 1/4 studies Having a history of breast cancer 1/4 studies Visiting GP 4-6 times in preceding year 1/5 studies Barriers and facilitating conditions Receiving recommendation from
doctor 2/4 studies
Being worried about breast cancer 1/5 studies Individuals with the following determinants are less likely to attend screening
Socio-demographic Being Native-American 1/15 studies
Knowledge, behaviour, attitudes and beliefs Being a smoker 1/3 studies Barriers and facilitating conditions Having concerns about radiation and
mammography 1/5 studies
Determinants where the effects are unclear (i.e. studies found positive and negative effects)
Socio-demographic Age 12/31 studies
Being single, divorced or widowed 3/11 studies Having a higher level of education 3/18 studies
5.2 Sickness - Wu
42Wu [2003] analyzes the relationship between health status and the likelihood of engaging in medical screening and other preventative behaviour, in particular flu shots, cholesterol checks, mammograms, breast examinations and prostate examinations.
Wu uses two independent datasets – the Health and Retirement Studyxi and the Medical Expenditure Panel Surveyxii, restricted to individuals aged 40-70.
5.2.1 Results
Wu found that people with higher education, higher incomes and insurance coverage are more likely to engage in these screens and preventative measures. Preventative
behaviour is also positively related to age and the number of doctor’s office visits in the last year. Wu also finds that blacks are more likely to have mammograms.
As noted before, this article is particularly interested in the relationship between health status and the likelihood of receiving medical screens. To examine this relationship, Wu uses several different measures of health status – self-reported health, and index of limitations in activities of daily living (ADLs) and specific medical conditions such as heart disease, lung disease and diabetes.
Initially, Wu created a binary variable, “sick” to be 1 if an individual reported their health as being either fair or poor. The probit coefficients imply that being in fair or poor health decreases the probability of getting a mammogram by 4 percentage points and decreases the probability of getting a prostate examination by 7 percentage points (coefficients significant at 5% level). This demonstrates that even after controlling for other determinants, health status is a significant predictor of screening.
Wu puts forth several reasons why those in poorer health would be less inclined to engage in mammography and prostate examinations, including: sicker people avoid
xi Conducted by University of Michigan Institute for Social Research, http://www.isr.umich.edu/ xii Conducted by the Agency for Healthcare Research and Quality (AHRQ), http://www.ahcpr.gov/
screening because they are more afraid about learning about yet another condition or that sick people may discount the future more than healthy people. To further study these hypotheses, Wu examines the relationship between getting screens and expectations of the future. The HRS asked several questions that determined an individual’s degree of pessimismxiii. When controlling for pessimism, Wu finds that poor health decreases the likelihood of women having monthly breast examinations and men having prostate checks only for people who have pessimistic expectations of the future. This suggests that psychological factors may be an important pathway on how sickness decreases the probability of undergoing screening.
5.3 The Physician’s perspective - Tudiver et al.
43Most analyses, only take into account the patient’s characteristics. In medical decision making, however, variables associated with the doctor, such as beliefs, knowledge and attitudes is equally, if not more important. Tudiver et al., using a survey of Canadian physicians, examined physician practices when the guidelines for screening procedures are uncertain. Tudiver et al. defined an “unclear” guideline as one having a C
recommendation (insufficient evidence to recommend) from the Canadian Task Force on Preventative Health Care (CTFPHC). A “conflicting” guideline was one for which there were different recommendations from at least 2 different organizations for the same procedure. PSA test and mammography are two such procedures that have unclear and conflicting guidelines.
The survey of physicians was done using a 2-part questionnaire: the first part asked a series of questions on physicians’ perceptions of guidelines and the second part described a series of clinical case vignettes. These vignettes described hypothetical patients, along with their symptoms, attitudes, demographic features and expectations. Based on this information, a physician decided whether to order the medical screen or not. A sample of a clinical case vignette provided by Tudiver et al. is in Appendix B.
xiii Questions include “What do you think the chances are that the US economy will exhibit a major
depression sometime in the next 10 years or so?” Wu claims that there is evidence for a correlation between indices of pessimism, in this case pessimism about the economy and pessimism about health.
Table 5 shows that the physician responses to part 1 of the questionnaire were in line with the CTFPHC task force, i.e. a majority believed that the guidelines were conflicting were PSA screening and mammography screening for women aged 40-49.
Table 5 – Physician perceptions of guideline recommendations
Physician’s perception of guideline (%)
Screening Test Recommend
to screen Recommend to not screen No clear recommendation Feels guidelines are conflicting
PSA for Men >50xiv 17.9 45.0 37.0 86.6
Mammogram for
Women 40-49xv
25.4 51.0 23.6 67.5
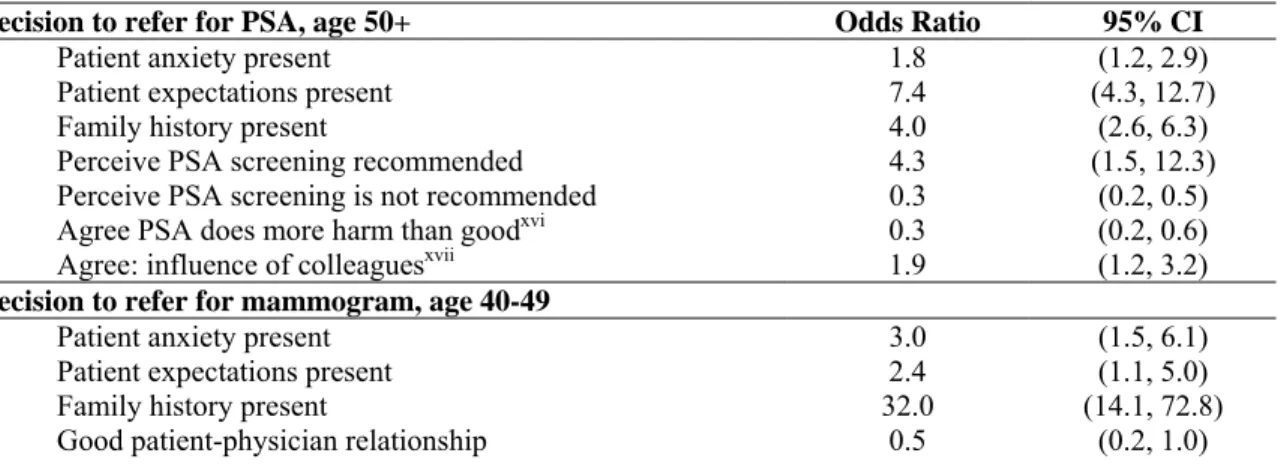
Table 6 shows that factors such as patient anxiety and expectations and family history all had a significant impact on the odds that a physician would recommend a PSA test or mammogram. The impact of family history was very significant for mammography. It is also interesting to note that a good patient-physician relationship halved the odds of a mammogram being ordered for women aged 40-49. Tudiver et al. hypothesize that “in a good patient-physician relationship, patient and physician are more likely to discuss the pros and cons of a conflicting screening guideline and to find common ground than when the relationship is poor.” However, this phenomenon is not seen in men vis-à-vis the PSA test. Tudiver et al. conclude that this may “due to the unique character of the relationship male patients have with their physicians.”
Table 6 – Determinants of physician decision to refer for medical screens
Decision to refer for PSA, age 50+ Odds Ratio 95% CI
Patient anxiety present 1.8 (1.2, 2.9)
Patient expectations present 7.4 (4.3, 12.7)
Family history present 4.0 (2.6, 6.3)
Perceive PSA screening recommended 4.3 (1.5, 12.3)
Perceive PSA screening is not recommended 0.3 (0.2, 0.5)
Agree PSA does more harm than goodxvi 0.3 (0.2, 0.6)
Agree: influence of colleaguesxvii 1.9 (1.2, 3.2)
Decision to refer for mammogram, age 40-49
Patient anxiety present 3.0 (1.5, 6.1)
Patient expectations present 2.4 (1.1, 5.0)
Family history present 32.0 (14.1, 72.8)
Good patient-physician relationship 0.5 (0.2, 1.0)
xiv As shown in Table 1, the CTFPHC recommends to not perform.
xv As shown in Table 1, the CTFPHC cites insufficient evidence and makes no recommendation. xvi Reference group: those who disagree that screening test causes more harm than good.
xvii Reference group: those who disagree that practice of colleagues influence decision to order screening
Perceive mammography recommended 3.0 (1.1, 8.0)
Perceive mammography is not recommended 0.5 (0.1, 0.6)
Agree mammography does more harm than goodxvi 0.5 (0.2, 1.0)
Agree: influence of colleaguesxvii 2.5 (1.2, 5.1)
In addition, physician factors are very important in the decision to screen: the physician’s perception of the recommendation of the test, the perception of harm and the influence of colleagues all had a significant effect.
Perhaps most importantly, the results of Table 6 show that physicians are strongly influenced by the practices of their colleagues; Tudiver et al. note that social influences play an important role in influencing screening decisions, particularly when uncertainty is high.
6 Determinants of PSA test and mammography use
6.1 Data and Empirical Strategy
The data source used to analyze the determinants of undergoing medical screens is the Canadian Community Health Survey, Cycle 1.1. The CCHS is a nationally
representative, cross-sectional survey of approximately 133,300 people. The survey is weighted, stratified and clustered. More information on the CCHS and method of collection is in Appendix D.
6.2 Results and Analysis
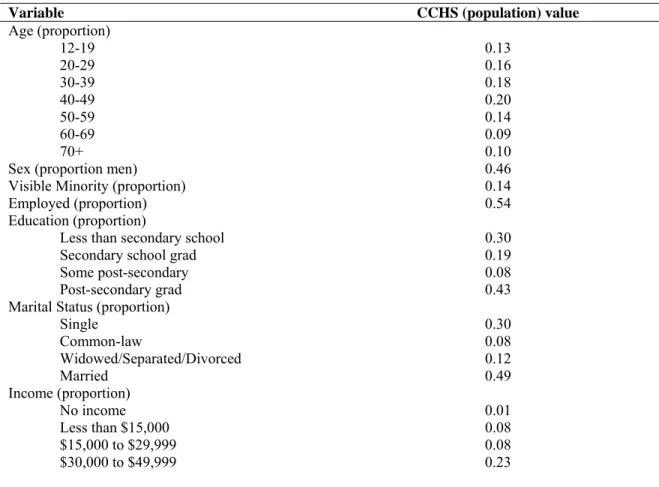
Table 7 summarizes the basic demographic information for the CCHS sample. Only approximately one third of men over 40 had a PSA test in the last 12 months and one third of women over 35 have had a mammogram in the last 12 months. Almost half of respondents were married. Slightly over half of respondents were employed.
Table 7 – Summary statistics
Variable CCHS (population) value
Age (proportion) 12-19 0.13 20-29 0.16 30-39 0.18 40-49 0.20 50-59 0.14 60-69 0.09 70+ 0.10
Sex (proportion men) 0.46
Visible Minority (proportion) 0.14
Employed (proportion) 0.54
Education (proportion)
Less than secondary school 0.30
Secondary school grad 0.19
Some post-secondary 0.08
Post-secondary grad 0.43
Marital Status (proportion)
Single 0.30 Common-law 0.08 Widowed/Separated/Divorced 0.12 Married 0.49 Income (proportion) No income 0.01 Less than $15,000 0.08 $15,000 to $29,999 0.08 $30,000 to $49,999 0.23
$50,000 to $79,999 0.28
$80,000 + 0.25
Mean # visits to G.P. in last 12 months 3.25
Proportion Engaging In (last 12 months):
P.S.A. Test (Men>40) 0.32
Mammogram (Women>35) 0.33
N 25,787,334 (survey: 130880)
Some of the variables in Table 7, such as number of visits in the last 12 months and employment status, are time-dependent. Therefore, I examined not only the determinants for use of those who have undergone a PSA test or mammogram ever in their life, but also those who have demanded one of these screens in the last 12 months. This also provides some insight on whether individuals adhere to recommendations provided by organizations such as the American Cancer Society to undergo these screens on an annual basis.
Table 8 provides a first look at the relationship between screening and several predictors. Not all of the relationships are monotonic; however, it is evident that the likelihood of undergoing a PSA test or mammography increases with the number of doctor visits, age, and sickness. However, the relationship of these medical screens with education and income is uncertain.
There are a few figures that are peculiar: 9% of men report having a PSA test in the past year without having a doctor’s visit. This result is perhaps due to men having urologist appointments scheduled for several months after their GP’s recommendation. This may also partly explain the 15% of women who report having a mammogram in the last year without having a doctor’s visit. Additionally, free-standing mammography clinics have become more widespread in the past several years in Canada, which may be captured in this result.
Fewer than half of men aged 50-69 had a PSA test in the last 12 months. This may reflect awareness of the uncertainty surrounding PSA screening, in addition to other predictors. Only slightly more than half of women are following current guidelines by the CTFPHC and Canadian Cancer Society, i.e. they have had a mammogram in the last
12 months. This shows that despite public awareness of breast cancer and mammography screening, uptake is far below target levels.
Table 8 – Cross-tabs of screening and several predictors
PSA ever PSA last
year
Mammogram ever
Mammogram last year # doc visits last year
0 0.23 0.09 0.48 0.15 1 0.43 0.31 0.61 0.31 2 0.47 0.37 0.66 0.35 3 0.49 0.38 0.69 0.38 4 0.55 0.44 0.72 0.40 5-9 0.55 0.43 0.71 0.40 10-19 0.57 0.43 0.69 0.39 20+ 0.55 0.43 0.69 0.37 Age 40-49 0.20 0.13 0.55 0.27 50-59 0.50 0.36 0.86 0.52 60-69 0.63 0.49 0.88 0.50 70+ 0.67 0.49 0.73 0.30 Self-perceived health Excellent 0.39 0.28 0.57 0.30 Very good 0.43 0.31 0.63 0.33 Good 0.44 0.32 0.68 0.35 Fair 0.50 0.37 0.72 0.36 Poor 0.55 0.42 0.70 0.35 Education
Less than High School 0.48 0.66 0.69 0.34
High School grad 0.39 0.71 0.63 0.33
Some post-secondary 0.44 0.69 0.65 0.32 Post-secondary grad 0.42 0.69 0.62 0.33 Income No income 0.64 0.49 0.73 0.38 Less than $15,000 0.38 0.25 0.65 0.29 $15,000 to $29,999 0.46 0.32 0.67 0.32 $30,000 to $49,999 0.45 0.33 0.66 0.35 $50,000 to $79,999 0.42 0.31 0.62 0.34 $80,000 + 0.42 0.30 0.60 0.34
To further explore the relationship between the probability of undergoing a PSA test or mammogram and various determinants, a probit regression was performed where the binary dependent variable was the use of the medical screen; the dependent variable took the value ‘0’ if the individual had not undergone the PSA test or mammography and ‘1’ if they had. The explanatory variables included socio-economic, geographic, health status and education. The coefficients are shown in Table 9; a full list of the explanatory variables and the econometric method is provided in Appendix C.
The two most consistent predictors of PSA screening among men aged 40 or older are age and number of medical consultations in the last 12 months. Men in their 50s, 60s, and older are much more likely to undergo a PSA test. The probability of undergoing a PSA test increases with the number of medical consultations but the incremental increase after 2 visits is negligible. Additionally, men who describe themselves in poor or fair health are less likely to undergo a PSA test. Visible minorities are also less likely than white men to have had a PSA test. The probability of PSA test use was significantly higher for those men in the top two income quartiles. Married men and men in common-law relationships were also more likely to have had a PSA test. There were only minor differences in the predictors of men undergoing a PSA test in the last 12 months vs. men undergoing a PSA test ever in their life, as shown in Appendix C. Men in Manitoba and New Brunswick were, ceteris paribus, the most likely to undergo a PSA test, whereas those in the Yukon were the least likely, even when controlling for health region
idiosyncrasies. At the time of the CCHS survey, provinces were not consistent in funding of PSA tests - British Columbia and Alberta did not fund the test unless the patient had noticeable symptoms, whereas Manitoba and some other provinces funded the test unconditionallyxviii. Although men in Manitoba and New Brunswick, two of the provinces that fully funded PSA testing for men over 50, had a significantly higher probability of undergoing a PSA test, it is difficult to conclude that provincial funding strategies had significant impact on probability of undergoing a PSA test.
As shown in Table 9, for women over 35, the two most consistent predictors of
undergoing a mammogram were age and number of medical consultations in the last 12 months. Women aged 35-40 were significantly less likely and women in their 50s and 60s were significantly more likely to have a mammogram than women in their 40s. The probability of undergoing a mammogram increases with number of medical visits; however, it levels off after 4 visits. Married women were more likely to have had a mammogram. Women residing in the Yukon were significantly less likely to have a mammogram. Results were generally the same for the probability of having a
mammogram in the last year vs. the probability of ever having a mammogram; the only
exceptions were education and income - the probability increased with income and education; however, the coefficients were generally only significant for the probability of ever having a mammogram, and not the probability of having a mammogram in the last year.
Table 9 – Coefficients of probit regressions
Variable Mammogram last
year
Mammogram last year aged 40-49
PSA test last year Age 35-40 -0.75* 40-49 (omitted) 50-59 0.68* 0.76* 60-69 0.67* 1.04* 70+ 0.35* 1.17* Sick -0.09* 0.07 -0.15*
Health Utility Index 0.11 0.14 0.04
Visible Minority 0.02 0.04 -0.18*
Immigrant 0.04 0.05 -0.06
Not Employed 0.01 0.03 0.06
Education Less than secondary school
(omitted)
Secondary school grad 0.05 0.10 0.00
Some post-secondary 0.07 0.16 0.00 Post-secondary grad 0.10* 0.12 0.03 Marital Status Single (omitted) Married 0.17* 0.21* 0.19* Common-law 0.01 0.02 0.16* Widowed/Separated/Divorced 0.05 0.07 -0.03 Income 1st Quartile (omitted) 2nd Quartile -0.05 -0.20* 0.08 3rd Quartile 0.08 0.05 0.27* 4th Quartile 0.08 0.08 0.34*
# medical consultations in last 12 months 0 (omitted) 1 0.65* 0.68* 0.89* 2 0.83* 0.86* 1.12* 3 0.93* 0.98* 1.08* 4 1.02* 1.14* 1.11* 5-9 0.97* 1.10* 1.24* 10-19 1.05* 1.18* 1.18* 20+ 1.12* 1.19* 1.46* Province B.C. (omitted) Alberta -0.02 -0.04 -0.12 Saskatchewan -0.05 -0.38* 0.03 Manitoba -0.05 -0.29* 0.27* Ontario -0.02 -0.22* 0.15
Quebec -0.07 -0.30* 0.05 New Brunswick 0.05 -0.10 0.24* Nova Scotia 0.12 0.13 0.15 Newfoundland -0.18 -0.24 -0.16 P.E.I. 0.02 0.09 0.16 Yukon -0.28* -0.46* -0.34*
Health Region Group
Group A -0.04 -0.04 -0.19 Group B -0.03 -0.11 -0.09 Group C (omitted) Group D -0.07 0.02 -0.11 Group E -0.08 -0.15 -0.26* Group F -0.05 0.01 0.03 Group G -0.16* -0.29* -0.27* Group H -0.06 -0.10 -0.15 Group I -0.09 -0.09 -0.22* Group J -0.02 -0.10 -0.22* Constant -1.68* -1.65* -2.37*
Note: * - significant at 5% level.
As mentioned earlier, both PSA testing in men and mammography for women aged 40-49 is surrounded with much uncertainty. Therefore, a probit regression was performed for women aged 40-49 to analyze the determinants of uptake of mammography. Unlike the predictors of mammography for women aged over 35 years, self-reported poor health was a not a significant factor in predicting uptake for women aged 40-49. On the other hand, women aged 40-49 in the lower-middle income quartile were significantly less likely to have had a mammogram in the last year than women in the lowest income quartile.
Additionally, women aged 40-49 who resided in Saskatchewan, Manitoba, Ontario, Quebec or Yukon were significantly less likely to have had a mammogram in the last year than were women in British Columbia.
7 Conclusions
This paper has shown that the rate and determinants of uptake of medical screens depend on the uncertainty surrounding the procedure. The rate of uptake for mammography of women aged 50-59, a screen with relatively low uncertainty, was much higher that the rates of uptake for mammography for women aged 40-49 and PSA testing in men.
The significant determinants of uptake of PSA tests by men over 40 are age, self-reported health, being a member of a visible minority, marital status, income, number of doctor visits and geographic location. The significant determinants of uptake of mammography for women over 35 are age, self-reported health, education, marital status, number of doctor visits and health region group. Income and province of residence were also significant determinants for women aged 40-49.
These results for the Canadian population have confirmed the findings of earlier analyses. Wu42 found that health status was a strong determinant of who undergoes screening. This study found that the probability of undergoing a PSA test or a mammogram in the last year were significantly reduced if the individual’s self-reported health status was ‘poor’ or ‘fair’. The findings of this paper were also broadly similar to those of Ruffin et al.37
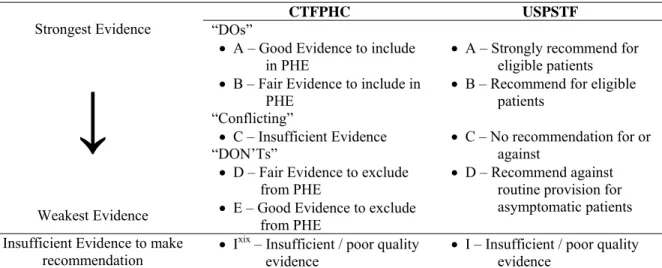
8 Appendix A – CTFPHC and USPSTF ranking
Table 10 - Ranking methodology of CTFPHC and USPSTF
CTFPHC USPSTF
“DOs”
• A – Good Evidence to include in PHE
• B – Fair Evidence to include in PHE “Conflicting” • C – Insufficient Evidence Strongest Evidence
↓
Weakest Evidence “DON’Ts”• D – Fair Evidence to exclude from PHE
• E – Good Evidence to exclude from PHE
• A – Strongly recommend for eligible patients • B – Recommend for eligible
patients
• C – No recommendation for or against
• D – Recommend against routine provision for asymptomatic patients Insufficient Evidence to make
recommendation • I
xix – Insufficient / poor quality
evidence
• I – Insufficient / poor quality evidence
9 Appendix B – Sample vignette
xix The CTFPHC recently replaced the ‘C’ recommendation with the ‘I’ recommendation; however, the
10 Appendix C – Full Probit results
A probit model was used to examine the determinants of use of the PSA test and mammography. The specification of the probit model is as follows:
P (y=1 | x) = G (β0 + xβ)
where G(z) = φ (z) ≡ ∫ φ (v) δv and φ (z) = (2π)-1/2exp(-z2/2) with 0 ≤ (y=1 | x) ≤ 1
The following four probit regressions were performed: 1. P (PSA_ever=1 | x) = G (β0 + xβ)
2. P (PSA_1yr=1 | x) = G (β0 + xβ)
3. P (mamm_ever=1 | x) = G (β0 + xβ)
4. P (mamm_1yr=1 | x) = G (β0 + xβ)
The same vector of explanatory variables, x, was used for all regressions. A full description of the variables is provided in Appendix C.
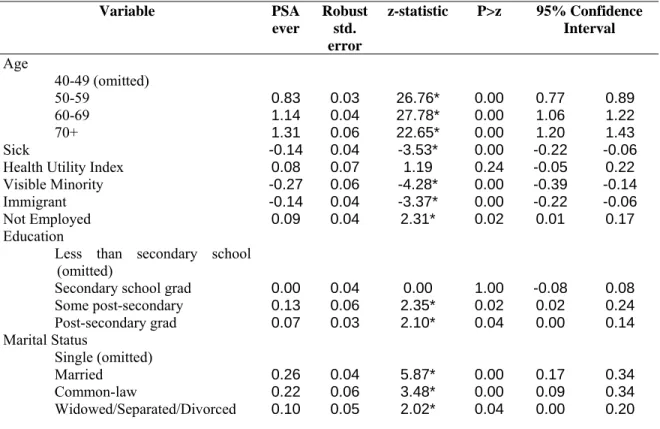
The following tables present the full results of the probit estimations.
Table 11 – Probit results for determinants of use of PSA test (ever) Variable PSA ever Robust std. error z-statistic P>z 95% Confidence Interval Age 40-49 (omitted) 50-59 0.83 0.03 26.76* 0.00 0.77 0.89 60-69 1.14 0.04 27.78* 0.00 1.06 1.22 70+ 1.31 0.06 22.65* 0.00 1.20 1.43 Sick -0.14 0.04 -3.53* 0.00 -0.22 -0.06
Health Utility Index 0.08 0.07 1.19 0.24 -0.05 0.22
Visible Minority -0.27 0.06 -4.28* 0.00 -0.39 -0.14
Immigrant -0.14 0.04 -3.37* 0.00 -0.22 -0.06
Not Employed 0.09 0.04 2.31* 0.02 0.01 0.17
Education Less than secondary school
(omitted)
Secondary school grad 0.00 0.04 0.00 1.00 -0.08 0.08
Some post-secondary 0.13 0.06 2.35* 0.02 0.02 0.24 Post-secondary grad 0.07 0.03 2.10* 0.04 0.00 0.14 Marital Status Single (omitted) Married 0.26 0.04 5.87* 0.00 0.17 0.34 Common-law 0.22 0.06 3.48* 0.00 0.09 0.34 Widowed/Separated/Divorced 0.10 0.05 2.02* 0.04 0.00 0.20
Income 1st Quartile (omitted) 2nd Quartile 0.00 0.05 0.08 0.93 -0.10 0.11 3rd Quartile 0.22 0.05 4.27* 0.00 0.12 0.32 4th Quartile 0.30 0.06 5.33* 0.00 0.19 0.40 # medical consultations in last 12
months 0 (omitted) 1 0.50 0.04 11.86* 0.00 0.42 0.58 2 0.62 0.05 13.67* 0.00 0.53 0.70 3 0.64 0.05 12.88* 0.00 0.54 0.74 4 0.68 0.05 12.99* 0.00 0.58 0.79 5-9 0.74 0.05 16.10* 0.00 0.65 0.83 10-19 0.76 0.06 13.07* 0.00 0.65 0.88 20+ 1.05 0.09 12.04* 0.00 0.88 1.22 Province B.C. (omitted) Alberta -0.20 0.07 -2.80* 0.01 -0.34 -0.06 Saskatchewan -0.07 0.08 -0.86 0.39 -0.23 0.09 Manitoba 0.15 0.08 1.75 0.08 -0.02 0.31 Ontario 0.10 0.07 1.52 0.13 -0.03 0.23 Quebec -0.03 0.08 -0.41 0.68 -0.18 0.12 New Brunswick 0.18 0.09 2.06* 0.04 0.01 0.34 Nova Scotia 0.08 0.09 0.89 0.37 -0.09 0.25 Newfoundland -0.19 0.10 -1.86 0.06 -0.40 0.01 P.E.I. 0.05 0.11 0.50 0.62 -0.16 0.26 Yukon -0.30 0.10 -2.91* 0.00 -0.50 -0.10
Health Region Group
Group A -0.15 0.09 -1.78 0.08 -0.32 0.02 Group B -0.12 0.07 -1.65 0.10 -0.27 0.02 Group C (omitted) Group D -0.14 0.10 -1.38 0.17 -0.34 0.06 Group E -0.24 0.09 -2.51* 0.01 -0.42 -0.05 Group F -0.02 0.07 -0.35 0.73 -0.15 0.10 Group G -0.23 0.08 -2.76* 0.01 -0.39 -0.07 Group H -0.13 0.09 -1.51 0.13 -0.30 0.04 Group I -0.21 0.08 -2.57* 0.01 -0.37 -0.05 Group J -0.18 0.08 -2.11* 0.04 -0.34 -0.01 Constant -1.69 0.10 -17.19* 0.00 -1.89 -1.50
Note: * - significant at 5% level.
Table 12 - Probit results for determinants of use of PSA test (last year) Variable PSA last yr Robust std. error z-statistic P>z 95% Confidence Interval Age 40-49 (omitted) 50-59 0.76 0.03 22.91* 0.00 0.70 0.83 60-69 1.04 0.04 24.46* 0.00 0.95 1.12 70+ 1.17 0.06 19.87* 0.00 1.05 1.28 Sick -0.15 0.04 -3.51* 0.00 -0.23 -0.06
Health Utility Index 0.04 0.07 0.54 0.59 -0.11 0.18
Visible Minority -0.18 0.06 -2.84* 0.00 -0.31 -0.06
Immigrant -0.06 0.04 -1.47 0.14 -0.14 0.02
Education Less than secondary school
(omitted)
Secondary school grad 0.00 0.04 0.01 0.99 -0.08 0.08
Some post-secondary 0.00 0.06 0.02 0.99 -0.11 0.12 Post-secondary grad 0.03 0.03 0.89 0.38 -0.04 0.10 Marital Status Single (omitted) Married 0.19 0.05 3.85* 0.00 0.09 0.28 Common-law 0.16 0.07 2.34* 0.02 0.03 0.30 Widowed/Separated/Divorced -0.03 0.06 -0.50 0.62 -0.14 0.08 Income 1st Quartile (omitted) 2nd Quartile 0.08 0.06 1.44 0.15 -0.03 0.19 3rd Quartile 0.27 0.05 4.96* 0.00 0.16 0.37 4th Quartile 0.34 0.06 5.90* 0.00 0.23 0.46 # medical consultations in last 12
months 0 (omitted) 1 0.89 0.05 17.23* 0.00 0.79 0.99 2 1.12 0.05 20.76* 0.00 1.01 1.22 3 1.08 0.06 18.53* 0.00 0.96 1.19 4 1.11 0.06 18.33* 0.00 0.99 1.23 5-9 1.24 0.05 22.80* 0.00 1.13 1.35 10-19 1.18 0.06 18.48* 0.00 1.05 1.30 20+ 1.46 0.09 15.47* 0.00 1.27 1.64 Province B.C. (omitted) Alberta -0.12 0.08 -1.50 0.13 -0.27 0.03 Saskatchewan 0.03 0.09 0.31 0.76 -0.15 0.20 Manitoba 0.27 0.09 2.98* 0.00 0.09 0.44 Ontario 0.15 0.07 2.08* 0.04 0.01 0.28 Quebec 0.05 0.08 0.63 0.53 -0.11 0.21 New Brunswick 0.24 0.09 2.67* 0.01 0.06 0.42 Nova Scotia 0.15 0.09 1.64 0.10 -0.03 0.34 Newfoundland -0.16 0.11 -1.49 0.14 -0.38 0.05 P.E.I. 0.16 0.12 1.28 0.20 -0.08 0.40 Yukon -0.34 0.11 -3.03* 0.00 -0.55 -0.12
Health Region Group
Group A -0.19 0.09 -2.06* 0.04 -0.36 -0.01 Group B -0.09 0.08 -1.14 0.25 -0.24 0.06 Group C (omitted) Group D -0.11 0.11 -1.01 0.31 -0.32 0.10 Group E -0.26 0.10 -2.68* 0.01 -0.46 -0.07 Group F 0.03 0.07 0.37 0.71 -0.11 0.16 Group G -0.27 0.09 -3.06* 0.00 -0.45 -0.10 Group H -0.15 0.09 -1.68 0.09 -0.33 0.03 Group I -0.22 0.09 -2.53* 0.01 -0.38 -0.05 Group J -0.22 0.09 -2.50* 0.01 -0.40 -0.05 Constant -2.37 0.11 -21.78* 0.00 -2.58 -2.16