HAL Id: hal-00325117
https://hal.archives-ouvertes.fr/hal-00325117
Preprint submitted on 26 Sep 2008
HAL is a multi-disciplinary open access archive for the deposit and dissemination of sci-entific research documents, whether they are pub-lished or not. The documents may come from teaching and research institutions in France or abroad, or from public or private research centers.
L’archive ouverte pluridisciplinaire HAL, est destinée au dépôt et à la diffusion de documents scientifiques de niveau recherche, publiés ou non, émanant des établissements d’enseignement et de recherche français ou étrangers, des laboratoires publics ou privés.
Neural Networks and their application in the fields of
corporate finance
Eric Severin
To cite this version:
Eric Severin. Neural Networks and their application in the fields of corporate finance. 2008. �hal-00325117�
Neural Networks and their application in the fields of
corporate finance
July 2008 Eric SEVERIN University de Lille 1 USTL
GEA Batiment SHS n°3
BP 179
59653 Villeneuve d’Ascq cedex E-mail : Eric.Severin@univ-lille1.fr
Professeur associé au SAMOS University of Paris 1
France Abstract:
This article deals with the usefulness of neuronal networks in the area of corporate finance.
Firstly, we highlight the initial applications of neural networks. One can distinguish two main types: layer networks and self organizing maps. As Altman al. (1994) underlined, the use of layer networks has improved the reclassifying rate in models of bankruptcy forecasting.
These first applications improved bankruptcy forecasting by showing a relationship between capital structure and corporate performance. The results highlighted in our second part, show the pertinence of the use of the algorithm of Kohonen applied to qualitative variables (KACM). More particularly, in line with Altman (1968, 1984), one can suggest the coexistence of negative and positive effects of financial structure on performance. This result allows us to question scoring models and to conclude as to a non-linear relationship.
In a larger framework, the methodology of Kohonen has allowed a better perception of the factors able to explain the leasing financing (Cottrell et al., 1996). This research, carried out with Belgian accounting data, highlights a relationship between leasing and the corporate financial strength. A following paper of this first study has been made using recent French data. The objective is here to explain the factors of the choice between leasing and banking loans. By using different variables, we highlight the characteristics of firms which most often use leasing. The corporate financing policy could be explained by: the cost of the financing, advantages of leasing or by the minimization of agency costs in leasing, we highlight a relationship between resorting to leasing and credit rationing.
Introduction
As underlined by Cottrell et al. (1996), maps Kohonen allowed many applications and more specifically to finance. The areas in which they were used are varied: the detection of firms in financial distress, the choice of debt policy (for instance leasing)… In the case of financial distress, the objective is to develop a function able to discriminate ‘good’(healthy) and ‘bad’ (financial distress) companies. So Altman (1968) tried to determine -on the basis of variables observed during a long period of time- a Z function by using a discriminant analysis. The most of these methods are based on discriminant analysis and logistic regression but some statistical properties are not always checked. This leads to question the relevance of results.
Neural networks, contrary to the traditional statistical methods most often used in finance, do not make assumptions a priori on the variables. This is why they are able to deal with not structured problems (i.e. problems where it is not possible to specify the discriminating function a priori). With these algorithms, these systems are able to learn the relations between the variables starting from a unit data. This approach, still called step ‘connexionnist’ differs from the ‘expert systems’ because the user creates the base of knowledge and the rules which must be applied. The interest of the connexionnist approach is the following: the neural networks are able to learn themselves the relationships between the variables.
From this point, our discussion will be organized in three parts. In the first part, we will present the neural networks will show the relevance of their application in order to highlight the firms in financial distress. The second part will deal with the other recent applications of these networks in the field of corporate finance and more particularly leasing. The third part turns into the problem of leasing. The last section concludes.
1. Neural networks and the capacity of detect firms in
financial distress
This section aims to introduce two types of neural networks: layered networks and self-organized maps called Kohonen maps.
1.1. Layered networks: a tool useful to detect firms in financial
distress
These networks are organized in layers, each one of them has several neurons. Each neuron is an autonomous calculating unit and is connected with whole or part of the other neurons (located on the same layer or on the preceding layers).
In the field of corporate finance, the neurons located in the first layer receive some information which characterizes the firm. Generally these data are financial ratios. The exit neuron takes a binary value, zero or one, according to the firm is considered as financial distress or healthy. Each neuron collects information of the preceding layer with which it has relationship and calculates an activation potential.
Setting a network is done using a sample of learning. It is the learning algorithm that adjusts the synaptic weights by researching a minimization of cost function (Rumelhert et al.) [1].
1.2. Artificial neural netwoks
The principle is the following. After a first calculation, the exit result obtained is compared with the researched result exit. The total error made by the system is then backpropagated from exit layer to entry layer and the synaptic weights are changed. It allows a new calculation. The implementation of the network requires: a sample of data used to parameter, a sample used for the validation and a third sample used to evaluate the capacities of generalization of the network.
During the training, the error decreases, until tending towards zero if the network architecture were correctly selected. However more the error is weak, less it is able to generalization.
1.3. Empirical results concerning firms in financial distress
An interesting contribution is realized by Altman et al. [2]. The authors test complex networks with several different sets of ratios. Our results highlighted a classification rate of 97.7% correct for healthy firms and 97% for firms in difficulty. These rates appear higher than those of discriminant analysis which is respectively 90.3% and 86.4%. Other studies (Bardos and Zhu) [3] found results that are consistent with the same first results. Besides, in the line of Udo [4] and De Almeida and Dumontier [5], .Casta and Prat [6] demonstrated the ability of artificial neural networks to deal with incomplete data, which remains common in this area of analysis.
From this point, we will highlight the main results in the field of corporate finance.
2. Recent applications: SOM
This section highlights the application of unsupervised networks to corporate finance. It focuses on study dealing with the capital structure and performance through the algorithm Kohonen and more particularly KACM.
Capital structure can be view in two different ways. The first is the leverage, the second is the ownership structure. We try to show the interest of Kohonen algorithm to deal with the relationship between leverage and performance. Our section is organized as follows.
In a first step, we will sum up the relationship between capital structure and performance. In a second step we will present the Kohonen methodology Kohonen. Finally, we will show results on empirical study.
2.1. Leverage, performance and value: a complex relationship
The financial literature has sought to measure the advantages of debt. Modigliani and Miller have shown that debt, in the absence of taxation, had not influence on the value of the firm (1958) but, in case of taxation, this relationship is modified (1963). In the latter case, debt can create value. From this work, numerous studies have sought to assess the impact of debt on value. The results are contradictory. Some authors like Altman (1968, 1984), Collongues (1977), debt is a source of bankruptcy and therefore destruction of value. Contrary to Modigliani and Miller, some authors such as Jensen (1986) or Wruck (1990) show that the debt has a positive influence on the firm value. Indeed, the debt can be used as a “sword of Damocles” because it constrained the leaders to undertake profitable projects able to generate
liquidities to face their engagements. Even if the effects of the debt remains unclear, one can consider that there is a relationship between debt and value.
In line of Altman, we can consider the following relationship: Decrease in performance Ö Increase of debt Ö Value destruction
For Opler and Titman (1994), the relationship is different. They note that the debt is certainly destroying of value but they show, through an empirical work, that this value destruction value also has an influence on corporate performance and on the debt level. Indeed, Opler and Titman (1994) specify that debt is a factor of « financial distress » likely to endanger the firm. Indeed, if a firm is in financial distress, the shakeholders can doubt its durability. For example, customers may be reluctant to do business with distressed firms. In other words, the stakeholders have no confidence in a firm which is not able to meet its commitments. The originality of Opler and Titman is to highlight the existence of indirect costs harmful to the firm before bankruptcy. In other words, they reverse the causality assumed by Altman.
In line of Titman and Opler (1994), we can consider the following relationship: Increase in debt in performance Ö Decrease of performance Ö Value destruction
2.2. The use of Kohonen algorithm an its advantages
2.2.1. The justification of Kohonen methodologyIf one considers the financial structure, the relationship between this concept and the performance is unclear.
When we try to determine if a non-linear relation exists between leverage and performance, we cannot use the techniques traditionally used in finance. Indeed, a great proportion of modern finance is based on the simplifying hypotheses; in particular, the normality of variables and the linearity of causality relations (Quintart, 1995).
Our hypothesis of non-linearity led us to focus our attention on self-organized maps (SOM) and more especially on one of the variants called the Kohonen Map (Kohonen, 1982 and 1995). One of the major advantages in its use is its capacity to deal with, in particular, non-linear problems (Quintart, 1995).
Our objective was to determine several groups of homogenous individuals. Secondly, we used non-parametric tests (Wilcoxon and χ2) to highlight significant differences between our groups.
Many traditional methods assume strong hypotheses; in particular, the assumption of normality. To test this, we examined the distribution of the ratios. As our ratios do not have a normal distribution. Extreme values require the use of qualitative data. This non-normality and the presence of extreme values led us to cluster our individuals into 4 classes. Hence, firstly we transformed each character Xi into 4 categories (very strong, strong ,weak, very weak1) and, secondly, transformed our variables into binary variables (De Bodt et al., 2001).
In a first step, in order to highlight the nature of relationship between debt and performance, we have realized a MCA. The findings are not satisfactory. The total inertia shown is weak (26%). The results are not reported.
Taking into consideration this disappointing result, we have decided to use a specific kind of self-organized map (SOM) called the Kohonen map2. The Kohonen algorithm3 is a well-known unsupervised learning algorithm which produces a map composed of a fixed number of units (figure 1 presents a one-dimensional map, frequently called a string). Each unit has a specific position on the map and is associated with an n-dimensional vector Wi (which will define its position in the input space), n being the number of dimensions of the input space. A physical neighborhood relation between the units is defined (in figure 2, units 1 and 3 are neighbors of unit 2) and for each unit i, Vr(i) represents the neighborhood with the radius r centered at i.
After learning, each unit represents a group of individuals with similar features. The correspondence between the individuals and the units (more or less) respects the input space topology: individuals with similar features correspond to the same unit or to neighboring units. The final map is said to be a self-organized map, which preserves the topology of the input space as much as possible.
The learning algorithm takes the following form: - at step 0, Wi(0) is randomly defined for each unit i,
- at step t, we present a vector x(t) randomly chosen according to the input density f and we determine the winning unit i*, which minimizes the Euclidean distance between x(t) and Wi(t),
- we then modify the Wi in order to move the weights of the winning unit i* and its physical neighbors towards x(t), using the following relations :
(
)
[
( ) ( ) ( )]
for (*) ) ( ) 1 (t W t t x t W t i V() i Wi + = i + ε × − i ∈ rt (Equation 1) i t W tWi( +1)= i( ) for other (Equation 2)
where ε(t) is a small positive adaptation parameter, r(t) is the radius of Vr(t) and ε(t) and r(t) are progressively decreased during the learning4.
This is a competitive kind of algorithm (each unit competes to be the closest to the presented individual) which will perform two interesting tasks for data analysis:
- a clustering5 : each unit will be associated with a similar kind of individual, the Wi vector associated with the unit converging toward the mean profile of the associated individuals. - a reduction in the number of dimensions : the (at least local) proximities between the units will give us an idea of the proximities of clusters of individuals in the input space.
A last remark concerning the neighborhood: it is reduced progressively to finish at value 0 (only the winning unit is displaced). The Kohonen algorithm then turns into a
2 An extensive presentation can be found in Kohonen T., “Self organized formation of topologically correct
feature maps”, Biological Cybernetics, 43, 1982, p. 59 or in Kohonen T., “Self-Organizing Maps” , Springer Series in Information Sciences Vol. 30, Springer, Berlin, 1995.
3 The Kohonen algorithm led to numerous theoretical studies: Cottrell, Fort and Pages (1987, 1-20), Ritter and
Schulten (1988, p 59-71), and to interesting applications in economics (and more specifically in finance).
4 For stochastic algorithm ε(t) must follow the requirements of Robins-Monro.
5 Moreover, the quality of the clustering can easily be supervised by the analysis of ratios like “Inter Cluster Sum
of Squares” (SSInter) on “Total Sum of Squares”(SSTotal) (as would have been done with classical data analysis tools).
vectorial quantification. To assess the statistical significance of the results obtained with the Kohonen map, we used traditional non parametric tests (Wilcoxon6, chi-square7).
2.3. Financial structure and performance: an unclear relationship
DeBodt et al. (2001) made a paper on the relationship between financial structure and performance on the French firms
Table 1: Relationship between performance and financial structure (From de DeBodt et al., 2001)
LEVVS VSGVW VSRVW VOIVW LEVW VSGW VSRW VOIW LEVVW VSGS VSRS VOIS LEVS VSGVS VSRVS VOIS
Unit1 Unit 2 Unit 3 Unit 4
Legend:
LEVVS, LEVS, LEVW, LEVVW: Leverage very strong, strong, weak, very weak.
VSGVS, VSGS, VSGW, VSGVW: Variation in sales growth very strong, strong, weak, very weak. VSRVS, VSRS, VSRW, VSRVW: Variation in stock return very strong, strong, weak, very weak. VOIVS, VOIS, VOIW, VOIVW: Variation in operating income very strong, strong, weak, very weak.
Leverage is measured for 1991, Variation in sales growth, of stock return and operating income are measured for 1993.
The representation above leads to the conclusion that the more leveraged firms (firms located in the unit 1) have the worst performances (measured with accounting and market ratios). However, the influence of leverage on the performance seems complex. Indeed companies whose debt is high are also more efficient. These companies located in Unit 4 seem to confirm the hypothesis of free cash flow Jensen (1986). Coexistence of positive and negative effects of debt on performance leads us to note that the link debt-performance is not linear.
This leads us to question the relevance of most scoring models. Indeed, in theses models the leverage has a negative (and significant) influence on performance and increases the probability of bankruptcy.
6 It is a test on ranks. Its justification is due to the no normality of data. Tests on ranks are very robust. By
arranging the different observations (i.e. by giving them a rank), one identifies the place of every observation in the sample. One substitutes rank for observation. Thus one neutralises problems bound to the accurate measure of the value for every observation. We can note too that the results of rank tests are not altered by the distributions of observations (symmetrical, non-symmetrical...).
2.2.3. Explicative variables able to predict difficulties
Table 2: Descriptive statistics of industrial and investment features (in 1991) of distressed firms (unit 1) and other firms (units 2, 3 and 4).
Observations Mean 1° Quartile Median 3° Quartile Distressed firms Effective firms Characteristics of the firms Distressed firms Effective firms Distressed firms Effective firms Distressed firms Effective firms Distressed firms Effective firms 43 157 WC/SA 91 (%) 32.30 24.81 19.02 13.86 29.71 22.96 43.4 32.77 26 87 II/SA 91 (%) 9.16 7.0 3.45 3.28 5.91 4.77 10.27 7.59 43 157 FA/TA 91 (%) 36.34 36.16 22.44 24.18 34.09 33.89 45.65 48.55 43 157 CA/FA 91 (%) 14.27 14.48 2.65 3.22 8.89 9.84 20.83 20.23 43 157 SA 91 in millions of French Francs 7173.593 13286.340 431.060 577.911 1309.697 1649.535 4001.968 7926.325 43 157 TA 91 in millions of French Francs 9314.354 13235.791 397.016 471.895 1159.066 1480.734 3612.653 7190.321 (From de De Bodt et al., 2001)
Table 3: Wilcoxon test on the industrial and investment features of distressed (firms in unit 1) and others firms (units 2, 3 and 4). Firms’ characteristics Wilcoxon statistic P value Significance WC/SA91 -2.1878 0.029 ** II/SA91 -1.139 0.255 NS FA/TA91 -0.219 0.827 NS CA/FA91 -0.346 0.729 NS SA91 -1.286 0.198 NS TA91 -1.075 0.282 NS
Note : *** significant at the 1% threshold ; significant at the 5% threshold ; significant at the 10% threshold ; NS (Not significant).
The last table is interesting and suggests that the negative impact of debt on performance is even more pronounced when companies have long operating cycles (result significant at the 1% threshold). During a crisis period, firms can be tempted to reduce their working capital by using more credit supplier.
2.2.4. Financial structure and performance: a dynamic relation
We wished to know if distressed firms increased their leverage correlatively with their difficulties. In other words, does decrease in performance lead to an increase in leverage? If this relationship is right, our results will be consistent with those of Altman (1984). We used the same methodology as before.
Table 4: Descriptive Statistics of leverage variation of distressed (unit 1), effective and very effective firms (units 2, 3 and 4).
Variation in leverage from 1991 to 1993
Number of observations
Mean Quartile One Median Quartile Three
Distressed firms (%) 43 2.80 9.2 -0.73 15.01 Effective and very
effective firms (%)
157 -0.5 -24.32 -10.18 7.35
Table 5: The Wilcoxon test on the variation of leverage (between 1991 and 1993) of distressed and others firms. Wilcoxon
statistic
P value Significance Leverage (∆ 1991- 1993) -2.518 .012 ** Note : ** significant at the 5% threshold.
8When comparing unit 4 with the others, a similar result is found, that is the working cycle of firm in that
category compared with others is lower at the significance threshold of 5% (-2.047). Likewise when comparing firms in units 1 and 4 only, the results confirm those already evidenced (-2.065 significant at the 5% threshold).
Descriptive statistics (table 4) indicated that on average distressed firms increased their debt (2.80%) whereas effective firms decreased their debt (-5.06% on average). This result allows us to think that debt-increase is passive and highlights a mechanical consequence of working operating difficulties. In other words, drop in performance has an adverse effect on the debt level. Thus decrease in performance mechanically led to an increase in difficulties for distressed firms.
The Wilcoxon test showed us that the variation in leverage between distressed and effective firms is statistically different (significant at the 5% threshold).
Hence highly-leveraged firms are less efficient than others and are also subject to the greatest variation in their leverage (significant at the 5% level).
The relationship between leverage and performance is dynamic and our results are consistent with those of Opler and Titman (1994) and Altman (1984). We can summarize it as follows :
Initially highly leveraged Initially very highly leveraged
(RELATION OF JENSEN) (RELATION OF OPLER
AND TITMAN)
Increase in performance Decrease in performance
(RELATION OF ALTMAN)
Increase in leverage
Leverage, a factor of « good stress » Leverage, a factor of « bad stress » (From De Bodt et al., 2001)
3. Another example: The leasing case
3.1. A First approach: Leasing as a substitute for bank loans
The question of substitutability or complementarity of leasing and debt has been studied in details by the financial literature but without reaching a consensus of unanimous reply. According to Myers et al. (1976), the use of leasing would be probably accompanied by a lesser utilization of a debt, reducing, in the same proportion, the firm’s debt capacity (Levasseur and Quintart, 2000, p. 6-7). The validity of such an argument is based on the perfect substitution hypothesis between leasing and bank debt. Therefore, this perfect substitution hypothesis can be rejected in favour of an imperfect substitution and sometimes in favor a complementarity between banking loans and leasing.
Two arguments can be advanced.
The first argument against a perfect substitution between leasing and debt concerns the substantial costs borne by the (banking) creditor or (credit) lessor in case of corporate bankruptcy. For Krishnan and Moyer (1994), costs created by the bankruptcy of the tenant would be lesser for the lessor that for any other creditor. The quality of ownership allows him to recapture the goods in case of corporate bankruptcy when the contract is not stopped. In
fact, it avoids opportunity costs associated with the slowness of the resolution process of the bankruptcy and more rapidly may allow to resale the asset.
The second argument contradicting perfect substitutability between leasing and debt is based on properties of leasing. By the terms of the contract and rights given to the lessor, leasing has characteristics close both to the secured and unsecured debt. The secured debt, because lessor has a real guarantee in the ownership of asset in the contract; the non-secured debt, because unpaid rents and banking loan prior before bankruptcy have the same rank of priority. In most of cases, the funds are lost by the creditor. The diversity of the debts contracted by the firm, introducing a distortion between creditors in case of bankruptcy, favours the thesis of the imperfect substitution leasing/ classical debt (Stulz and Johnson, 1985).
The question of complementarity or substitutability of debt and leasing seems to be unsolved because there is no consensus between theoretical and empirical approaches. Leasing is often analyzed as a last resort solution, especially for very weak firms. Firms’ financing preferences nevertheless depend on the characteristics. It allows lessor to gain a clientele of firms with atypical profiles. The reasons for the choice of leasing versus bank loan can therefore be several, which we develop in the following point.
As underlined by Smith and Wakeman (1985, p. 907): "the coexistence of both leased and purchased assets suggests that the net benefits of leasing are uniformly neither positive or negative ". In this vein, the understanding leasing choice versus bank loan for the firm would depend on costs/advantages.
The empirical study, proposed in the next paragraph, based on a sample of French firms differs from previous ones, in two points.
The first concerns the methodology employed. The empirical analysis of De Bodt et al. (1995, 1996) confirms viewpoints advanced in the financial literature. They do not allow to develop a discrimant analysis able to distinguish between firms that use leasing and those that do not. Moreover, by considering the very particular distribution of some ratios, the authors make a comparative analysis of a technique of linear data analysis (multiple correspondence analysis) and a technique of non linear analysis (Kohonen maps). The interest is in the results obtained by the KACM. Indeed, observations by the authors suggest firstly, the existence of subgroups within the population of firms that use leasing, and secondly, a clear association between the use of leasing and financial health of firms. Even if the KACM method presents weak points (The first is that the visualization of the Kohonen map does not allow evaluation of the distance between the units. The second is the quality of the representation), its use can bring progress in the understanding of leasing by the use of Kohonen maps. The use of Kohonen maps favors a roundup of individuals according to their propensity to use leasing utilization, which allows a finer analysis of firms’ profiles.
The second contribution of our study concerns the utilization of a direct measure of the credit rationing.
3.2. Data and methodology on French data
3.2.1. Sample presentation and variables choiceOur study deals with a sample of 11436 French SME. We used the date from Dun and Bradstreet, for 1999. As we sought accounting data which represent leasing financing, we proceeded in several steps. Firstly, we retained all firms with a staff between 20 and 500 employees. By this, we wanted to select SME by excluding very small firms in order that the information would be less difficult to deal with. From this point, we choose to retain only industrial and services firms using leasing. Indeed, we excluded firms in the financial sector (the accounting treatment of profit for these firms is significantly different than that of other sectors). After applying these criteria 12669 were retained.
The validity of accounting data was validated by using a series of coherence tests. Hence our sample was composed of 11233 firms. Then, we worked from the Dun database.
In this database, we used the following information: number of workers, long term debt, leasing, equity, short term assets, short term liabilities, EBITDA, financial fees, fiscal debt and firm age.
The collection of these data allowed the construction of variables used in empirical tests.
In this study, we seek to clarify explanatory factors in the propensity of the firm to finance by leasing. To take into account the intensity of credit lease utilization, we calculated the variable L (Leasing), by calculating the ratio of leasing divided by the long term debt for each observation.
The literature analysis presented in the first section allowed several arguments to be identified to explain the choice of leasing/banking loan for the firm. It concerns the firm’s risk level, information asymmetry between lender and borrower, the firm’s debt capacity and the dissociation between judicial and economic ownership. We summarize in table 6 for each determinant the financing policy by leasing. The lack of some data and information explains we have limited our investigation to these main four arguments. Table 7 presents the variable measurement used and the expected effects on the propensity of the firm to be financed by leasing.
Table 6: Theoretical viewpoint for using leasind and variables choosen
Theoretical viewpoint Argument Chosen Variables
The risk of the borrower The use of leasing is positively associated
with the bankruptcy risk (Krishnan and Moyer, 1994; Cottrell et al., 1996).
- Probability of bankruptcy - Firm’s solvability
Informational asymmetry on quality of growth opportunities
Leasing is all the more used when the firms are young and small (Sharpe and Nguyen, 1995).
- Firm size - Age
Limited debt capacity Firms with real debt capacity should use
leasing more frequently (Krishnan and Moyer, 1994).
- Leverage
The separation between judicial and economic ownership
The acquisition of judicial ownership is optional in leasing contract. The firm avoids transaction costs due to retrading the good on the second market. So the small-sized firm would probably used leasing more frequently (Smith and Wakeman, 1995). The loss of the legal ownership leads to loss in flexibility for the firm.
- Firm size
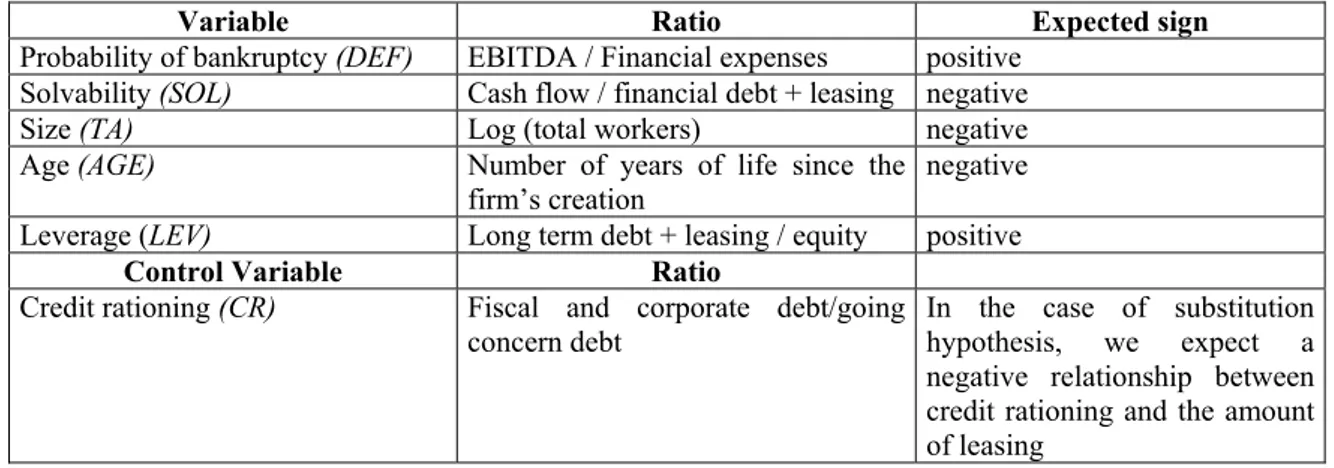
Table 7: Explanatory variables and previous effects
Variable Ratio Expected sign
Probability of bankruptcy (DEF) EBITDA / Financial expenses positive Solvability (SOL) Cash flow / financial debt + leasing negative Size (TA) Log (total workers) negative Age (AGE) Number of years of life since the
firm’s creation negative Leverage (LEV) Long term debt + leasing / equity positive
Control Variable Ratio
Credit rationing (CR) Fiscal and corporate debt/going
concern debt In the case of substitution hypothesis, we expect a negative relationship between credit rationing and the amount of leasing
3.2.2. Results obtained by Kohonen maps
In this section, we present the main results obtained from the firms’ sample.
We show the results obtained for the different variables. We associated the dependent variable to the explanatory variable, by highlighting different levels: VS: very strong, S: strong, W: weak and VW: very weak.
Table 8: Probability of the bankruptcy and the use of leasing. Theoretical hypothesis: The risk level of the borrower LVW DEFS LW DEFVW LS DEFW LVS DEFVS
Unit 1 Unit 2 Unit 3 Unit 4
Legend
LVS, LS, LW, LVW: Leasing very strong, strong, weak, very weak.
DEFVS, DEFS, DEFW, DEFVW: Probability of bankruptcy very strong, strong, weak, very weak. U1, U2, U3 et U4: Unit 1, Unit 2, Unit 3, Unit 4.
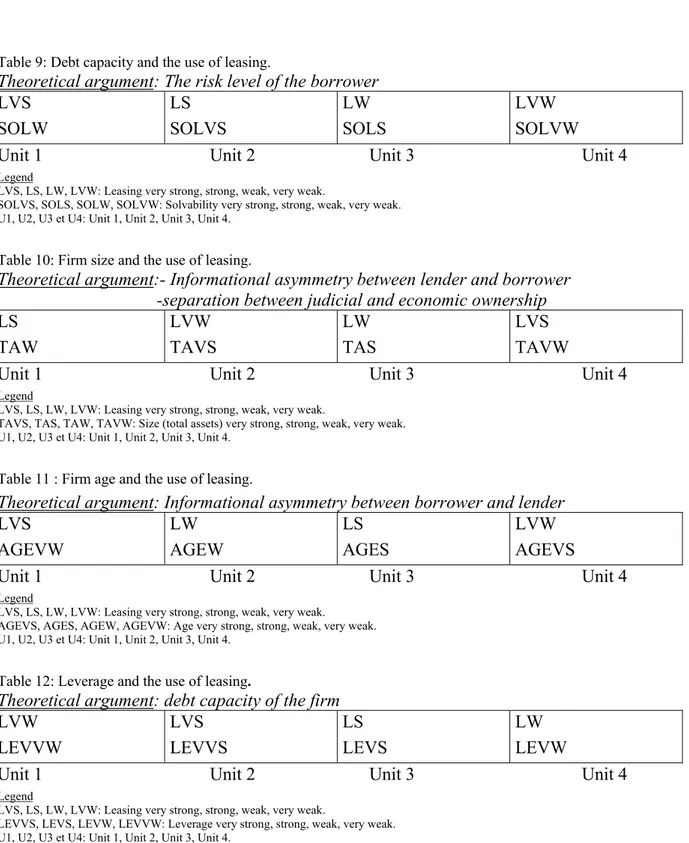
Table 9: Debt capacity and the use of leasing.
Theoretical argument: The risk level of the borrower LVS SOLW LS SOLVS LW SOLS LVW SOLVW
Unit 1 Unit 2 Unit 3 Unit 4
Legend
LVS, LS, LW, LVW: Leasing very strong, strong, weak, very weak.
SOLVS, SOLS, SOLW, SOLVW: Solvability very strong, strong, weak, very weak. U1, U2, U3 et U4: Unit 1, Unit 2, Unit 3, Unit 4.
Table 10: Firm size and the use of leasing.
Theoretical argument:- Informational asymmetry between lender and borrower -separation between judicial and economic ownership LS TAW LVW TAVS LW TAS LVS TAVW
Unit 1 Unit 2 Unit 3 Unit 4
Legend
LVS, LS, LW, LVW: Leasing very strong, strong, weak, very weak.
TAVS, TAS, TAW, TAVW: Size (total assets) very strong, strong, weak, very weak. U1, U2, U3 et U4: Unit 1, Unit 2, Unit 3, Unit 4.
Table 11 : Firm age and the use of leasing.
Theoretical argument: Informational asymmetry between borrower and lender LVS AGEVW LW AGEW LS AGES LVW AGEVS
Unit 1 Unit 2 Unit 3 Unit 4
Legend
LVS, LS, LW, LVW: Leasing very strong, strong, weak, very weak.
AGEVS, AGES, AGEW, AGEVW: Age very strong, strong, weak, very weak. U1, U2, U3 et U4: Unit 1, Unit 2, Unit 3, Unit 4.
Table 12: Leverage and the use of leasing.
Theoretical argument: debt capacity of the firm LVW LEVVW LVS LEVVS LS LEVS LW LEVW
Unit 1 Unit 2 Unit 3 Unit 4
Legend
LVS, LS, LW, LVW: Leasing very strong, strong, weak, very weak.
LEVVS, LEVS, LEVW, LEVVW: Leverage very strong, strong, weak, very weak. U1, U2, U3 et U4: Unit 1, Unit 2, Unit 3, Unit 4.
3.3.3. Comments and analysis
Empirical test results highlight significant effects for the different factors explaining the use of leasing. Indeed, firms use leasing especially when:
• they have small size • they are young
• they have a smaller solvability
These profiles testify a stronger risk of failure. The results suggest that leasing is often used when the firms are constrained by credit rationing. (Krishnan and Moyer, [25] ; Sharpe and Nguyen) [30]).
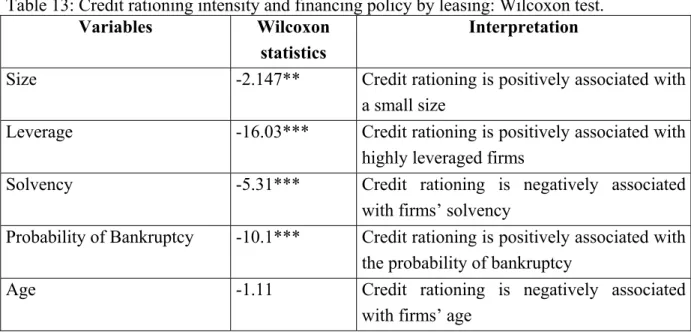
We have consequently sought to check if our results were robust, by seeing the relationship between explanatory variables and the credit rationing. To do this, we evaluated the level of credit rationing of the firm by the following ratio: fiscal and corporate debt/ going concern debts.The Wilcoxon test shows significant results for the following variables: size, leverage, probability of bankruptcy and solvency. We verify consequently that relationships have their origin in credit rationing. Table 13 summarizes the results.
Table 13: Credit rationing intensity and financing policy by leasing: Wilcoxon test.
Variables Wilcoxon statistics
Interpretation
Size -2.147** Credit rationing is positively associated with a small size
Leverage -16.03*** Credit rationing is positively associated with highly leveraged firms
Solvency -5.31*** Credit rationing is negatively associated with firms’ solvency
Probability of Bankruptcy -10.1*** Credit rationing is positively associated with the probability of bankruptcy
Age -1.11 Credit rationing is negatively associated with firms’ age
Note: *, ** and *** significant at the 10%, 5% and 1% threshold.
On the French SME sample, our results suggest that the use of leasing is positively associated with credit rationing. This confirms that the use of leasing is a “last resort solution”. Otherwise, the financial literature does not totally explain the motives of credit rationing. Is credit rationing due to too high leverage or informational asymmetry on the borrower? In this context, leasing could be preferred by young firms and start-ups.
Conclusion
We will end this paper with:
the advantages and the disadvantages of neural networks systems our results.
The advantages are numerous compared to classical statistical analyses. On the one hand, they allow problems to be investigated for which we have a priori non information. Thus in the framework of the detection of firms in financial distress, it is not necessary to know the variable distribution (contrary to discriminant anlysis). Secondly, the neuronal systems discover by themselves relationships between variables which allow us to study non-linear problems. Thirdly, the uncompleted data can be taken into account by the supplementary neuron addition. Fourthly, the stop of the iterative process -when the system produces the best results on the validation sample- gives robust results. One can consider that
the relevant information is integrated in the system. Fifthly, neuronal systems allow to work on qualitative and quantitative variables.
Despite these advantages, several criticism can be addressed to neural networks. These are following. Firstly, it does not exist theory allowing to determine the optimal structure of the system. Especially the determination of the hidden layers number and the number of neurons are, the most often, dependant from the user and its capacity to experiment several architectures. Secondly, neural networks often assimilated to "black boxes" in which it is difficult to extract relevant relationships among variables.
However, the studies presented above show that neural networks give good results in the classification area. To be able to improve the approach by neuronal networks, efforts have to focus on: the construction of the system, the clustering of entry variables and the adjustment of learning parameters that depend greatly on human intervention.
After these papers, the next research will be focus on the problem of prediction which will be developed in the next presentations.
Bibliography
[1] COTTRELL M., DE BODT E., LEVASSEUR M., 1996, « Les réseaux de neurones en finance : Principes
et revue de la littérature », Finance, 16(1), pp 25-91.
[2] ALTMAN E.I., 1968, « Financial ratios, discriminant analysis and the prediction of corporate bankruptcy »,
Journal of Finance, XXIII(4), pp 589-609.
[3]RUMELHARTD.E.,HINTONG.,WILLIAMSR.,1986, « Learning representation by back propagation
errors », Nature, 323, 9.
[4]ALTMANE.,MARCOG.,VARETTOF.,1994, « Corporate distress diagnosis: comparison using linear
discriminant analysis and neural networks (the italian experience) », Journal of Banking and Finance, 18.
[5] BARDOS M., ZHU W., 1995, « Comparaison de l’analyse discriminante linéaire et des réseaux de
neurones : application à la détection de défaillance d’entreprises », Actes de la deuxième rencontre internationale sur l’approche neuronale en sciences de gestion, Poitiers.
[6]UDOG., 1993, « Neural network performance on the bankruptcy classification problems », Computer and
Industrial Engineering, 25, n°4.
[7]DEALMEIDAF.,DUMONTIERP.,1993,« Réseaux de neurones, information comptable et détection du
risque de défaillance », 14ème congrès de l’Association française de comptabilité, vol 1.
[8]CASTAJ.F.,PRATB.,1994, « Approche connexioniste de la classification des entreprises : contribution au
traitement d’informations incomplètes », CREREG, Paris Dauphine.
[9] MODIGLIANI F,.MILLER M., 1958, « The cost of capital, corporation finance and the theory of
investment », American Economic Review, 49, pp 261-297.
[10]MODIGLIANIF.,MILLERM.,1963, « Corporate income taxes and the cost of capital : a correction »,
American Economic Review, volume 53, pp 433-443.
[11] ALTMAN E.I., 1984, « A Further empirical investigation of the bankruptcy cost question », Journal of
Finance, XXXIX(4), pp 1067-1089.
[12] COLLONGUES Y., 1977, « Ratios financiers et prévision des faillites des PME », La Revue Banque, 365,
[13] JENSEN M.C., 1986, « Agency costs of free cash flow, corporate finance and takeovers », American
Economic Review, volume 76, pp 323-329.
[14] WRUCK K.H., 1990, « Financial distress, reorganization and organizational efficiency », Journal of
Financial Economics, volume 27, pp 662-676.
[15] OPLER T., TITMAN S., 1994, « Financial distress and corporate performance », Journal of Finance,
XLIX(3), pp 1015-1040.
[16] QUINTART A., 1995, « Les fondements de la théorie financière classique et les limites de l’hypothèse
générale de linéarité » dans De Bodt et Henrion (ed), Les réseaux de neurone en finance : conception et applications, Bruxelles, D Facto Publications, pp 1-21.
[17] KOHONEN T., 1982, « Self organized formation of topologically correct feature maps », Biological
Cyberbetics, 43, 59 p.
[18] KOHONEN T., 1995, « Self organizing maps », Springer Series in Information Sciences », vol 30,
Springer, Berlin.
[19] DEBODT E., LEVASSEUR M., SEVERIN E., 2001, « Debt a factor of good and bad stress suring an
economic recession : Evidence from France », Fuzzy Economic Review, Vol VI, n°1, pp 63-87.
[20] COTTRELL M., FORT J.C., PAGES G., 1987, « Etude d’un algorithme d’auto-organisation », Annales
de l’Institut Henri Poincaré, vol 23, #1, pp 1-20.
[21] RITTER H., SCHULTEN K., 1988, « Convergence properties of kohonen’s topology conserving maps:
fluctuations, stability and dimension selection », Biol Cybernetics, 60, p 59-71.
[22] ROBINS H. MONRO H., 1951, « A stochastic approximation method », Annales de Mathématiques et de
Statistiques 22, pp 400-407.
[23] MYERS S.C, DILLD., BAUTISTA A., 1976, « Valuation of financial leasing contracts », Journal of
Finance, volume 31, pp 799-819.
[24]LEVASSEURM.,QUINTARTA.,2000, « La capacité d’endettement », Banque et marchés, numéro 45,
pp 5-20.
[25] KRISHNANV., MOYER R., 1994, « Bankruptcy costs and the financial leasing decision », Financial
Management, volume 23, n° 2, summer 1994, pp 31-42.
[26]STULZR.,JOHNSONH.,1985, « An analysis of secured debt », Journal of Financial Economics, volume
14, pp 501-521.
[27]SMITHC.W.,WAKEMANL.,1985, « Determinants of corporate leasing activity », Journal of Finance,
volume 40, n°3, pp 895-911.
[28] DEBODT E.,HENRION E.F., VANWYMEERSCHC., WOLFS A., 1995, « Le leasing financier :
complément ou substitut du crédit à l’investissement ? Quelques résultats empiriques », Approches Neuronales en Sciences Economiques de gestion, Futuroscope de Poitiers.
[29]COTRELLM.,DE BODTE.,HENRIONE.,1996, « Understanding the leasing decision with the help of a
Kohonen map -A empirical study of the Belgian market- », ICCN Congress.
[30]SHARPES.,NGUYENH.,1995, « Capital market imperfections and the incentive to lease », Journal of