HAL Id: hal-00448649
https://hal.archives-ouvertes.fr/hal-00448649
Submitted on 19 Jan 2010
HAL is a multi-disciplinary open access archive for the deposit and dissemination of sci-entific research documents, whether they are pub-lished or not. The documents may come from teaching and research institutions in France or abroad, or from public or private research centers.
L’archive ouverte pluridisciplinaire HAL, est destinée au dépôt et à la diffusion de documents scientifiques de niveau recherche, publiés ou non, émanant des établissements d’enseignement et de recherche français ou étrangers, des laboratoires publics ou privés.
Recombinant Knowledge and Growth: The Case of ICTs
Cristiano Antonelli, Jackie Krafft, Francesco Quatraro
To cite this version:
Cristiano Antonelli, Jackie Krafft, Francesco Quatraro. Recombinant Knowledge and Growth: The Case of ICTs. Structural Change and Economic Dynamics, Elsevier, 2010, 21 (1), pp.50-69. �10.1016/j/strueco.2009.12.001�. �hal-00448649�
Recombinant Knowledge and Growth: The Case of ICTs
1Cristiano Antonellia,b Jackie Krafftc Francesco Quatrarob,c
a
Department of Economics, University of Turin b
BRICK, Collegio Carlo Alberto c
University of Nice Sophia Antipolis, CNRS-GREDEG
ABSTRACT.
The economics of recombinant knowledge is a promising field of investigation. New technological systems emerge when strong cores of complementary knowledge consolidate and feed an array of coherent applications and implementations. However, diminishing returns to recombination eventually emerge, and the rates of growth of technological systems gradually decline. Empirical evidence based on analysis of the co-occurrence of technological classes within two or more patent applications, allows the identification and measurement of the dynamics of knowledge recombination. Our analysis focus on patent applications to the European Patent Office, in the period 1981-2003, and provides empirical evidence on the emergence of the new technological system based upon information and communication technologies (ICTs) and their wide scope of applications as the result of a process of knowledge recombination. The empirical investigation confirms that the recombination process has been more effective in countries characterized by higher levels of coherence and specialization of their knowledge space. Countries better able to master the recombinant generation of new technological knowledge have experienced higher rates of increase of national multifactor productivity growth.
KEYWORDS: RECOMBINANT GROWTH; SPECIALIZATION, COHERENCE AND VARIETY OF THE KNOWLEDGE BASE; PATENT CLASSIFICATIONS. JEL CLASSIFICATION CODES: O33
1
This work is part of a research project funded by Agence Nationale de la Recherche (contract number: ANR JCJC06_141306, “Knowledge Intensive Sectors: Models and Evidence”) and the Provence Alpes Côte d’Azur Region. The authors acknowledge financial support from Collegio Carlo Alberto and CNRS.
1. Introduction
Since the seminal contributions by Schumpeter (1942), the analysis of the relationships between knowledge and innovation on the one hand, and economic growth on the other hand, has more and more attracted economic scholars. Empirical contributions estimating the relationship between knowledge and productivity has then appeared thanks to the path-breaking works by Zvi Griliches (1979). Most of them consisted of industry- or firm-level analyses2, while much a lower number of studies provided cross-country comparisons of the relationship between knowledge and productivity growth3. All these contributions shared an approach to technological knowledge as an unbundled stock. At the present time it is no longer sufficient to articulate the hypothesis that technological knowledge is a major factor in economic growth. More details and specifications are necessary to enquire the specific forms of the relationship between the characteristics of the generation of technological knowledge and actual increases in rates of economic growth.
This paper explores some key aspects of the generation of the technological knowledge that lies at the heart of the emergence of the new technological system based upon of information and communication technologies (ICTs). To this purpose, we combine the recombinant growth approach and the analysis of the role of variety in the economics of knowledge. We adopt Pier Paolo Saviotti’s view of knowledge as a retrieval/interpretative and co-relational structure. This allows us to represent the knowledge base of the sector as a network whose nodes are constituted by technological classes, and to measure a number of properties of the knowledge base by means of co-occurrence matrices (Saviotti, 2004, 2007). We explore and identify a number of key characteristics of the recombinant generation of new technological knowledge and demonstrate their relevance for understanding the dynamics of economic growth.
2
Without pretending to be exhaustive, out of the noteworthy contributions one may look at Nadiri (1980), Griliches (1984), Cuneo and Mairesse (1984), Patel and Soete (1988), Verspagen (1995) and Higón (2007).
We focus on the ICT sector knowledge base and its evolution through the 1980s and 1990s, and on its relationship with productivity growth in a sample of 14 representative OECD countries. The evolution of the ICT sector from its origins in the 1950s, has been characterized by a process of continuous and rapid technological change, throughout which incremental innovation has been punctuated by major scientific breakthroughs (Bresnahan and Malerba, 1999). The development of ICTs can be represented as a typical Schumpeterian gale of innovation characterized by increasing convergence and the integration among a variety of localized innovations, generated within a wide range of industries and firms. Technological convergence has been driven by the introduction of a number of innovations such as Internet services, enhanced broadband fibre optics, Asynchronous Digital Subscriber Lines (ADSL), digital television and universal mobile telecommunications system, opening up the possibility of integrating a variety of content, services, technologies and applications (Fransman, 2002 and 2007). As a result ICT, and the related technological knowledge, are analyzed as a new technological system stemming from the recombination of a variety of knowledge modules that has fed an array of applications in many technologies favoring their rejuvenation (Quatraro, 2009; Van den Ende and Dolfsma, 2005).
The evolution of the new technological system, marked by the increasing convergence of telecommunications and electronics during the 1980s, led to a reallocation of technological effort focused mainly, in the second half of the 1990s and the early 2000s, on the provision of content for the Internet and on wireless communication. Alongside this changing technological focus, the ICT ecosystem underwent a thorough reorganization of the international division of labour, with respect to the different layers in which it is articulated (Fransman, 2007; Krafft, 2010; Krafft, 2004; Krafft and Salies, 2008).
The analysis of the generation and dissemination of ICTs in the last decades of the 20th century therefore provides clear evidence on the working of recombinant knowledge: knowledge recombination is at the centre of the dynamics and is characterized by a clear sequence based upon a highly selective process of exploration (Corrocher, Malerba, Montobbio, 2007).
The contribution of this paper to the existing literature is threefold. Firstly, and most importantly, it provides a theoretical framework that implements and articulates the notion of recombinant knowledge for the analysis of the emergence of new technological systems. Secondly, it proposes a methodology based on the analysis of the co-occurrence of technological classes in one or more patents, to operationalize the empirical investigation of the recombination of different technologies. Thirdly, it provides further support for the idea that, in order to assess the relationship between the generation of new knowledge and economic growth, the focus on knowledge capital stock and traditional indicators of its quality such as patent citations and litigations, is not sufficient to capture the qualitative changes that affect the internal structure of knowledge bases at firm level and at more aggregate levels of analysis.
The paper is organized as follows. Section 2 provides a synthesis of the relevant literature and proposes a set of hypotheses on knowledge recombination as a key feature in the emergence of new technological systems. Section 3 articulates the research strategy, by introducing the knowledge-related measures that we maintain are better suited to the analysis of recombinant knowledge, and qualifies our working hypotheses. Section 4 describes the datasets used in this study and Section 5 presents the empirical evidence concerning the evolution of the knowledge-related measures across the sampled countries in the ICT field, while Section 6 shows the results of the econometric analysis. Section 7 provides a discussion of the main findings and offers some conclusions.
2. Theoretical framework
For quite a long time, the generation of new knowledge was modelled as if it might be assimilated to the discovery of new oil fields. This approach has been superseded by more articulated methods and the so-called recombinant knowledge approach has provided a basis for the elaboration of new analytical framework. As Weitzman (1996: 209) recalls: “when research is applied, new ideas arise out of existing ideas in some
kind of cumulative interactive process that intuitively has a different feel from prospecting for petroleum”. This insight led to the recombinant growth approach which views new ideas as being generated through the recombination of existing ideas, under the constraint of diminishing returns to scale in the performance of the research and development (R&D) activities necessary to apply new ideas to economic activities (Weitzman, 1998; Caminati, 2006).
This notion of recombinant knowledge has attracted contributions from many different disciplines. A large literature on biological grafting has applied the so-called NK model to the economics of knowledge. According to Kauffman (1993), the success of a search process depends on the topography of a given knowledge landscape shaped by the complementary relations (K) among the different elements (N) of a given unit of knowledge. In the NK model, the features of the topological space within which the economic action that leads to the generation of new technological knowledge takes place, are not characterized from an economic viewpoint. Rather, the number of complementary relations and their distribution are given, as are the number of elements belonging to each unit of knowledge. As frequently occurs when biological metaphors are grafted onto economics, this is compounded by the fact that the number of components and their relations are exogenous and there is no economic analysis of their associated costs and revenues.
As Fleming and Sorenson (2001:1035) note, while “in natural evolution, recombination occurs primarily through haphazard sex… inventors can purposely combine elements in technological evolution. Olsson (2000) injected some basic economics into the recombinant knowledge approach and introduced a preliminary metrics to account for its costs. Olsson and Frey (2002) identify the notion of technological space and suggest that the costs of knowledge recombination are a function of knowledge distance. They do not stretch their economic analysis to a consideration of the metrics related to the revenues associated with knowledge recombination. In their view, very much along the lines of the Weitzman’s combinatorial analysis, all recombinations are expected to yield the same revenue.
Fleming and Sorenson (2001) tested the hypothesis put forward by Kauffman according to which the likelihood of success depends upon the characteristics of the technological landscape into which the search process takes place. The technological landscape is defined in terms of interdependence among components. Too much interdependence among components engenders too high search costs. Too little interdependence reduces the chances of generating new technological knowledge. The empirical test of Fleming and Sorenson (2001) is based upon the analysis of the citations and the subclass references of patents. The former should capture the relevance of the new technology. The latter should capture the variety of components. The results suggest that an optimum can be found in between the two extremes of the non-monotonic relationship between the interdependence of the components of the technological landscape and the search.
According to Saviotti, the essence of a knowledge base is its collective nature, which confers the basic properties of being a retrieval/interpretative and co-relational structure. These reflect the cumulative nature of knowledge and the key roles of similarity and complementarity in the activity of recombination. The higher the level of complementarity among different types of knowledge, the higher will be the probability that they can be combined. This representation also enables empirical analysis through the construction of an image of the knowledge base as a network in which the nodes are constituted by units of knowledge at a given level of aggregation. Several empirical investigations have been conducted based on information contained in patent documents (Saviotti, 2004, 2007; Grebel et al., 2006).
The generation of new knowledge by means of the recombination of pre-existing knowledge items does not yield the same results in all possible directions. Some recombination processes are likely to be more fertile than others. Some knowledge items happen to be central in the generation of new knowledge (Frenken 2004; Frenken and Nuvolari, 2004). There is a large body of empirical work investigating the hypothesis that when a core body of new, radical knowledge emerges it promotes the generation of new knowledge in the rest of the economy (Bresnahan and Trajtenberg, 1995). The empirical analysis of Hall and Trajtenberg (2008), based upon the citations
of ICT related patents confirms that a small number of central technologies has played a central role in feeding the advance in a variety of other fields.
The application of system dynamics to the analysis of the new economics of knowledge suggests that the knowledge is a system that can be represented by means of a map where a variety of components or modules are linked by links of varying strength according to their cognitive distance. The map of the knowledge system shows that the knowledge space is rugged and is characterized by different levels of interdependence and interrelatedness among a variety of components. The relations among such components may be qualified in terms of fungibility, cumulability and compositeness according to the contribution that each body of knowledge is able to make in the recombinant generation of new technological knowledge. Radical technological change takes place when a variety of complementary bodies of knowledge come together to form a hub that provides knowledge externalities to the “peripheries”, which in their turn provide new inputs and help the pursuit of further recombination stretching its core (Antonelli, 1999 and 2008).
Arthur (2009) makes an important contribution to understanding the generation of technological knowledge and eventually the introduction of new technologies with the analysis of the role of cumulativeness and variety on the costs and the efficiency of recombination processes. The work of Pier Paolo Saviotti provides basic guidance to explore these aspects of knowledge recombination processes. His work shows how new radical technologies are the result of the recombination of diverse knowledge items and at the same time activate a process of centred recombination based on flows of knowledge externalities. Active users of pre-existing technologies access the knowledge spilling over from a new radical technology and combine it with their core knowledge. This recombination then feeds back into the core technology (Saviotti, 1996; Saviotti et al., 2005).
In this process core technologies act as hubs in the collective process of knowledge generation in which all the parties involved act intentionally, within a well-identified rent-seeking perspective. The outcome of these individual interactions is clearly
influenced by the population dynamics of the entries of more or less compatible agents with whom recombination can be practised. When such dynamics yield positive outcomes new gales emerge from a sequential process of selective aggregation in the knowledge space, of agents encompassing specific components with high levels of potential complementarity (Nesta and Saviotti, 2005, 2006; Krafft et al., 2009).
A large empirical evidence at the firm level suggests that in the recombination process there are not unlimited opportunities, which are fertile at any time, and in any place. Knowledge recombination may occasionally yield positive returns in well-defined and circumscribed circumstances that take place in historic time, regional space and knowledge space, when a number of key conditions apply. In other cases, however, the returns from recombination may be less productive. Schumpeterian gales of innovation can be better understood as a historical process of emergence of new technological systems based upon a selective and sequential overlapping among complementary technologies that takes place in well defined circumstances (Leten, Belderbos, Van Looy, 2007).
Knowledge recombination is intrinsically dynamic as it is characterized by clear sequences. The emergence of a core of complementary technologies is the first aggregating step based on highly selective exploration. This initial core of technologies is very productive and is characterized by low recombination costs and high revenues from the additional knowledge generated. This engenders a process of technological convergence. The emergence of new knowledge cores pushes firms already active in existing knowledge space to explore seemingly less complementary knowledge regions in an effort to take advantage of new, marginal opportunities for knowledge recombination. Eventually, the increasing variety of these recombinations will prove less and less effective and the diminishing returns to recombination will become apparent (Breschi, Lissoni, Malerba, 2003).
The exploration of the map of knowledge activities in a system and the appreciation of their variety, coherence and heterogeneity provides key information to assess the quality of knowledge activities that take place in the system at each point in time, because it
enable to appreciate the efficiency of the recombination process that is at the origin of new knowledge (Fontana, Nuvolari, Verspagen, 2009).
The empirical evidence gathered along these lines of investigations enables to articulate our basic hypothesis as follows. Technological change is a major factor triggering productivity growth. This is even more evident in the case of ICT-related knowledge. The characteristics of the map of knowledge space affect the efficiency of the recombinant knowledge with clear effects upon the pace of technological change and therefore on productivity growth. More specifically we contend that:
a) too much variety and heterogeneity of knowledge items increases the cognitive distance and hence reduces the yield of the recombination process;
b) the lack of heterogeneity on the opposite reduces the opportunities for recombination and hence has also negative effects on the yield of the recombination process;
c) the coherent variety of knowledge items, should help the recombination process and favour the generation of new knowledge. Coherent variety enables to foster recombination because it enables to use variety and yet to circumscribe it within limited domains.
3. Research Strategy
The argument elaborated so far leads us to maintain that new indicators of the quality of the knowledge portfolio of both firms and regions, industries or countries at more aggregate levels need to be elaborated, in order to gain a better assessment of the relationships between knowledge and productivity growth. Traditional indicators such as the knowledge capital stock or patent based measures of knowledge quality are not sufficient. Work on assessing the quality of knowledge stocks based on such indicators as patent citations, infringements and litigation (Jaffe and Trajtenberg, 2002; Harhoff and Reitzig, 2004; Harhoff et al., 2003) risks reflecting the effects of patent races and, hence, tends to dwell on the consequences of oligopolistic rivalry in product markets rather than the sheer quality of patents. Litigation and citations are much less relevant in
emerging technological fields where oligopolistic rivalry has not become the dominant market form (Hall and Ziedonis, 2001, 2007).
On this basis we may therefore formulate a preliminary empirical specification to test the hypotheses spelled out in the previous section:
∑
∑
+ + + + = − − − m − t i m m n t i n n t i i i u Z d K c A b a t A t A 1 , , 1 , , 1 , ln ln ln ) 1 ( ) ( ln (1)According to equation (1), ln[A(t)/A(t-1)] is the rate of multi factor productivity (MFP) growth of country i and it is a function of n characteristics of the knowledge base of the ICT sector and m control variables, with u being the error term (see Appendix A for details on calculations of MFP growth rates). All the explanatory variables are lagged in order to reduce the risk of spurious correlations. Moreover, and as is usual in this type of empirical setting, we include in the structural equation the lagged level of productivity, lnAi,t−1, in order to capture the possibility of mean reversion.
Our approach allows us to identify and measure a new qualification of technological knowledge. The exploration of the knowledge space enables to qualify the distribution of knowledge items and their relations so as to assess the extent to which the extent a new unit of technological knowledge feeds the generation of technological knowledge in other fields and the extent to which the generation of new technological knowledge in a field depends on the contributions of knowledge inputs from other fields.4
The generation of knowledge is enhanced by the selective recombination of ideas centred upon a set of core technologies with high levels of fungibility, and feeds the generation of further innovations by stimulating their knowledge compositeness. Gradually diminishing returns to recombination will limit the growth of new technological systems: excess variety matters. The introduction and dissemination of new ICTs in the last two decades of the 20th century is characterized by this dynamics.
4
Hence knowledge fungibility and knowledge compositeness can be considered two aspects of knowledge recombination (Antonelli, 2008; Antonelli and Calderini, 2008; Antonelli et al., 2008).
Detailed analysis of the characteristics of the knowledge base, drawing on patent statistics, enables us to identify the actual dynamics of recombinant knowledge by exploiting the distribution of patents across technological classes. We assume that the distribution of co-occurrences of technological classes across the patent portfolios of agents and countries can be considered a reliable indicator of the extent to which recombination is involved and has contributed to economic growth in each context.
The implementation of the indicators proxying the properties of the knowledge base is carried out by using patent statistics5. Note that, to introduce some rigidities into national technological portfolios and to compensate for the intrinsic volatility of patenting behaviour, each patent is assumed to be in force for five years. We calculated most of the relevant variables, like revealed technology advantage, technological variety and knowledge coherence, by relying on the technological classes assigned to each patent on the basis of the International Patent Classification (IPC)6. Let us turn now to describing the knowledge-related variables in more detail:
1) First, the ICT knowledge stock is a proxy measure for the rate at which knowledge is produced within each country’s ICT sector, traditionally used to measure the output from knowledge generating activities. It is computed for each country, at each year, by applying the permanent inventory method to patent applications. We calculate it as the cumulated stock of patent applications in the ICT field using a rate of obsolescence of 15% per
5
The limitations of patent statistics as indicators of innovation activities are well known and include their sector-specificity, existence of non-patentable innovations and the fact that there are other protection tools. Moreover, the propensity to patent varies over time as a function of patenting cost, and is more likely to feature large firms (Pavitt, 1985; Levin et al., 1987; Griliches, 1990). Nevertheless, patents can be useful measures of new knowledge production especially in the context of analyses of aggregate innovation performance (Acs et al., 2002). There is also debate over patents being considered an output rather than an input of innovation activity and empirical analysis shows that patents and R&D are dominated by a contemporaneous relationship, further supporting use of patents as a proxy for innovation (Hall et al., 1986). Patent application is a time- and resource-consuming process, likely to produce ex-ante selection of the innovations to be patented which enables identification of high-value innovations stemming from systematic and more formalized innovation efforts, which are the object of our analysis.
6
Since Jaffe (1986 and 1989), technological fields have been used to calculate technology-related variables. Out of the former empirical studies using IPC codes assigned to European Patents it is worth recalling the one by Verspagen (1997). More recently IPC codes have been successfully employed in empirical analyses to calculate technological variety and relatedness (See Breschi et al., 2003; Nesta and Saviotti, 2005 and 2006; Nesta, 2008).
annum: ,, ,, (1 ) ,,−1 • − + = sit sit t i s h E E
δ
, where hs,i,t •is the flow of patent applications in sector s in country i, and δ is the rate of obsolescence7. This measure has some shortcomings, however, in that it is affected by cross-country size differences, which means we need an index able to discount for country size. To this end, it is useful to look at the ratio between ICT knowledge stock and total knowledge stock for each country at each year:
∑
= s t i s t i s t i s E E ICTK , , , , , , (2)However, an index that is better suited to measuring the relative technological strengths (or weaknesses) of countries is represented by revealed technological advantage (RTA), developed by Soete (1987). This is defined as follows:
=
∑∑
∑
∑
s i t i s i t i s s t i s t i s t i s E E E E RTA , , , , , , , , , , (3)The RTA index varies around unity, such that values greater than 1 indicate that country i is relatively strong in technology s, compared to other countries and the same technological field, while values less than 1 indicate a relative weakness8.
2) As argued in Section 2, traditional measures of innovation built on a purely quantitative account of knowledge capital stock or qualitative indices based on
7
This depreciation rate is very common in empirical analyses that derives the knowledge stock either from R&D investments (Griliches, 1990; Loos and Verspagen, 2000) or from patent applications (Nesta, 2008).
8
It is worth noting that the inclusion of the RTA index in econometric specifications may yield some biased estimates (Laursen, 1998). This is due to the fact that the index squeezes the values signalling non specialization between 0 and 1, while values signalling specialization are between 1 and infinity. This gives rise to a skewed distribution that in turn implies the violation the normality assumptions of the error term in the regression. For this reason it is recommended to use some transformation of the index that makes its distribution close to the normal one. In the following econometric estimations we have taken standardized values for the RTA, the distribution of which proximate very much normality.
patent citations and litigation do not capture the effects of variety, selective recombination and complementarity in the generation of technological knowledge. Thus, we use indices based on the co-occurrence of technological classes within patent applications. This means that the main focus of our analysis is on multi-technology patents, making it necessary to control for their time evolution by including the following variable in the regression:
∑
∑∑
= i t i q i t i q t i E E MTP , , , , (4)If q is the set of multi-technology patents, the index MTP in equation (4) defines the share of these patent in the whole technological portfolio of each country in the ICT sector. It should be noted that the distribution of this variable is highly skewed to the right, as the knowledge stock in all the sampled countries is dominated by multi-technology patents from the beginning of the time period of our analysis.
3) We measure technological variety in each country’s ICT knowledge base using the information entropy index. Entropy measures the degree of disorder or randomness in the system, such that systems characterized by high entropy are also characterized by a high degree of uncertainty (Saviotti, 1988). The entropy index was proposed for application in economic analysis by Theil (1967). Its earlier applications were aimed at measuring diversity in an industry (or a sample of firms within an industry) against a uniform distribution of economic activities in all sectors, or firms (Attaran, 1985; Frenken et al., 2007).
Unlike the more common measures of variety and concentration, information entropy has some interesting properties (Frenken, 2004), one being its multidimensional extension. Consider a pair of events (Xl, Yj), and the probability of their co-occurrence plj. A two dimensional total variety (TV)
∑∑
= ≡ l j lj lj p p Y X H TV ( , ) log2 1 (5)If we take plj to be the probability that two technological classes l and j co-occur
within the same patent, then the measure of multidimensional entropy focuses on the variety of co-occurrences of technological classes within patent applications. Also, the total index can be decomposed in a “within” and a “between” part, at anytime that the events being investigated can be aggregated in a smaller number of subsets. Within-entropy measures the average degree of disorder or variety within subsets, while between-entropy focuses on the subsets, measuring the variety across them. Frenken et al. (2007) refer to between- and within-group entropy as respectively unrelated and related variety.
We can show that the decomposition theorem holds for the multidimensional case. Hence, if l∈Sg and j∈Sz(g = 1,…,G; z = 1,…, Z), we can rewrite H(X,Y) as
follows:
∑∑
= = + = G g Z z gz gz Q P H H TV 1 1 (6)where the first term on the right-hand-side is between-entropy and the second term is the (weighted) within-entropy. In particular:
∑∑
= = = ≡ G g Z z gz gz Q P P H UTV 1 1 2 1 log (7)∑∑
= = ≡ G g Z z gz gzH P RTV 1 1 (8) Where:∑ ∑
∈ ∈ = g Z S l j S lj gz p P∑ ∑
∈ ∈ = g z S l j S gz lj gz lj gz P p P p H / 1 log2We can refer, therefore, to between- and within-entropy respectively as unrelated technological variety (UTV) and related technological variety (RTV). The distinction between related and unrelated variety is based on the assumption that any pair of entities included in the former generally are more closely related, or more similar to any pair of entities included in the latter. This assumption is reasonable when a given type of entity (patent, industrial sector, trade categories etc.) is organized according to a hierarchical classification. In this case each class at a given level of aggregation contains “smaller” classes, which, in turn contain yet “smaller” classes. Here, small refers to a low level of aggregation.
We can reasonably expect then that the average pair of entities at a given level of aggregation will be more similar than the average pair of entities at a higher level of aggregation. Thus, what we call related variety is measured at a lower level of aggregation (4 digit class within a 1 digit macro-class) than unrelated variety (across 1 digit macro-classes). This distinction is important because we can expect unrelated (or inter-group) variety to negatively affect MFP growth, while related (or intra-group) variety is expected to be positively related to MFP growth. Moreover, the evolution of total variety is heavily influenced by the relative dynamics of related and unrelated variety, such that if unrelated variety is dominant the effects of total variety on MFP growth can be expected to be negative, while the opposite holds if related technological variety dominates the total index (Krafft et al., 2009).
4) Finally, we need a proxy for technological distance that emphasizes the complementarities among technologies combined within patent applications. A useful index of distance might build on the measure for technological proximity. Such a measure was proposed by Jaffe (1986, 1989), who investigated the proximity of firms’ technological portfolios. Breschi et al. (2003) adapted Jaffe’s index to measure the technological proximity between two technologies.
This index can be considered the inverse of cognitive distance among different technologies.
Cognitive distance, however, measures the degree of dissimilarity among technologies, and can be applied to an investigation of the possible emergence of economies of scope and the effects on economic performance. Based on the general purpose aspects of ICTs, we need to focus here on the degree to which different technologies are related each other in terms of a given piece of knowledge, say a patent, which could not exist without their co-occurrence. Such technologies are complementary, therefore, in that they combine to bring about the knowledge contained in the patent. We thus calculate the coherence (R) of the ICT knowledge base in each country, defined as the average relatedness of any technology randomly chosen from within the sector, with respect to any other technology (Nesta and Saviotti, 2005, 2006; Nesta, 2008).
To calculate the knowledge coherence index requires a number of steps. In what follows we describe its calculation at country level. First, we calculate the weighted average relatedness WARl of technology l with respect to all other
technologies present in the sector. This measure builds on the measure of technological relatedness
τ
lj, which is introduced in Appendix. Following Teeceet al. (1994), WARl is defined as the degree to which technology l is related to all
other technologies j≠l within the country i, weighted by the patent count Pjit:
∑
∑
≠ ≠ = l j jit l j lj jit lit P P WARτ
(9)Finally, the coherence of knowledge base within the sector is defined as the weighted average of the WARlit measure:
∑
∑
≠ × = j l l lit lit lit it P P WAR R (10)It should be noted that this index, implemented by analysing co-occurrences of technological classes within patent applications, measures the degree to which the services rendered by the co-occurring technologies complement one another. The relatedness measure
τ
lj (see the Appendix B) indicates that utilization oftechnology l implies utilization also of technology j in order to perform specific functions, which are not reducible to their independent use. The coherence index is thus appropriate for our purposes in this paper.
We are now able to qualify our working hypotheses by giving them an operational translation. In this paper we hypothesize that the evolution of the knowledge base underlying ICTs is likely to trigger economic growth as long as it is articulated around a wide array of diverse, but highly complementary technologies, while the concentration of emergent variety within well defined boundaries is likely to yield negative effects on technological opportunities and, hence, on economic growth.
More specifically we test the hypothesis that the amount of technological change introduced in an economic system, as measured by total factor productivity growth will be larger:
a) the larger the technological specialization of the knowledge activities within the system;
b) the larger the coherence of the knowledge activities that take place within an economic system;
c) the lower the related and unrelated variety of knowledge activities.
To test this hypothesis econometrically requires us to rewrite equation (1) so as to model the MFP growth rate as a function of the knowledge base characteristics:
∑
=∑
= − − − − + + + + + + + + + = − 15 1 2003 1981 , , , 1 , 1 , 3 1 , 2 1 . , 1 1 , ln ) ln( ln ln ln ) 1 ( ) ( ln i i it t t it it t i t i t i t i t i i i D D MTP e TV c R c RTA c A b a t A t Aε
µ
µ
(11)The second part of Equation (11) comprises the control variables, where µi represents
country fixed effects, µt captures time fixed effects, and MTPi,t-1 refers to the share of multi-technology patents in the ICT sector in each country. The first part of the equation represents the properties of the knowledge base, i.e. revealed technology advantage (RTA), knowledge coherence (R) and total variety index (TV). In order to appreciate the effects of related (RTV) and unrelated (UTV), we estimate Equation (11) alternating the three indexes for variety.
4. The Data
In order to test the working hypothesis proposed in Section 3, we combine a dataset containing information on the economic variables with a dataset of patent applications. The former is used to calculate the MFP index described above. For this purpose we exploit the data on gross domestic product (GDP), labour income, employment and gross fixed capital formation from the OECD Stan database; information on total hours worked is taken from the Groningen Growth and Development Centre (www.ggdc.net).
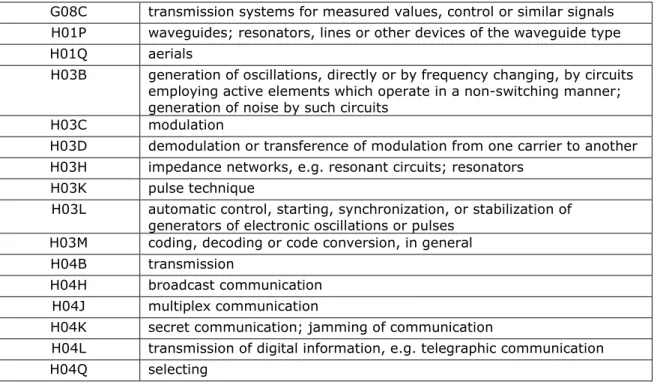
Data on patent applications are drawn from the European Patent Office (EPO)9 dataset (Espacenet). The identification of ICT-related patents is somewhat controversial, due to the criteria used to build the classifications. In particular, the use of the International Patent Classification (IPC) has been criticized for its inherently function-oriented nature (Corrocher et al., 2007). However, several empirical contributions use IPC to identify the borders of the ICT sector. We decided to merge the classification proposed by the OECD with those developed by the French Observatoire des Sciences et des Techniques (OST), in order to achieve a more inclusive representation. These classes are reported in Table 1.
>>>INSERT TABLE 1 ABOUT HERE<<<
9
We are aware this may introduce a “home bias” in the analysis, which could be solved by considering triadic patents. Unfortunately, we are not able to extract the same set of information about triadic patents and thus are obliged to limit our analysis to European patents.
The initial EPO dataset consisted of 115,771 patent applications, which we assigned to countries based on the first two digits of their priority number.10 This allowed us to classify about 90% of the dataset. The time coverage of the dataset was from 1978 to 2006: we focus on the period 1981-2003, and include only countries with observations for at least 22 years. The resulting sample includes 96,149 patent applications, distributed across 14 OECD countries.
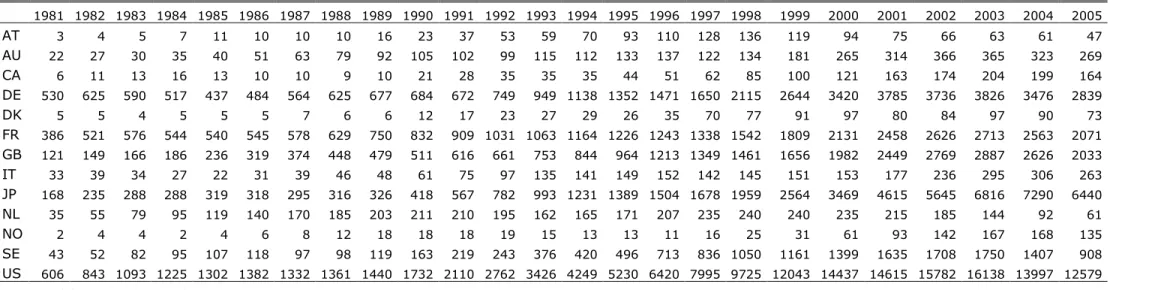
Table 2 presents the dataset showing that the distribution of patent applications in the ICT field is rather skewed, with 42% concentrated in the US. It should be noted that this is a considerable underestimation of the US weight; it would be reasonable to expect that US firms will tend to have more patents registered with the US Patent and Trademark Office (USPTO) than with the EPO. This also applies to Japanese patent applications, which in our case are 15% of the observed total. In sum, 80% of the patents in the telecommunication industry are concentrated in four countries, i.e. the US, Japan, Germany and France, with the UK ranked fifth with a share of about 7% of total patent applications.
>>>INSERT TABLE 2 ABOUT HERE<<<
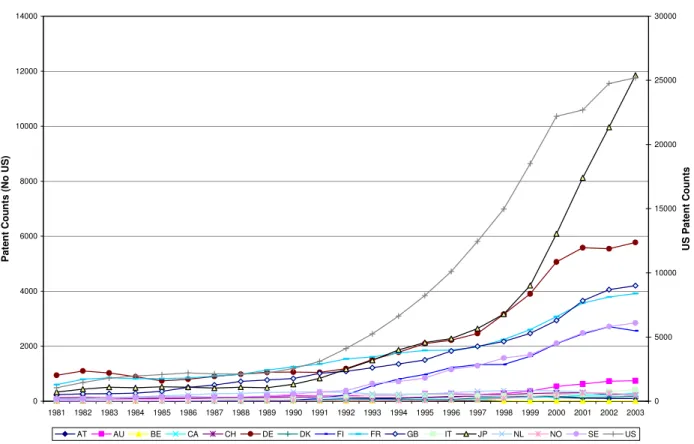
A look at the evolution of patenting in the ICT sector across countries confirms this preliminary evidence. Table 3 and Figure 1 report the breakdown of patent applications by country, cumulated over four years, to allow for the high degree of volatility of patent applications.
>>>INSERT TABLE 3 ABOUT HERE<<< >>>INSERT FIGURE 1 ABOUT HERE<<<
We can see that the gap between the US and the other countries analysed began to widen in the early 1990s (in Figure 1 US data are on the right y-axis). Japan’s patent applications are initially below German and French applications: Japan overtakes France in 1994 and Germany in 2000. Note also that in the earliest years France is ranked higher than Germany and the UK, but was overtaken by Germany in 1995 and
10
The most common means of assigning patents to territorial units is by inventor’s address. Following this procedure is much important when analysing the effects of knowledge spillovers on innovation performance. Although our dataset is quite detailed, we do not have information on inventors’ addresses. However, we analyse the effects of changes to the internal structure of the knowledge base on productivity growth and, therefore, on the use of technological knowledge. Thus, we do not expect that this problem significantly affects our estimates.
by the UK in 2000. We now turn to a detailed analysis of the dynamics of the properties of the ICT knowledge base in the sampled countries, in the context of the stylized facts on the evolution of the ICT sector.
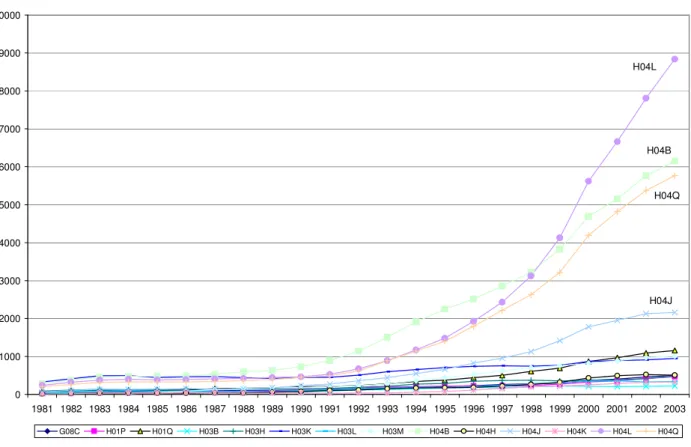
Figure 2 depicts the aggregate dynamics of the core technological classes over time. In the first decade of our analysis there are two groups, based on frequency of technological classes. Most classes are cited in less than a hundred patents in the period 1981-1986, and patent applications appear to be concentrated in a four classes, i.e. H03K (pulse technique), H04B (transmission), H04L (transmission of digital information) and H04Q (selecting). It is interesting that the first two classes, which are related to the communication aspect of ICTs, are the most frequent while the latter two, which are related more to the transmission of data in digital formats, although important are less developed.
INSERT FIGURE 2 ABOUT HERE
From a dynamic viewpoint, the H04B class gained momentum in the early 1990s and continued sustained growth to 2003. The H04Q class followed roughly the same path, although it remained at lower levels in absolute terms. The dynamics of H04L and H04J are also interesting. The former starts to increase at a fairly rapid rate after 1995, and from 1999 onwards is the class most frequently cited in patent applications. This is in line with anecdotal evidence that the convergence of computing and telecommunications technology became central in the 1990s, and 1995 corresponds roughly to the period of massive Internet diffusion and demonstration of its potential (van den Ende and Dolfsma, 2005; Fransman, 2007). The H04J class (multiplex communication) shows a marked increase in the late 1990s, corresponding with the surge in the technologies allowing for fast communication through the asynchronous transmission of digital signals on the existing infrastructures (such as ADSL).
5. Cross-country dynamics of ICT knowledge base: The
empirical evidence
The evolution of ICTs and their diffusion within the economic system have had significant effects on economic performance, renewing productivity gaps between the US and the other advanced countries. A large body of empirical literature documents this phenomenon, ascribing the success of the US economy up to the second half of the 1990s to the ability to trigger demand for ICTs, and the simultaneous rise of the services sector (Jorgenson, 2001).
The continuing US leadership in the ICT sector suggests the existence of a path of continuing exploitation of the technological opportunities uncovered by research in the field. This is the case at least until the early 1990s. The change in technological focus from the component to the content/application layer coincides with a marked discontinuity in technological competences. The parallel developments of the other advanced countries suggests that those with a relatively strong commitment to research in the ICT sectors, have been able, through imitation, to follow the US along this technological path. At the same time, countries with a weaker research focus have experienced a somewhat less favourable dynamics.
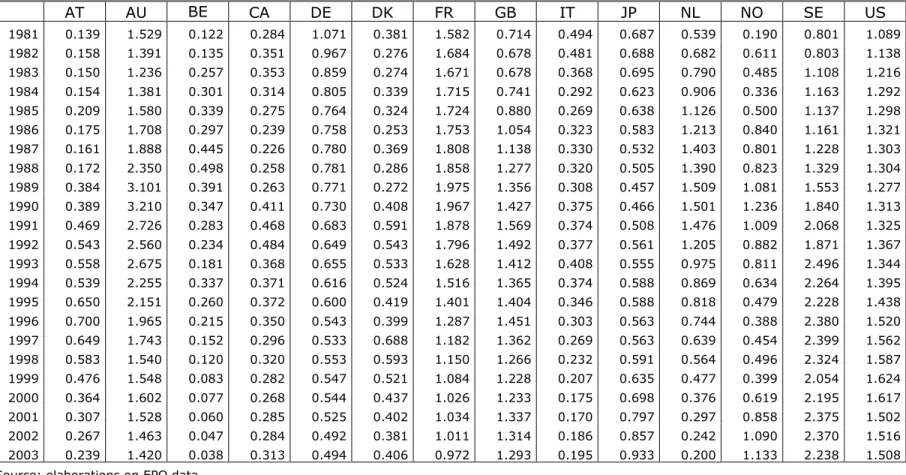
It is important, therefore, to explore the evolution of the relative intensity of research in the sampled countries. Table 4 reports the dynamics of RTA, calculated according to Equation (2). The results of our calculations show that our sample of OECD countries falls roughly into three groups, according to the actual levels of RTA and its dynamics:
i) first, there is a large number of older competitors or the incumbents (including the US, the UK, France, Germany and Australia), which are characterized by relatively high levels of RTA already in the 1980s. Most are characterized by increasing RTA in the 1980s followed by a decrease in the 1990s. The US is an exception in that its RTA in ICT increases continuously during the 1980s and the 1990s, and at an even rate;
ii) second, there is the group of late-leading countries, which includes a few Northern European countries, mainly Norway and Sweden. These countries are characterized by low levels of RTA in the 1980s (especially Norway) and
a steep increase in RTA in the 1990s, allowing them to overcome the group of incumbents;
iii) third, there is the group of laggards, such as Canada, Japan, Italy, etc. These countries exhibit quite low levels of RTA, and it is difficult to identify any pattern of evolution. For example, the RTA index is continuously increasing in the case of Japan, while it is stable for Canada and constantly decreasing for Italy.
>>> INSERT TABLE 4 ABOUT HERE <<<
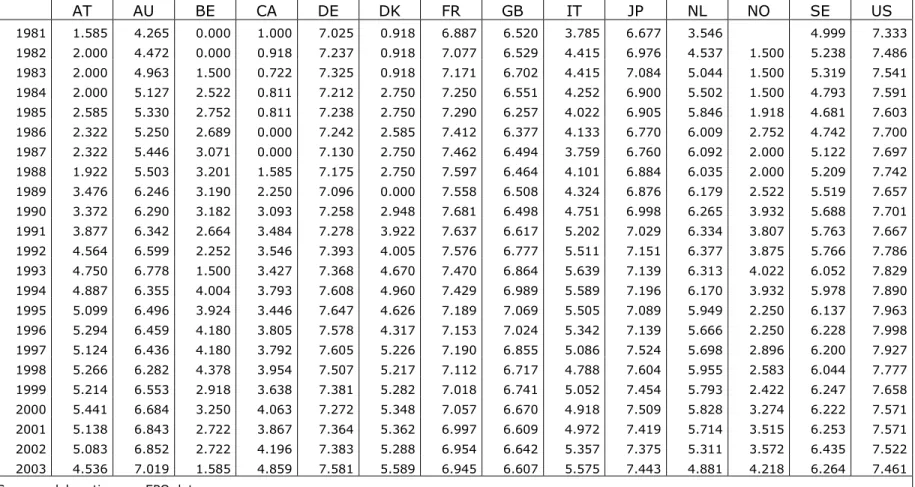
This grouping has some interesting implications in terms of variety indexes. Table 5 reports the breakdown by country of the evolution of general variety, calculated following Equation (4). It is evident that the incumbent countries (the first group) are characterized by the highest levels of the variety index. The dynamics are generally quite stable over time, with the exception of Australia, whose variety index rapidly increased in the 1980s, reaching the same levels as the other countries in the group. Out of the late-leaders, the technological variety index for Sweden increases smoothly during the 1980s, remaining stable in the 1990s at levels very similar to the incumbent countries. The dynamics for Norway are characterized by a marked increase in the 1980s, and a table pattern along the 1990s at levels lower than for Sweden. Finally, the index of variety for the group of lagging countries shows no clear-cut pattern. Japan’s is similar to the incumbent countries, while Austria and Canada are characterized by low levels in the 1980s which increase rapidly in the 1990s.
>>> INSERT TABLE 5 ABOUT HERE <<<
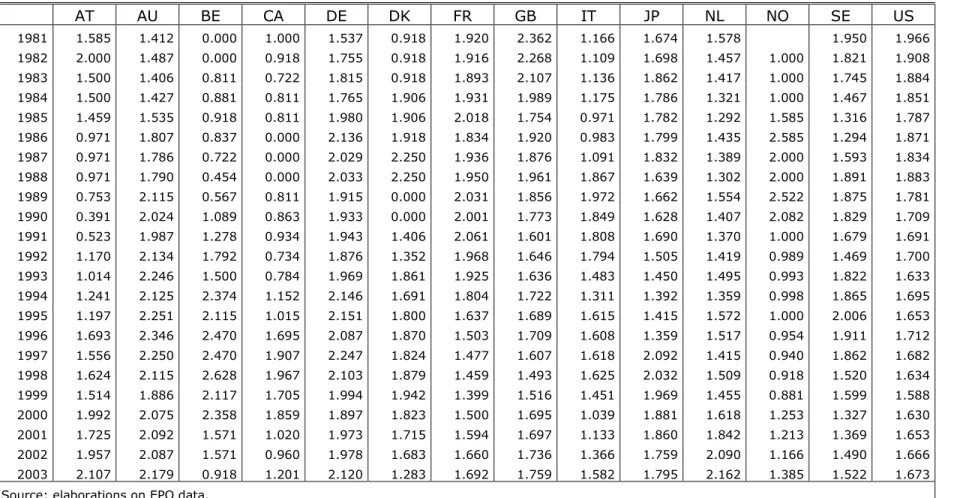
The general variety index can be decomposed into related (Table 6) and unrelated (Table 7) variety, both tables showing that the incumbent group of countries is characterized by high levels of related variety, mostly stable over time, with unrelated variety generally at lower levels across the time span. Late-leading countries generally have high and increasing levels of related variety (though generally below the values for incumbents), and especially in the 1990s, and comparatively low levels of unrelated variety although in the case of Norway in the 1980s, unrelated variety has a higher weight than related variety. In the laggard group, the dynamics for Japan are similar to
that of the incumbents, while for Canada, Austria and Italy, unrelated variety has a comparatively higher weight in the 1980s, and lower weight in the 1990s.
>>> INSERT TABLES 6 AND 7 ABOUT HERE <<<
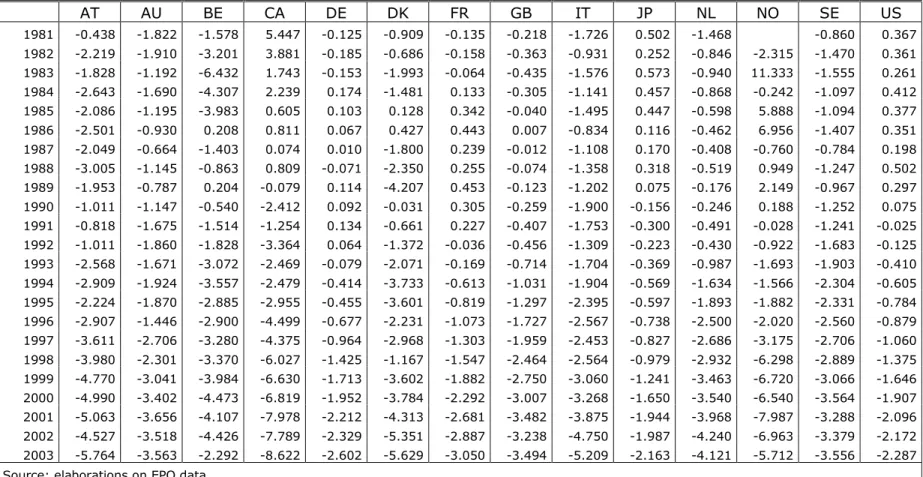
The evidence on RTA and variety is reflected in the dynamics of knowledge coherence (Table 8). US values for knowledge coherence are positive in the first half of the 1980s when research in the ICT sector was focused on the component level, and was exploiting the technological potentials established in the 1960s and 1970s. The emergence of the technical conditions leading to Internet diffusion, and the related shift in technological efforts towards the development of content applications introduced a discontinuity that is reflected in the falling coherence index along the 1990s.
>>> INSERT TABLE 8 ABOUT HERE <<<
Within the group of incumbents, France shows increasing coherence along the 1980s with a positive index in 1984, when then dropped to below zero in the 1990s. The values for Germany during the 1980s fluctuate around zero, being negative until 1983 and then positive up to 1992, and negative for the remainder of the 1990s. The countries in the other two groups are also characterized by dramatic falls in knowledge coherence during the observed period. The evidence for Canada is noteworthy in that in the early 1980s the index is quite high, but decreases over time and in 2003 is lower than any other sampled country.
6. Econometric results
In order to assess the effects of the properties of the knowledge base on MFP, we carried out panel data fixed-effects estimations of Equation (11). The results are reported in Tables 9 and 10. The estimations differ in that in the former we proxied the relative weight of ICTs in each country by the ratio between ICT knowledge stock and total knowledge stock, following Equation (1). In the latter (Table 10) we use the RTA index, which gives us information on the relative technological specialization of each country in the ICT sector.
Table 9 column (1) reports the estimation by considering total variety. The coefficient of the share of knowledge stock produced in the ICT sectors has a positive and
significant sign. As expected, productivity growth is likely to grow as the share of ICT-related knowledge increases. The coefficient of knowledge coherence is also positive and significant. Again, consistent with our working hypotheses, the clustering of knowledge generating activities around a distinctive core of technologies is likely to enhance the innovation process and trigger productivity growth. The higher is the degree of internal coherence of the knowledge base, the better the economic performance.
The negative and significant sign for variety is also in line with our theoretical framework and does not contradict existing firm and regional level evidence (Nesta, 2008; Quatraro, 2008). Our results do contrast with the findings of recent empirical studies on the effects of technological diversity on firms’ innovative performance, which show positive and significant coefficients (Nesta and Saviotti, 2005; Leten et al., 2007; Garcia-Vega, 2006; D’Este, 2005). However, we cannot compare the findings from these studies with the present analysis for a number of reasons. First, most of these studies focus on the effects of technological diversification on innovation performance, using patent numbers as a dependent variable. It would be expected that an increase in patents will be accompanied by an increase in technological diversity (and vice versa). However, this does not necessarily apply to productivity, which measures the extent to which profitable innovations have been successfully adopted by economic agents. Moreover, technological diversity is proxied either by the inverse Herfindahl index or by a measure of technological scope, which is different from measuring technological variety based on information entropy. We should also add that all the studies referred to above consider the occurrence of a single technological class, and not combinations of technological classes whereas our study investigates the effects on productivity growth of technological variety captured by the overlapping of technological classes as measured by the co-occurrence of technological classes within the same patent. The use of multidimensional information entropy allows us to quantify the extent to which growth in technological activity is characterized by an increase in the observed combinations of technological classes (Saviotti, 1988).
Our results confirm that search processes directed towards new technological fields, leading to previously untried knowledge recombination, characterize the changes in the technological environment. During the early phases of this process, information entropy is likely to increase. Once the technological system is established, the technological environment becomes relatively stable. Establishment of the technological system is characterized by the likely introduction of incremental innovations within well defined technological boundaries.
During the mature stage of the technology lifecycle innovation activities are likely to be directed towards the search for new applications of the knowledge base, featuring the particular technological system. These applications may well be outside the original technological boundaries, but may still be profitable, as in the case of the application of ICTs to the manufacture of medical devices, which is the same as our measure of unrelated variety. However, the increase in unrelated variety leads to an increased probability of less fertile combinations being explored. For this reason, at the aggregate level we would expect unrelated variety to have a negative effect on productivity growth. The opposite argument holds in the case of related variety, which is likely to characterize the establishment of the technological system and the phase of exploitation of its technological opportunities.
At a general level it is difficult, therefore, to predict the sign of the economic effects of technological variety, as they are largely influenced by the relative stage of development of the technological system under scrutiny, and by the associated dominance of related and unrelated variety. Diminishing returns to variety are likely to emerge in the mature stage when technological activities are featured by random screening across brand new combinations. As a consequence, when unrelated (related) variety shapes the evolution of technological variety, this latter is likely to have a negative (positive) effect on economic performance (Krafft et al., 2009).
>>>INSERT TABLE 9 ABOUT HERE<<<
We need to understand which of these two factors is likely to drive total variety. In columns (2) and (3) of Table 9 the index is articulated respectively as unrelated and related variety. Nevertheless, the results seem consistent with our argument of
diminishing returns to recombination. The econometric findings show that the effect of related variety on productivity growth is not statistically significant, while the coefficient of unrelated variety is negative and significant. This means that the observed negative effect of technological variety is driven by its “unrelated” component. This result is consistent with the evidence on knowledge coherence, which again has a positive and significant coefficient. The increase in knowledge coherence is likely to be associated with increasing productivity growth rates. When knowledge coherence increases, then unrelated variety will fall or related variety will increase, or both. Our results shows that the patterns of productivity growth are characterized by a decrease in unrelated variety and non-significant changes in related variety.
Table 10 presents the results for the estimations including the RTA instead of ICTK. The coefficient of the RTA is positive and significant (Column (1)). This amounts to saying that the degree of relative technological specialization of countries in ICT has a positive effect on productivity growth. Productivity gaps, therefore, may be ascribed in part to the different technological focus of countries. Knowledge coherence has a positive and significant sign, in line with the previous estimation and the general theoretical framework underpinning the analysis. Total variety index, again, is negatively related to MFP growth and in this case calls for a deeper understanding of the relative impact of related and unrelated variety.
>>> INSERT TABLE 10 ABOUT HERE <<<
Columns (2) and (3) respectively present the effects of unrelated and related variety. Overall, the results are very similar to the previous estimations. The positive and significant sign of knowledge coherence is persistent across models and estimations, confirming the robustness of this result, and the coefficients of related and unrelated variety are in line with the previous estimation. The negative effects of technological variety seem to be driven by unrelated variety: the coefficient is negative and significant. Related variety does not seem to have an appreciable effect on cross-country differential growth rates.
The results of our estimations provide support for the hypothesis that the generation of knowledge in the ICT sector is likely to trigger productivity growth due to the inherent
general purpose character of the technology. ICTs emerged from the recombination of a number of distinct bits of knowledge, from different technological fields, but with high degrees of complementarity. Failure to bring together complementary knowledge is likely to result in reduced knowledge coherence and an increase in unrelated variety, both of which are detrimental to productivity growth.
7. Conclusions
The dynamics of knowledge generation is a challenging area of investigation. According to a growing literature on the system dynamics of technological change, new knowledge emerges from the recombination of existing knowledge. The characteristics of the map into which the recombination process takes place are most important. Knowledge recombination is more effective and fertile when and where the different knowledge items available are characterized by lower levels of variety and higher levels of specialization and coherence. In these circumstances recombination takes place more effectively and it can lead to the introduction of a new technological system. Knowledge recombination in this case is a process whose onset is characterized by the convergence of a core of complementary technologies. The steps that follow are fuelled by the gradual spread of the core to a growing number of other knowledge fields. Eventually, diminishing returns to knowledge recombination emerge.
Analysis of the co-occurrences of technologies within patent stocks allows us to study empirically the dynamics of knowledge recombination. Co-occurences can be considered a reliable indicator of the overlapping of a new knowledge across existing technological classes. Frequency is relevant: only a few patents fall within just one technological class. The distribution of these co-occurrences and their dynamics can reveal key information about the emergence of new core technologies and their eventual growth into technological systems. Representing the knowledge base as a network, with an emphasis on its dynamic aspects, enables the identification of the changing structure of technological knowledge.
In this paper we applied this theoretical framework and related empirical methodology, to the ICT sector, for the period 1983 to 2003. ICTs have been a major source of new technological knowledge and technological innovations, and became the engine of economic growth in the advanced countries in the last two decades of the 20th century and the first years of the 21st century.
The rich empirical evidence on the dynamics of technological knowledge derived from analysis of the co-occurrence of technological classes within patents issued by the EPO in the period 1981-2003, across the different classes, has enabled the identification of a clear sequence in the development of technological knowledge. Following a period of concentrated technological advance in a few patent classes, we identified a phase of sustained recombinant growth.
Systematic exploration of the knowledge base using measures such as related and unrelated variety, coherence and cognitive distance, confirm that the grafting of recombinant ICT knowledge onto an increasing array of other patent classes has characterized the growth of technological knowledge since the 1980s. The structure of the knowledge base varies across countries and over time. Based on our evidence, countries can be categorized in three groups. The first consists of the older incumbents and includes the US, the UK, France, Germany and Australia, which, already in the 1980s, were characterized by relatively high levels of knowledge stock. The second is a group of fast-leading countries including Norway and Sweden, which are characterized by a low level knowledge base in the 1980s but show a steep increase in the 1990s. The third group gathers together laggards such as Canada, Italy, etc..
Our dynamic network analysis of the evolution of knowledge co-occurrence in two or more patenting classes has identified a clear pattern of evolution of the knowledge base. The incumbent group was the first to undergo a process of branching out of ICT knowledge, and a sustained phase of recombinant growth of the knowledge base. Digital knowledge promoted the emergence of new technological knowledge in a wide variety of other technological fields. Other fast moving countries have proved able to
catch-up to an extent but the laggards have been excluded from the benefits of recombinant growth.
Our empirical results support the basic hypothesis that the evolution of the knowledge base underlying ICTs in the form of recombinant knowledge, has favoured economic growth through the application of new a core of highly complementary technologies. Attempts to extend knowledge recombination efforts beyond well defined boundaries of strong complementarity, show a decline in technological opportunities with negative effects on the rates of increase of MFP and, hence, economic growth. Countries best able to master recombinant dynamics have proven able to achieve more rapid increase of their MFP growth.
Appendix A - Multifactor productivity calculations
In order to investigate the effects of the characteristics of ICT knowledge base on productivity growth, we first calculate an index of multi factor productivity (MFP) following the standard growth accounting approach (Solow, 1957; Jorgenson, 1995; OECD, 2001). We start by assuming that the national economy can be represented by a general Cobb-Douglas production function with constant returns to scale:
it it it it it it A C L Y = α β (A1)
where Lit is the total hours worked in country i at time t, Cit is the level of the capital
stock in country i at time t, and Aitis the level of MFP in country i at time t.
Following Euler’s theorem, output elasticities are calculated (not estimated) using accounting data, assuming constant returns to scale and perfect competition in both product and factor markets11. The output elasticity of labour therefore is computed as the factor share in total income:
t i t i t i t i, =(w,L,)/Y, β (A2) t i t i, 1 β, α = − (A3)
where w is the average wage rate in country i at time t. Thus, we obtain elasticities that vary both over time and across countries.
The discrete approximation of the annual growth rate of MFP can be calculated in the usual way:
11
We acknowledge that these may turn out to be very strong assumptions. Nonetheless such approach, fairly common in the literature about the determinants of productivty growth, has the advantage of allowing for the calculation of different inputs’ elasticities for each country at each time. It therefore accounts for cross-sectional and time variation.