HAL Id: hal-01261122
https://hal.archives-ouvertes.fr/hal-01261122
Submitted on 23 Jan 2016
HAL is a multi-disciplinary open access
archive for the deposit and dissemination of
sci-entific research documents, whether they are
pub-lished or not. The documents may come from
teaching and research institutions in France or
abroad, or from public or private research centers.
L’archive ouverte pluridisciplinaire HAL, est
destinée au dépôt et à la diffusion de documents
scientifiques de niveau recherche, publiés ou non,
émanant des établissements d’enseignement et de
recherche français ou étrangers, des laboratoires
publics ou privés.
Distributed under a Creative Commons Attribution - ShareAlike| 4.0 International
License
Country-scale Exploratory Analysis of Call Detail
Records through the Lens of Data Grid Models
Romain Guigourès, Dominique Gay, Marc Boullé, Fabrice Clérot, Fabrice
Rossi
To cite this version:
Romain Guigourès, Dominique Gay, Marc Boullé, Fabrice Clérot, Fabrice Rossi. Country-scale
Ex-ploratory Analysis of Call Detail Records through the Lens of Data Grid Models. European Conference
on Machine Learning and Principles and Practice of Knowledge Discovery in Databases, Sep 2015,
Porto, Portugal. �10.1007/978-3-319-23461-8_3�. �hal-01261122�
of Call Detail Records
through the Lens of Data Grid Models
?Romain Guigour`es1, Dominique Gay2, Marc Boull´e2,
Fabrice Cl´erot2, and Fabrice Rossi3
1 Zalando
Berlin, Germany
2 Orange Labs
Lannion, France
3 SAMM EA 4543, Univerist´e Paris 1
Paris, France
Abstract. Call Detail Records (CDRs) are data recorded by telecom-munications companies, consisting of basic informations related to sev-eral dimensions of the calls made through the network: the source, des-tination, date and time of calls. CDRs data analysis has received much attention in the recent years since it might reveal valuable information about human behavior. It has shown high added value in many applica-tion domains like e.g., communities analysis or network planning. In this paper, we suggest a generic methodology based on data grid mod-els for summarizing information contained in CDRs data. The method is based on a parameter-free estimation of the joint distribution of the variables that describe the calls. We also suggest several well-founded criteria that allows one to browse the summary at various granularities and to explore the summary by means of insightful visualizations. The method handles network graph data, temporal sequence data as well as user mobility data stemming from original CDRs data. We show the rel-evance of our methodology on real-world CDRs data from Ivory Coast for various case studies, like network planning strategy and yield man-agement pricing strategy.
1
Introduction
Telco operators’ activities generate massive volume of data, mainly from three sources: networks, service platforms and customers data bases. Particularly, the use of mobile phones generates the so called Call Detail Records (CDRs), con-taining information about end-point antenna stations, date, time and duration of the calls (the content of the calls is excluded). While this data is initially stored for billing purpose, useful information and knowledge (related to human mobility [23, 1], social interactions [22] and economic activities) might be derived from the large sets of CDRs collected by the operators.
?
Recent studies have shown the potential added-value of analyzing such data for several application domains: United Nations Global Pulse [21] sums up some recent research works on how analysis of CDRs can provide valuable information for humanitarian and development purposes, e.g., for disaster response in Haiti, combating H1N1 flu in Mexico, etc. Also, leveraging country-scale sets of CDRs in Ivory Coast, the recent Orange D4D challenge (Data For Development [5]) has given rise to many investigations in several application domains [4] such as health improvement, analysis of economic indicators and population statistics, communities understanding, city and transport planning, tourism and events analysis, emergency, alerting and preventing management, mobile network in-frastructure monitoring. Thus, the added-value of analysis of CDRs data does not need to be proved any longer.
Various classical data mining techniques [4] have been applied on CDRs data depending on the features and the task considered: e.g., considering network graphs from (source antenna, destination antenna) data or temporal sequences from (source antenna, date) data appeals for different clustering techniques for summarizing information in the data.
Contribution: in this paper, we suggest an efficient and generic methodology for summarizing CDRs data whatever the features are retained in the analysis. The method is based on data grid models [6], a parameter-free joint distribu-tion estimadistribu-tion technique that simultaneously partidistribu-tions sets of values taken by each variable describing the data (numerical variables are discretized into in-tervals while the categories of categorical variables are grouped into clusters). The resulting data grid – that can be seen as a coclustering – constitutes the summary of the data. The method is thus able to summarize various types of data stemming from CDRs: network graph data, temporal sequence data as well as user mobility data. We also suggest several criteria (i) to exploit the resulting data grid at various granularities depending on the needs of analysis and (ii) to interpret the results through meaningful visualizations. The whole methodology aims at demonstrating strong impacts on two key points on economic strategy: network planning and pricing strategy.
Outline: in the next section, we discuss further recent work related to CDRs and mobile phone trace data analysis as well as data grid models. In Section 3, we summarize the impacts of the various case studies on the economic development strategy related to the specific context of telecommunications in Ivory Coast. A brief description of the CDRs data characteritics is also given. Section 4 recalls the main principles of data grid models and introduces the tools for exploiting the resulting data grid. In section 5, we report the experimental results on the various case studies.
2
Related Work
CDRs data have received much attention in recent years. Famous applications of CDRs data analysis are for the benefit of social good: e.g., in the transportation domain, [2] suggest a system for public transport optimization; in the health
domain, e.g., [8] suggest a model for epidemic spread.
Mobile phones may also provide other types of data (e.g., the Nokia Mobile Data Challenge [15]), like applications events, WLAN connection data, etc. For instance, [13] pre-processed phone activities of one million users to obtain infor-mation about their approximative temporal location, then mined daily motifs from the spatio-temporal data to infer human activities. Finally, smart phones are or will be equipped with accelerometers and/or gyroscopes providing data about physical activities of users: [16] suggest a complete system of activity recognition based on smartphone accelerometers with potential application to health monitoring.
Research work related to data grid models: We are not coclustering data (ob-jects × attributes) like pioneering work of Hartigan [12]. Data grid models are related to the work of Dhillon et al. [7] who have proposed an information-theoretic coclustering approach for two discrete random variables Y1and Y2: the
loss in Mutual Information M I(Y1, Y2) − M I(Y1M, Y2M) is minimized to obtain
a locally-optimal grid with a user-defined number of clusters for each dimension. This is limited to two variables and requires to choose the number of clusters per variable. Going beyond 2D matrices, recent significant progress has been done in multi-way tensor analysis [19, 14]. Dealing with k-adic data, (also known as co-occurrence data, like contingency table), [17] suggest a coclustering method for social network and temporal sequence (with pre-discretization of time). The Information Bottleneck (IB) method [20] stems from another information-theoretic paradigm: given the joint probability P (X, Y ), IB aims at grouping X into clusters T in order to both compress X and keep as much informa-tion as possible about Y . IB also minimizes a difference in Mutual Informa-tion: M I(T, X) − βM I(T, Y ), where β is a positive Lagrange multiplier. Wang et al. [24] build upon IB and suggest a coclustering method for two categori-cal variables. Extending IB for more than two categoricategori-cal variables, Slonim et al. [18] have suggested the agglomerative multivariate IB that allows construct-ing several interactconstruct-ing systems of clusters simultaneously; the interactions among variables are specified using a Bayesian network structure.
To the best of our knowledge, our summarization approach is the only one to combine the following advantages: it is parameter-free, scalable and can be ap-plied to mixed-type attributes (categorical, numerical, thus multiple types of time dimensions without pre-processing). Therefore, the same generic method can be used to analyze network graph, temporal sequence and mobility data.
3
Impacts on economic strategy
Besides the high-level knowledge extracted from country-scale data and con-firmed by local sociologists from the University of Bouak´e in Ivory Coast, these studies have also a strong impact on future economic development strategy, mainly in two identified branches:
– Network planning strategy: In 2014, there are around 20M inhabitants in Ivory Coast and the mobile service penetration rate is ' 84% – with a
still growing mobile phone market in a context of demographic growth. The analyses of the first two case studies and the resulting map projections (that can be seen as the network of calls available at various granularities, see Sec-tions 5.1 and 5.2) are considered as an additional input for network planning and investment; for instance to help network designer in answering questions about how many and where the next antennas have to be set while preserving the quality of service at a reasonable cost.
– Yield management pricing strategy: a part of the pricing policy, called Bonus Zone, established in Ivory Coast offers discount prices (from 10% to 90%) to calling users depending on the location and hour of the emitting call. Maps and calendars resulting from the last two case studies on temporal distribu-tion of output calls (see Secdistribu-tion 5.3) and on mobility data (see Secdistribu-tion 5.4) that are available at various granularities, provide valuable information to economic analysts in order to design optimized spatio-temporal pricing pol-icy in the context of Bonus Zone.
Data description & studies. The CDRs data under study come from the Orange D4D challenge4 (Data For Development [5]). We consider several case
studies on two anonymized CDRs data sets from Ivory Coast, namely commu-nication data and mobility data:
Case studies on communication data. Communication data consists in 471 mil-lions mobile calls and covers a 5-month period (from 2011, December 1st to 2012, April 28th). The records are described by the four following variables: emitting antenna (1214 categorical values); receiving antenna (1216 categorical values); time of call (with hour precision); date of call (from 2011/12/01 to 2012/04/28). From this data set, we consider three subsets for:
1. Analysis of call network between antennas. Considering emitting antennas, receiving antennas and the calls made between antennas, the data set can be seen as a directed multigraph where nodes are antennas and links are the calls between antennas.
2. Analysis of output traffic w.r.t. date of call. We consider emitting antennas and the number of days for each call from referral to first day of recording. This data set can be considered as a temporal event sequence spanning over the whole observation period, where the time is the number of days passed and the events are the emitting antenna IDs.
3. Analysis of output traffic w.r.t. week day and hour of call. We consider emit-ting antennas, the day of the week (stemming from the date and considered as a numerical variable) and the hour of the day for each call. Here the time dimension is represented by two variables and the data of the whole period are folded up to week day and hour.
Case studies on mobility data. Mobility data consists in mobility traces of 50000 users over a 2-week period (from 2012 December 12th to 2012 December 24th),
4
i.e. approximatively 55 millions records. The records are described by the four following variables: anonymized user ID (50000 categorical values); connexion antenna (1214 categorical values); time of call (minute precision); date fo call (from 2012/12/12 to 2012/12/24).
From this data, we consider the user trajectories (identified by user ID) inside the network for the following analysis:
1. Analysis of user mobility w.r.t. week day and hour. We consider the user ID, antennas, week day and hour. This data set can be considered as a set of spatio-temporal footprints, where each user ID is associated with a sequence of antenna usage over the time dimension. Here again, the time dimension is represented by two variables and the data of the whole period is folded up to week day and hour.
4
Exploratory analysis through data grid models
Data grid models aim at estimating the joint distribution between K variables of mixed-types (categorical as well as numerical). The main principle is to si-multaneously partition the values taken by the variables, into groups/clusters of categories for categorical variables and into intervals for numerical variables. The result is a multidimensional (K-d) data grid whose cells are defined by a part of each partitioned variable value set. Notice that in all rigor, we are working only with partitions of variable value sets. However, to simplify the discussion we will sometime use a slightly incorrect formulation by mentioning a “partition of a variable” and a “partitioned variable”.
In order to choose the “best” data grid model M∗(given the data) from the model space M, we use a Bayesian Maximum A Posteriori (MAP) approach. We explore the model space while minimizing a Bayesian criterion, called cost. The cost criterion implements a trade-off between the accuracy and the robustness of the model and is defined as follows:
cost(M ) = − log(p(M | D) | {z } posterior ) ∝ − log(p(M ) | {z } prior × p(D | M ) | {z } likelihood )
Thus, the optimal grid M∗ is the most probable one (maximum a posteriori) given the data. Due to space limitation, the details about the cost criterion and the optimization algorithm (called khc) are available in appendix of [11]. Here-after, we focus on the tools for exploiting the grid and their applications on large-scale CDRs data. The key features to keep in mind are: (i) khc is parameter-free, i.e., there is no need for setting the number of clusters/intervals per dimension; (ii) khc provides an effective locally-optimal solution to the data grid model con-struction efficiently, in sub-quadratic time complexity (O(N√N log N ) where N is the number of data points). Figure 1 illustrates the input data and output results of khc on an examplary mobility data stemming from CDRs.
IdUser Date Time O-Antenna D-Antenna u1 14/07/2014 07:25:02 A1 A25 u1 14/07/2014 07:57:22 A2 A2 u1 14/07/2014 09:05:57 A2 A16 u1 14/07/2014 10:32:16 A2 A25 . . . . u4 11/11/2014 22:52:32 A11 A17
(a) Toy example of CDRs data. Here, mobility data (grey columns): UserId, Time, OriginAntenna.
UserId Time
An
tenna
(b) Resulting 3D data grid with 2 clus-ters of users, 4 time intervals and 3 clusters of antennas.
Fig. 1: From 3D mobility data, stemming from CDRs data, to data grid.
4.1 Data grid exploitation and visualization
Because of the very large number observations in CDRs data, the optimal grid M∗ computed by khc can be made of hundreds of parts per dimension, i.e.,
millions of cells, which is difficult to exploit and interpret. To alleviate this is-sue, we suggest a grid simplification method together with several criteria that allow us to choose the granularity of the grid for further analysis, to rank val-ues in clusters and to gain insights in the data through meaningful visualizations. Dissimilarity index and grid structure simplification. We suggest a sim-plification method of the grid structure that iteratively merge clusters or adjacent intervals – choosing the merge generating the least degradation of the grid qual-ity. To this end, we introduce a dissimilarity index between clusters or intervals which characterize the impact of the merge on the cost criterion.
Definition 1 (Dissimilarity index). Let c.1and c.2be two parts of a variable
partition of a grid model M . Let Mc.1∪c.2 be the grid after merging c.1 and c.2.
The dissimilarity ∆(c.1, c.2) between the two parts c.1 and c.2 is defined as the
difference of cost before and after the merge:
∆(c.1, c.2) = cost(Mc.1∪c.2) − cost(M ) (1)
When merging clusters that minimize ∆, we obtain the sub-optimal grid M0 (with a coarser grain, i.e. simplified) with minimal cost degradation, thus with minimal information loss w.r.t. the grid M before merging. Performing the best merges w.r.t. ∆ iteratively over the K variables without distinction, starting from M∗ until the null model M∅, K agglomerative hierarchies are built and
the end-user can stop at the chosen granularity that is necessary for the analysis while controlling either the number of clusters/cells or the information ratio kept in the model. The information ratio of the grid M0 is defined as follows:
IR(M0) = cost(M 0) − cost(M ∅) cost(M∗) − cost(M ∅) (2)
where M∅ is the null model (the grid with a single cell).
Typicality for ranking categorical values in a cluster. When the grid is coarsen during the hierarchical agglomerative process, the number of clusters per categorical dimension decreases and the number of values per cluster increases. It could be useful to focus on the most representative values among thousands of values of a cluster. In order to rank values in a cluster, we define the typicality of a value as follows.
Definition 2 (Typical values in a cluster). For a value v in a cluster c of the partition YM of dimension Y given the grid model M , the typicality of v is
defined as: τ (v, c) = 1 1 − PYM(c) × X cj ∈YM cj 6=c PYM(cj)(cost(M |c \ v, cj∪ v) − cost(M )) (3)
where PYM(c) is the probability of having a point with a value in cluster c, c \ v is
the cluster c from which we have removed value v, cj∪v is the cluster cj to which
we add value v and M |c \ v, cj∪ v the grid model M after the aforementioned
modifications.
Intuitively, the typicality evaluates the average impact in terms of cost on the grid model quality of removing a value v from its cluster c and reassigning it to another cluster cj 6= c. Thus, a value v is representative (say typical) of a cluster
c if v is “close” to c and “different in average” from other clusters cj6= c. Notice
that this measure does not introduce any numerical encoding of the categories of the categorical variable under study.
Insightful visualizations with Mutual Information. It is common to visu-alize 2D coclustering results using 2D frequency matrix or heat map. For KD coclustering, it is useful to visualize the frequency matrix of two variables while selecting a part of interest for each of K − 2 other variables. We also suggest an insightful measure for co-clusters to be visualized, namely, the Contribution to Mutual Information (CMI) – providing additional valuable visual information inaccessible with only frequency representation. Notice that such visualizations are also valid whatever the variable of interest.
Definition 3 (Contribution to mutual information). Given the K − 2 se-lected parts ci3...iK, the mutual information between two partitioned variables
YM
1 and Y2M (from the partition M of Y1 and Y2 variables induced by the grid
model M ) is defined as:
M I(Y1M; Y2M) = J1 X i1=1 J2 X i2=1 M Ii1i2 where M Ii1i2= p(ci1i2) log p(ci1i2) p(ci1.)p(c.i2) (4)
where M Ii1i2 represent the contribution of cell ci1i2 to the mutual
is the expected probability in case of independence, i.e., the product of marginal probabilities.
Thus, if M Ii1i2 > 0 then p(ci1i2) > p(ci1.)p(c.i2) and we observe an excess
interaction between ci1.and c.i2 located in cell ci1i2 defined by parts i1 of Y
M 1
and i2 of Y2M. Conversely, if M Ii1i2 < 0, then p(ci1i2) < p(ci1.)p(c.i2), and we
observe a deficit of interactions in cell ci1i2. Finally, if M Ii1i2 = 0, then either
p(ci1i2) = 0 in which case the contribution to MI and there is no interaction or
p(ci1i2) = p(ci1.)p(c.i2) and the quantity of interactions in ci1i2 is that expected
in case of independence between the partitioned variables.
The visualization of cells’ CMI highlight valuable information that is local to the K − 2 selected parts and bring complementary insights to exploit the summary provided by the grid.
5
Exploration results
Each application of khc (available at http://www.khiops.com) for the vari-ous case studies data is achieved within a day of computation on a commodity computer – which confirms the efficiency of the method.
5.1 Analysis of call network between antennas
The application of data grid models on the CDRs provides a segmentation with 1150 clusters, that corresponds to nearly one antenna per cluster. This is due to the large amount of data – 471 millions CDRs. Indeed, the number of calls is so high for each antenna that the distribution of calls originating from (resp. terminating to) each antenna can be distinguished from each other. In order to
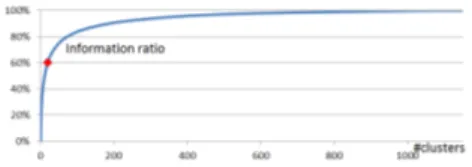
Fig. 2: Evolution of the information kept in the data grid model w.r.t. the number of clusters using the as-cending hierarchical post-processing – from optimal data grid M∗(100%) to the null model M∅ (0%).
obtain a more interpretable segmentation, we apply the post-processing intro-duced in the Section 4.1. Figure 2 shows the information ratio (see definition 1) versus the number of clusters for all intermediate models obtained during the ascending hierarchical post-processing. Interestingly, the resulting Pareto curve shows that very informative models are obtained with few clusters. In our study, we decrease the number of clusters until keeping 60% of the model informativ-ity – corresponding to 20 clusters, an admissible number for the interpretation. Throughout the simplification process, both partitions of source and target an-tennas stay identical. Thus we consider only the partition of source anan-tennas
for the rest of the study. Those clusters are projected on a map of Ivory Coast in Figure 3. Antennas are identified using dots, which color matches with the cluster they belong to.
The first observation is the strong correlation between the clusters and the geography of the country. Indeed, antennas from a same cluster are close to each other. The size of the clusters is almost the same in terms of area and match with the administrative zones of the country, except for Abidjan, the economic capital, which is split into four clusters. This is due to the high concentration of antennas in the city (32% of the ivorian antennas) and the dense phone traffic (34% of the calls).
We use the typicality (see
defini-Fig. 3: Twenty clusters displayed on Ivory Coast map. There is one color per cluster.
tion 2) to rank the antennas of each cluster. The place, where the antenna with the highest typicality is located, is used to label the cluster. On the map in Figure 3, the size of the dots are proportional to the antenna typ-icality. Most typical antennas are lo-cated in the main cities of Ivory Coast. This phenomenon has already been observed in [3] and [10]: the discov-ered clusters match with the area of influence of the main cities of a coun-try. We observe few exceptions: the cluster of the city of Sassandra con-tains the antennas of the city of Divo, while Divo is almost 4 times bigger than Sassandra (population wise) and is the sixth Ivorian city. Antennas in Divo are 40% less typical than the ones in Sassandra, meaning that allo-cating them to another cluster would be less costly for the criterion. Actu-ally, calls emitted from Divo are sig-nificant in direction to other regions of Ivory Coast whereas calls from Sas-sandra are more internal to its region.
In more formal terms, the calls distributions of the antennas in Divo are closer to the marginal distribution than to its cluster’s distribution. This observation is not really surprising because Divo has experienced a recent growth of its pop-ulation, due to migrations within the country [9]. Divo is also located in an area specialized in the intensive farming, that attracts seasonal workers from other parts of Ivory Coast.
Now, focusing on the segmentation of Abidjan: the city is divided into four parts with a strong socioeconomic correlation. The first cluster – in red in
Figure 3 – covers central Abidjan, including the Central Business District (le Plateau), the transport hub (Adjam´e) and the embassies and upper class area (Cocody). The second cluster – in light green – is located in the South of the city. The covered neighborhoods are mainly residential areas and ports. Note that this cluster and the previous one are separated by a strip of sea, except for its North part that is included in the previous cluster. This very localized neigh-borhood matches with the party area of Abidjan. Finally, the last two clusters group antennas located in two areas with a similar profile: these are lower class neighborhoods. These clusters are separated not only because they are located in different parts of the city but especially because their call distribution differs: Abobo in dark blue and Yopougon in grey in the Figure 3.
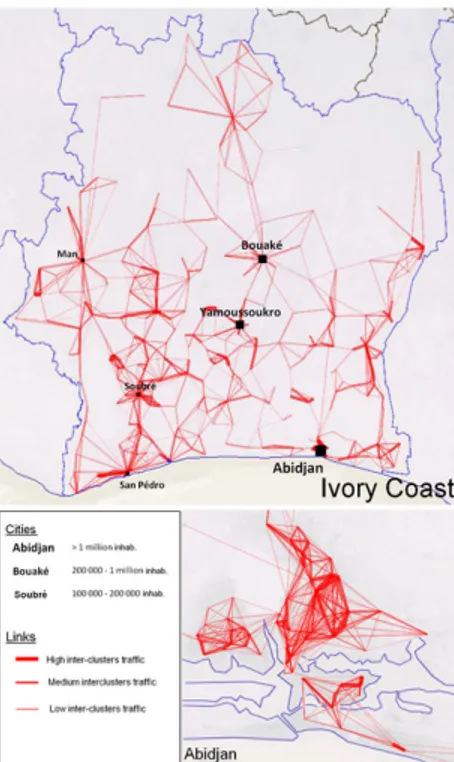
Traffic between clusters. Now, we
Fig. 4: Analysis of Excess of calls be-tween clusters of antennas
analyze the distribution of calls be-tween clusters of antennas using the contribution to the mutual informa-tion. We suggest to visualize the lacks and excesses of calls between the clus-ters, compared to the expected traf-fic in case of independence. Whatever the granularity level of the clustering, we observe a strong excess of calls from the clusters to themselves and weaker excesses and lacks between clus-ters. Studying the traffic within the clusters has a limited interest. We only focus on the inter-clusters traffic. To visualize the traffic between clusters, we use a finer clustering than previ-ously. Here, we have 355 clusters for 95% informativity (see Figure 2).
Figure 4 depicts the excesses of traffic between clusters – highlighted with red segments. The end points of the segments are drawn at the posi-tions of the most representative an-tennas of the associated clusters (i.e with the highest typicalities). The
opac-ity of a segment is proportional to the value of the contribution to mutual in-formation and its width is proportional to the number of calls between clusters. The biggest cities – like Bouak´e, San Pedro and Man – are clearly marked on the map: they are regional capitals, a fact that is confirmed and highlighted by the call traffic visualization. The case of Bouak´e is particularly interesting: although it is not the country capital, its national influence seems bigger than the one of Yamoussoukro, the actual capital. Yamoussoukro is twice smaller than Bouak´e (population wise) and is a quite recent city where there is no major economical
activity, contrary to Bouak´e. This fact can explain our observation.
We also observe that excess of traffic between major cities is a rare phenomenon. Cities are more like phone hubs, except in the West of the country around Soubr´e. This area is not a densely populated area but corresponds to a region with im-portant migration flows. Finally, in Abidjan, we observe imim-portant excesses of traffic within neighborhoods, but not between neighborhoods.
5.2 Temporal Analysis of the Calls Distribution
From previous section, we learnt that the correlation between source and desti-nation antennas is very high. The evolution of the calls distribution over time might be the same for both sets of antennas. Therefore, to track the evolution of traffic over time, we only study the evolution of the originating calls: one call is described by the emitting antenna and a day count (stemming from the date).
Again, the clustering of antennas
Fig. 5: Antennas activity clusters pro-jected on Ivory Coast map. Colored clus-ters show inactivity periods while grey clusters indicate antennas whose traffic is complete over the period.
resulting from the optimal data grid is also too fine for an easy interpre-tation (1051 clusters of antennas and 140 intervals for the day count). We coarse the grain of the grid with our hierarchical post-processing so that the informativity of the model is 80%, with ten clusters of antenna and twenty time segments. Since, missing values are abundant in this data, i.e., some antennas emitted no call during some time periods, consequently, we obtain time segments that are strongly cor-related with missing data. For the same reason, antennas are grouped together because they experienced an absence of calls during one or several simi-lar periods. In the Figure 5, the col-ored antennas belong to clusters
hav-ing experienced simultaneous absences of calls. We observe that the green, or-ange, light blue and purple clusters are located in localized area. The missing data appear during short periods for these clusters. This grouping might be due to localized technical issues on the network. The antennas of the yellow cluster are spread over the country. These antennas are grouped because they have been activated at the same date. This use case provides a better understanding the dysfunctions in the network over the year.
5.3 Analysis of output communications w.r.t. week day and hour Our objective is to build simultaneously a partition of the antennas, a par-tition of the week days and a discretization of the hour, i.e., a triclustering. For
the same reasons as previously, we only keep the emitting antennas.
At the finest level, we obtain a triclustering with 806 clusters of emitting an-tennas, 7 clusters of days and 22 time segments. Again, these results must be simplified to ease the interpretation. However, we fix the numbers of clusters of days and time segments, since they are acceptable for the analysis and we only reduce the number of clusters of antennas. With four clusters of antennas, we keep 51% of the informativity of the model.
Antennas are displayed on the map
Fig. 6: Clusters on the map of Ivory Coast. Dots are antennas. There is one color per cluster.
of Figure 6. We also build a calendar (see Figure 7) for each cluster with days in columns and time segments in lines. The color of the cells indi-cates the excesses (red) or the lacks (blue) of traffic emitted from the cor-responding cluster. The lacks and ex-cesses are measured using the con-tribution to the mutual information (see definition 3) between the ter and the cross product of the clus-ter of weekday and the time segment: M I(XM
1 ; X2M × X3M), with X1M the
partition of the antennas, XM
2 the
par-titions of the weekdays and XM 3 the
discretization of the time. Now we fo-cus on the analysis of each cluster of antennas that we can easily label man-ually:
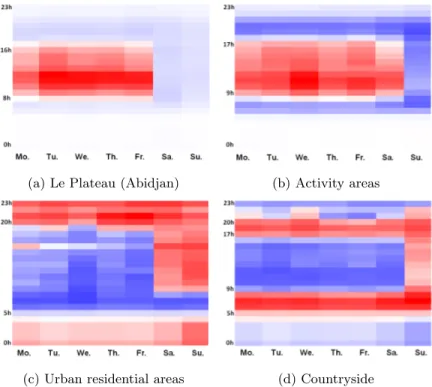
Abidjan - Le Plateau (yellow) This cluster covers exactly the Central Busi-ness District of Abidjan. In the calen-dar of Figure 7, we observe an excess of calls from the Monday to the Fri-day, between 8-9am and 4-5pm. The rest of the time, there is a low lack of
traffic emitted from this area. In other words, during the office hours, the phone traffic is higher than expected and lower the rest of the time. This is expected and representative of this type of area: a non-residential business district. Economic zones (red) The antennas of this cluster are located either in the commercial areas of the cities or in areas with a strong economic activity, like plantations or mines. In Abidjan, these antennas are located in industrial zones (South and North-West), the shopping districts (North of the business district) and the universities and embassies neighborhood (East). The traffic in these areas is mainly in excess from the Monday to the Saturday between 9 am and 5 pm. The correlation is very strong between the working hours and the calls traffic on these areas.
Urban residential areas (blue) The antennas belonging to this cluster are mainly located in the cities like Abidjan, Bouak´e and Yamoussoukro. If we focus on Abidjan, we observe that the cluster covers the residential neighborhood located in the West and in the North-East of the city. At a finer level of partition of the antennas, this cluster would be split according to the socioeconomic class of the neighborhood: the upper class neighborhood in the East of the city is separated from the lower class neighborhoods, located in the North and the West. The calendar shows lacks of calls during the office hours and excesses the weekend, the night and the early morning during the week. This is correlated with the presence of people in residential areas. Note that the excesses of calls start around 8 pm, while it stops around 5 pm in the Central Business district or in economic areas. This time lag is due to the cheaper price of calls after 8 pm.
The countryside (green) The antennas of this cluster are spread over the country, except in Abidjan and other cities in general. The calendar for this cluster is quite similar to the one of the urban residential areas, except that the excess periods are limited to the early evening and the whole Sunday.
(a) Le Plateau (Abidjan) (b) Activity areas
(c) Urban residential areas (d) Countryside
Fig. 7: Calendars of excesses (red) and lacks of calls emitted from each of the four clusters of antennas, in function of the weekday and the daytime.
5.4 User mobility analysis w.r.t. week day and hour
Among the 50000 anonymized users, we focus on mobile users characterized by a frequent use of a large set of distinct antennas: after filtering, 6894 users are under study. For these 4-d data (user, antenna, week day and hour), khc op-erates a tetra-clustering: as a result, users with the same mobility profile are grouped together, i.e., users who have connected to similar groups of antennas, on similar days of the weeks at similar time periods.
At the finest grain, we obtain 237 clusters of users, 218 clusters of antennas and three time segments ,while week days remain as singletons. Again, the gran-ularity prevent us from an easy interpretation, and we simplify the model. We keep 50% of informativity, that enables a reduction of the numbers of clusters of users and antennas to 40, and the numbers of groups of week days and hour segments to two. The week is divided in two parts: the working days and the weekend. For the hour dimension, the split occurs around 6 pm. The intervals are 0 am - 6 pm and 6 pm - 12 am. Note that the bound at midnight is artificial, because the day start as this time. The cut at 6 pm is the last in the hierarchy of the time segmentation. Then it would have been more relevant to consider a day from 6 pm to 6 pm the next day. Nevertheless, it is easier to have an interpretations on a “usual” time period between 0 am and 12 pm. Therefore we keep the following segmentation: 0 am - 6 pm, 6 pm - 12 pm.
(a) Working days before 6 pm (b) Working days after 6 pm
Fig. 8: For a group of user, excesses and lacks of uses of antennas according to the day of the week and the time of the day. Focus on Abidjan.
To illustrate the characterization of users’ behaviors in terms of mobility provided by the grid, we focus on a group of users. The maps of Figure 8 shows the excesses and lacks of traffic in Abidjan during the week, for both periods of the day and for the selected group of users. The colors correspond to the mutual information M I(XM
XM
2 , the partition of the weekdays; X3M the discretization of the daytime; and
XM
4 , the selected partition of the users.
The selected group of users mainly connects to the antennas located in the East of Abidjan after 6 pm during the working days, while they rarely connect to the same antennas before 6 pm the same days. Then, it can be assumed that the selected cluster of users is composed people living in the same area. This hypothesis is reinforced by the socioeconomic nature of this part of Abidjan: it is a residential area. The contributions to mutual information of the other clusters of antennas are smaller. Three areas experience excesses of traffic before 6 pm and lacks after 6 pm. They correspond to the business district (Le Plateau), the embassies and universities neighborhood and the industrial zone located in the West of the city. The common feature of all these areas is their economic activity during the day. To sum up, we can assume that the users of the selected cluster are similar in that they live in the same area and work during the week in three localized area of Abidjan. Similar observations stand for several other clusters of users – thus we are able to summarize users’ mobility behavior.
6
Conclusion
Motivated by two key points of economic development strategy of a telco in emerging countries, we have instantiated a generic methodology for exploratory analysis of CDRs data. Our method is based on a joint distribution estimation technique providing the user analyst with a summary of the data in a parameter-free way. We have also suggested several tools for exploring and exploiting the summary at various granularities and highlighting its relevant components. We have demonstrated the applicability of the method on graph data, temporal sequence data as well as user mobility data stemming from country-scale CDRs data. The results of the exploratory analysis are currently considered as valuable additional input to improve network planning strategy and pricing strategy.
References
1. Becker, R.A., C´aceres, R., Hanson, K., Isaacman, S., Loh, J.M., Martonosi, M., Rowland, J., Urbanek, S., Varshavsky, A., Volinsky, C.: Human mobility charac-terization from cellular network data. Commun. ACM 56(1), 74–82 (2013) 2. Berlingerio, M., Calabrese, F., Lorenzo, G.D., Nair, R., Pinelli, F., Sbodio, M.L.:
Allaboard: A system for exploring urban mobility and optimizing public transport using cellphone data. In: ECML/PKDD. pp. 663–666 (2013)
3. Blondel, V., Krings, G., Thomas, I.: Regions and borders of mobile telephony in Belgium and in the Brussels metropolitan zone. Brussels Studies 42 (2010) 4. Blondel, V., de Cordes, N., Decuyper, A., Deville, P., Raguenez, J., Smoreda,
Z.: Mobile phone data for development - analysis of mobile phone datasets for the development of ivory coast (2013), perso.uclouvain.be/vincent.blondel/ netmob/2013/D4D-book.pdf
5. Blondel, V.D., Esch, M., Chan, C., Cl´erot, F., Deville, P., Huens, E., Morlot, F., Smoreda, Z., Ziemlicki, C.: Data for development: the D4D challenge on mobile phone data. CoRR abs/1210.0137 (2012)
6. Boull´e, M.: Data grid models for preparation and modeling in supervised learning. In: Guyon, I., Cawley, G., Dror, G., Saffari, A. (eds.) Hands-On Pattern Recogni-tion: Challenges in Machine Learning, vol. 1, pp. 99–130. Microtome (2011) 7. Dhillon, I.S., Mallela, S., Modha, D.S.: Information-theoretic co-clustering. In:
KDD. pp. 89–98 (2003)
8. Fr´ıas-Mart´ınez, E., Williamson, G., Fr´ıas-Mart´ınez, V.: An agent-based model of epidemic spread using human mobility and social network information. In: Social-Com/PASSAT. pp. 57–64 (2011)
9. Gnab´eli, R.: La production d’une identit´e autochtone en Cˆote d’Ivoire. Journal des anthropologues. Association fran¸caise des anthropologues 114-115, 247–275 (2008) 10. Guigour`es, R., Boull´e, M.: Segmentation of towns using call detail records. In:
NetMob Workshop at IEEE SocialCom (2011)
11. Guigour`es, R., Gay, D., Boull´e, M., Cl´erot, F., Rossi, F.: Country-scale exploratory analysis of call detail records through the lens of data grid models (2015), http: //arxiv.org/abs/1503.06060
12. Hartigan, J.A.: Direct clustering of a data matrix. Journal of the American Sta-tistical Association 67, 123–129 (1972)
13. Jiang, S., Fiore, G.A., Yang, Y., Ferreira Jr., J., Frazzoli, E., Gonz`alez, M.C.: A review of urban computing for mobile phone traces: current methods, challenges and opportunities. In: UrbComp@KDD (2013)
14. Kolda, T.G., Sun, J.: Scalable tensor decompositions for multi-aspect data mining. In: ICDM. pp. 363–372 (2008)
15. Laurila, J.K., Gatica-Perez, D., Aad, I., Blom, J., Bornet, O., Do, T.M.T., Dousse, O., Eberle, J., Miettinen, M.: From big smartphone data to worldwide research: The mobile data challenge. Pervasive and Mobile Computing 9(6), 752–771 (2013) 16. Lockhart, J.W., Weiss, G.M.: The benefits of personalized smartphone-based
ac-tivity recognition models. In: SDM. pp. 614–622 (2014)
17. Peng, W., Li, T.: Temporal relation co-clustering on directional social network and author-topic evolution. Knowledge and Information Systems 26(3), 467–486 (2011) 18. Slonim, N., Friedman, N., Tishby, N.: Agglomerative multivariate information
bot-tleneck. In: NIPS. pp. 929–936 (2001)
19. Sun, J., Tao, D., Faloutsos, C.: Beyond streams and graphs: dynamic tensor anal-ysis. In: KDD’06. pp. 374–383 (2006)
20. Tishby, N., Pereira, O.C., Bialek, W.: The information bottleneck method. In: Allerton Conference on Communication, Control and Computing (1999)
21. United Nations Global Pulse: Mobile phone network data for development (2013), www.unglobalpulse.org/Mobile_Phone_Network_Dat_for_Dev
22. Vieira, M.R., Fr´ıas-Mart´ınez, V., Oliver, N., Fr´ıas-Mart´ınez, E.: Characterizing dense urban areas from mobile phone-call data: Discovery and social dynamics. In: SocialCom/PASSAT. pp. 241–248 (2010)
23. Wang, D., Pedreschi, D., Song, C., Giannotti, F., Barab´asi, A.L.: Human mobility, social ties, and link prediction. In: KDD. pp. 1100–1108 (2011)
24. Wang, P., Domeniconi, C., Laskey, K.B.: Information bottleneck co-clustering. In: Workshop TextMining@SIAM DM’10 (2010)