HAL Id: hal-00512409
https://hal.archives-ouvertes.fr/hal-00512409
Submitted on 15 Jun 2020
HAL is a multi-disciplinary open access
archive for the deposit and dissemination of
sci-entific research documents, whether they are
pub-lished or not. The documents may come from
teaching and research institutions in France or
abroad, or from public or private research centers.
L’archive ouverte pluridisciplinaire HAL, est
destinée au dépôt et à la diffusion de documents
scientifiques de niveau recherche, publiés ou non,
émanant des établissements d’enseignement et de
recherche français ou étrangers, des laboratoires
publics ou privés.
Historical mining and smelting in the Vosges Mountains
(France) recorded in two ombrotrophic peat bogs
Benoît Forel, Fabrice Monna, Christophe Petit, Olivier Bruguier, R. Losno, P.
Fluck, C. Begeot, H. Richard, V. Bichet, C. Chateau
To cite this version:
Benoît Forel, Fabrice Monna, Christophe Petit, Olivier Bruguier, R. Losno, et al.. Historical mining
and smelting in the Vosges Mountains (France) recorded in two ombrotrophic peat bogs. Journal
of Geochemical Exploration, Elsevier, 2010, 107 (1), pp.9-20. �10.1016/j.gexplo.2010.05.004�.
�hal-00512409�
Historical mining and smelting in the Vosges Mountains (France) recorded in two
ombrotrophic peat bogs
B. Forel
a, F. Monna
a,⁎
, C. Petit
a, O. Bruguier
b, R. Losno
c, P. Fluck
d, C. Begeot
e,
H. Richard
e, V. Bichet
e, C. Chateau
fa
Laboratoire ARTéHIS, UMR 5594 CNRS, Culture Université de Bourgogne, UFR SVTE, 6 bd Gabriel, F-21000 Dijon, France
b
Géosciences Montpellier, UMR 5243 CNRS, Université Montpellier 2, CC 60, Place Eugène Bataillon, F-34095 Montpellier Cedex 5, France
c
LISA, Universités Paris 7, Paris 12, CNRS, Faculté des Sciences, 61 av. du Gal de Gaulle F-94010 Créteil Cedex, France
d
CRESAT, UHA, 10 rue des frères Lumière, F-68093 Mulhouse Cedex, France
eLaboratoire Chrono-Environnement, UMR 6249 CNRS, Université de Franche-Comté, UFR Sciences et Techniques, 16 route de Gray F-25030 Besançon Cedex, France f
Université de Bourgogne, UFR SVTE, 6 bd Gabriel, F-21000 Dijon, France
a b s t r a c t
a r t i c l e i n f o
Article history:
Received 19 November 2009 Accepted 20 May 2010 Available online 4 June 2010 Keywords: Environment Pollution Geochemistry Archaeology Lead isotopes Peat Mining Metal Vosges Medieval
Two peat sequences were sampled in the vicinity of the main mining districts of the Vosges Mountains: Sainte-Marie-aux-Mines and Plancher-les-Mines. Lead isotopic compositions and excess leadfluxes were calculated for each of these radiocarbon-dated sequences. Geochemical records are in very good agreement with the mining history of the area, well known over the last millennium. Except for an anomaly corresponding to the Middle Bronze Age which has not yet been resolved, there is no clear geochemical evidence of local metal production in the Vosges before the 10th century as excess lead deposition archived between 500 BC and 500 AD is attributed to long-range transport of polluted particulate matter. The approach described here can be applied to other mining districts where archaeological evidence is scarce or even lacking, but where past exploitation is suspected.©
1. Introduction
The crystalline Vosges Mountains (Northeast France) are well known for the abundant mineral resources (lead, silver, copper, and iron) they have provided through the ages. Metal production is attested from the 10th century in the district of Sainte-Marie-aux-Mines, which quickly became a rich and thriving city (Fluck, 2000). During the 15th and 16th centuries, the whole Vosges massif was intensively prospected and mined wherever possible. The locally abundant silver, which at that time was of more value than gold, was the main target. In 1545 AD, the Val d'Argent (or Silver Valley), located around Sainte-Marie-aux-Mines, counted 3000 miners, 600 mines and prospection areas, 12 smelters, and 150 km of galleries (Fluck and Weil, 1975). The history of metal production is nevertheless erratic, marked both by success stories and by declining profitability related to market competition, wars and natural catastrophes, wood supply and
other technical constraints (Fluck, 2000). The operations finally stopped in the mid-20th century after a millennium of documented activity. Many galleries, tailings and wastes are still visible in the landscape. They clearly testify to the magnitude of this rich industrial past.
The most recent periods of activity are known fromfield evidence (more particularly at Sainte-Marie-aux-Mines where major archaeo-logical work has been undertaken by Fluck and colleagues), written archives, and abundant iconographic documentation (e.g. the excep-tional paintings by Heinrich Groff ca. 1530 AD, reproduced inBari et al., 1992). However, the emergence and development of mining in the region are still not fully understood. Possible pioneer works starting from Antiquity or earlier are sometime evoked but no definitive answer can be given becausefield evidence is lacking. Such works may have been masked or irreparably destroyed. Recently, techniques originally developed by geoscientists have been adapted to reduce these gaps in archaeological knowledge (Mighall et al., 2002, 2009; Monna et al., 2004a,b; Arnaud et al., 2004; Baron et al., 2005). The basic idea is that if mining has taken place, it will have introduced significant quantities of metals into the surrounding area. Such environmental
⁎ Corresponding author. Tel.: +33 3 80 396 360; fax: +33 3 80 396 387. E-mail address:Fabrice.Monna@u-bourgogne.fr(F. Monna).
changes are therefore able to supply indirect evidence, provided that they have been well preserved over time. Ombrotrophic peatlands may fulfil such requirements. They are almost exclusively fed by the atmosphere so that mineral matter inputs are expected to be low (Shotyk, 1996a,b) and they are supposed to be hydrologically isolated from the substratum. Finally, anthropogenic contributions can be more easily extracted from the raw geochemical signal, and hence interpreted in historical terms (Shotyk et al., 1998, 2003; Mighall et al., 2002; Kylander et al., 2005; Jouffroy-Bapicot et al., 2007; see also
Bindler, 2006for a review). Among all metals studied, lead is often the
most informative because its affinity with organic matter tends to prevent post-depositional migration (Dumontet et al., 1990; Vile et al., 1999; Shotyk et al., 1997, 2003; Weiss et al., 1999). Lead was not necessarily exploited by prehistoric societies, but because it is associated to many ore deposits including copper, it can be regarded as a proxy for various types of mining.
In the present study, we aim to establish a continuous history of metal-related activities in the Vosges massif, from thefirst signs of metallurgy to the most recent periods. The exceptional richness of archaeological and historical records in the region is a considerable
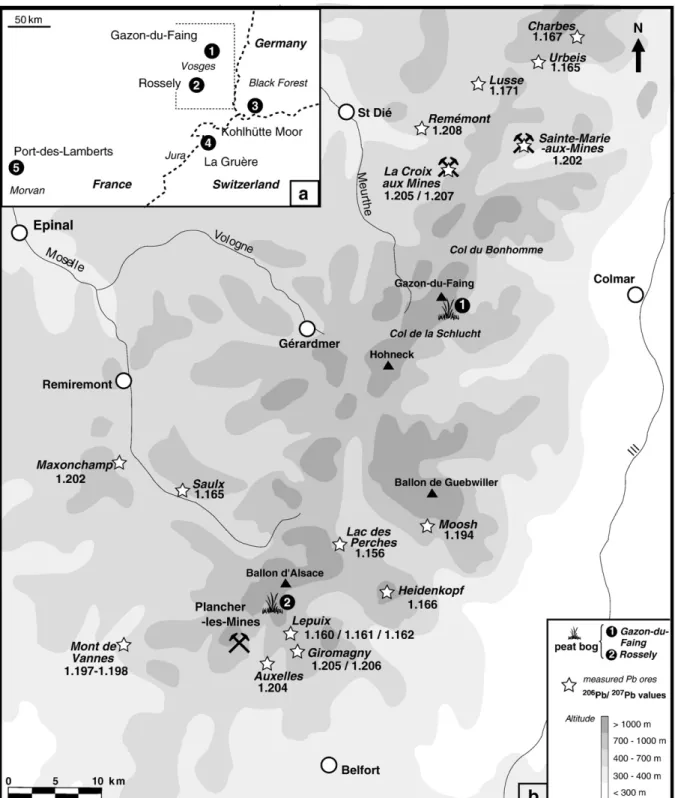
Fig. 1. (a) Geographical situation of the two sites studied, together with other peatlands previously studied (Shotyk et al., 1998; Monna et al., 2004a; Le Roux et al., 2005); (b) Map of Vosges Mountains and sampling sites. The206
Pb/207
asset which allows the potentialities of this palaeoenvironmental approach to be clearly evaluated over the last millennium. The two peat bogs studied, about 80 km apart, are located near the most important Pb/Zn/Ag mining districts in the Vosges: Sainte-Marie-aux-Mines and Plancher-les-Sainte-Marie-aux-Mines. Lead isotopes were measured in addition to elemental concentrations because they have proved to be a powerful tool to discriminate natural vs. anthropogenic lead in the environment, and even to distinguish between several anthropogenic sources (e.g.Faure, 1986; MacKenzie and Pulford, 2002; Mihaljevič et al., 2006; Kylander et al., 2009; Bindler et al., 2009; see alsoKomárek et al., 2008 for a complete review in the environment). It has been demonstrated that two populations of galena characterised by distinct lead isotopic compositions coexist in the Vosges Mountains (Marcoux, 1987). In such conditions, the use of lead isotopic compositions should be particularly informative.
2. Materials and methods
The peat deposits of Rossely (06°48′01″E–47°49′01″N, altitude 920 m) and Gazon-du-Faing (07°03′10″E–48°05′20″N, altitude
1220 m) developed after glacial retreat (Fig. 1). They have a surface area of 10 ha and 9 ha, respectively. A Russian peat corer (5 cm in diameter and 50 cm in length) was used to collect the sequences, following a twin-core coring (10 cm of overlap). The samples were wrapped in clean plastic bags immediately after collection in order to prevent external contamination. Master series were reconstructed at the laboratory on the basis of the sampling depths. Sub-sampling of the sequences, respectively 500 and 350 cm in length, was concentrated within the topmost 300 cm in the case of Rossely, and regularly spaced for Gazon-du-Faing. The sub-samples were dried for 2 days at 60 °C and powdered with a manual agate mortar to obtain homogeneous, fine powders. Water content (WC) was calculated taking into account humid and dried sample weights. Each sample was measured two or three times by elemental analyser at the CNRS Central Laboratory (Vernaison, France) for total organic carbon (TOC) and nitrogen contents. The results were averaged and uncertainties were typically of ±5%. Loss on ignition (LOI) was performed by ashing approximately 1 g of dried peat samples at 450 °C for 4 h.
About 100 mg of peat material was first oxidized with 2 mL of HNO3of suprapure grade for 2–3 h on a hot plate. Complete digestion
was then achieved under pressure on a hot plate using a mixture of 2 mL each of suprapure grade HCl, HNO3and HF (Merck, Germany). A
one-third aliquot of solution was evaporated. The residues were retaken with HNO3 and precisely diluted with MilliQ water.
Lanthanum, strontium, and lead contents were measured using two different quadrupole-based inductively coupled plasma–mass spec-trometers (ICP–MS): a HP 4500 for the Gazon-du-Faing sequence (measurements also included bismuth contents), and a VG PQ2+ for the Rossely sequence. Blanks and certified reference materials (BHVO and Peach Leaves— NIST 1547) were prepared and added to the set of unknown samples following the same protocol (Tables 1–2). The concentrations measured for standard materials were within ±10– 15% of certified values. Uncertainties of ±15% were therefore considered for all elements measured by ICP–MS. Lead from the remaining two-thirds aliquot was pre-concentrated on ionic resin AG1X4 (Biorad) and measured for isotopic abundance by Q-ICP–MS. Details regarding lead separation, instrumental settings, mass bias correction by bracketing, and dead time correction can be found elsewhere (Monna et al., 1998, 2000). The BCR-1, a certified reference material processed together with peat samples, yielded lead isotopic compositions (206Pb/207Pb = 1.205 ± 0.004 and208Pb/206Pb = 2.053 ±
0.006, at 95% confidence level) in good agreement with values reported in the literature (206Pb/207Pb = 1.2036 and 208Pb/ 206Pb = 2.0582; Baker et al., 2004). Blank corrections for isotopic
measurements were never required because they appeared negligible compared to the total amount of lead in the aliquots. Six bulk samples for the Rossely core andfive for the Gazon-du-Faing core were dated by radiocarbon (accelerator mass spectrometry) at the Poznań Radiocarbon Laboratory (Table 3). The dates were calibrated with the OxCal v.4.0 software (programme available for online use at
https://c14.arch.ox.ac.uk/oxcal).
Table 1
Quality control for the analysis of the Gazon-du-Faing core performed with an ICP–MS HP-4500. Limits of detection (LOD) are calculated on the basis of 3 times the standard deviation of 4 analytical blanks. Measured and certified values of SRMs NIST 1547 and BHVO. Pb Zn Cu La Sr Bi LOD (ng g−1) 0.1 2 0.1 0.001 0.06 0.002 NIST 1547 (μg g−1) Measured a 0.94 21.3 3.8 9.1 55.4 0.050 b 0.95 22.1 3.6 8.3 50.8 0.060 Certified 0.87 17.9 3.7 9* 53 – BHVO (μg g−1) Measured 1.95 104 130 15.3 393 0.019 Certified 2 105 136 15.2 400 0.018* *: provided but not certified.
Table 2
Quality control for the analysis of the Rossely core performed with a VG PQ2+. Limits of detection (LOD) are calculated on the basis of 3 times the standard deviation of 4 blanks. Measured and certified values of NIST 1547.
Pb Zn Cu La Sr LOD (ng g−1) 0.1 1 0.2 0.005 0.2 NIST 1547 (μg g−1) Measured a 1.01 22.6 3.9 8.7 56.2 b 0.83 17.8 3.4 7.8 48.8 c 1.20 16.0 3.8 8.7 54.8 Certified 0.87 17.9 3.7 9* 53 *: provided but not certified.
Table 3
Age–depth relationship for the cores of Rossely and Gazon-du-Faing. The data are calibrated to calendar dates AD or BC. Site Bulk sample Lab. reference Uncalibrated14
C date (± 1σ) Calibrated calendar date (2σ) Rossely ROS 61–63 POZ-7322 740 ± 35 BP [1220–1299] AD
ROS 103–105 POZ-7193 1170 ± 30 BP [778–902]AD ROS 153–155 POZ-7324 1605 ± 35 BP [384–542]AD ROS 203–205 POZ-7194 2685 ± 30 BP [897–802]BC ROS 254–256 POZ-7325 3240 ± 40 BP [1617–1428] BC ROS 305–307 POZ-7195 3625 ± 35 BP [2041–1884] BC Gazon-du-Faing GDF 44–45 POZ-17250 620 ± 30 BP [1290–1400] AD GDF 97–98 POZ-17252 970 ± 35 BP [990–1160]AD GDF 159–160 POZ-17253 1355 ± 30 BP [620–770]AD GDF 224–225 POZ-17254 1845 ± 35 BP [70–250]AD GDF 285–286 POZ-17255 2250 ± 35 BP [400–200]BC
3. Results and discussion
3.1. Growing rate of the peat sequences
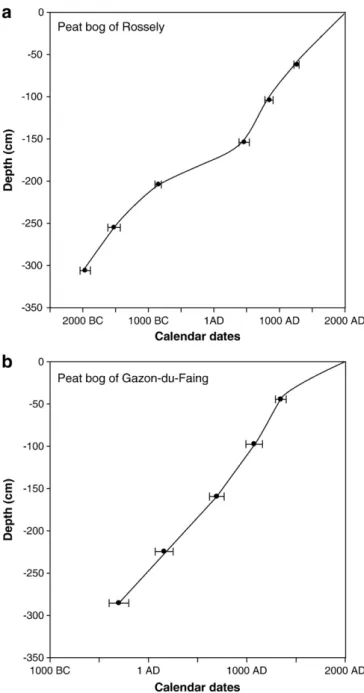
The age vs. depth relationship (Fig. 2) indicates fairly regular growing rates for each of the two sequences except, to some extent, for a relative slowing down between∼150 and 200 cm depth at the Rossely site. The sequences present no evident hiatus or major disturbance. The Rossely core covers more than four millennia, while the base of the Gazon-du-Faing core corresponds approximately to the transition between the Late Bronze Age and the Early Iron Age (ca. 8th century BC). Although the Gazon-du-Faing core is shorter than the Rossely core, the durations of both are adequate for our purpose. 3.2. Trophic status of the sequences
Both cores exhibit similar features with total organic carbon contents close to 50%, ash content ca 2–3% (100-LOI%), and
concentrations of lanthanum (a lithogenic, conservative element belonging to the rare earth group, used as a surrogate for mineral matter) most of the time below 1μg g−1. (Tables 4–5;Fig. 3a and b). The high C/N ratios from 20 to more than 100 (Tables 4–5) confirm the visual examination of the sequences in thefield: the sequences are homogeneous, and the organic matter is not strongly decomposed, even in deep horizons. The stable water content (w/w) with depth, at about 90% for Gazon-du-Faing and Rossely (not shown here), can easily be explained by the high water retention capacity of organic matter. All these features, as well as relatively steady Sr concentra-tions, below 20μg g−1(Tables 4–5;Fig. 3a and b), are characteristic of
ombrotrophic status (e.g.Shotyk, 2002; De Vleeschouwer et al., 2007) well adapted to our purpose.
3.3. Data preparation
Even if both sequences are ombrotrophic, metal contributions of natural origin from the atmosphere cannot be excluded. While they are obviously of minor importance in the presence of large anthropo-genic inputs, they constitute the heart of the signals observed during pre-anthropogenic times. Traditionally, the isolation of the excess metal contribution (assumed to be of anthropogenic nature) with respect to natural inputs is performed in two steps. In thefirst step, the targeted metal is normalised to a lithogenic and conservative element such as scandium, lanthanum, or aluminium, assuming that, in natural conditions, there is a proportional relationship between buried metals of natural origin (and present at trace levels) and the element used for normalisation (e.g.Martínez-Cortizas et al., 1997, 2002; Weiss et al., 2002; Monna et al., 2006). Then the excess contribution can be computed by using the following equation:
Mexcess = Mtotal–La × M =Lað Þnatural;
where Mtotalrepresents the total metal M concentration; Mexcess, the
excess contribution to the total concentration; La is the total lanthanum content, chosen here as a surrogate for natural mineral matter in this equation; (M/La)naturalis supposed to be constant and
corresponds to the ratio between the metal M and lanthanum contents in pre-anthropogenic conditions.
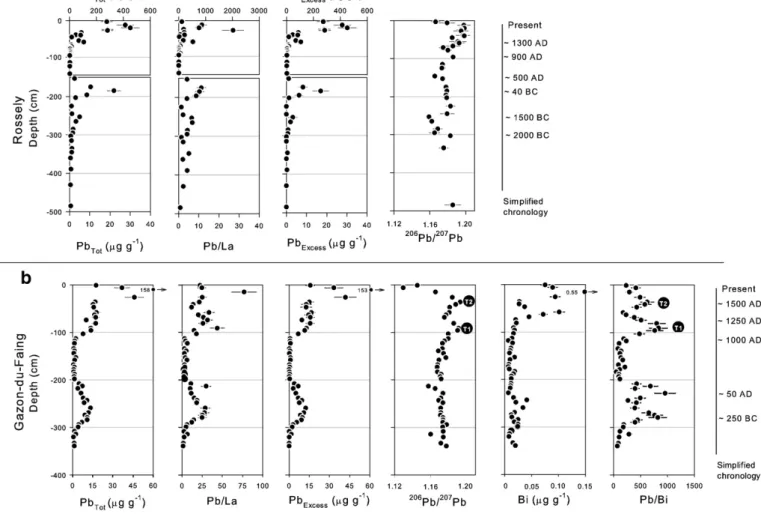
Fig. 4a and b presents evolutions in total Pb concentrations and Pb/La ratios and206Pb/207Pb ratio profiles, for both cores. Because lanthanum
contents do not vary widely with depth, the Pb/La profiles are comparable to those of total Pb. Below 300 cm depth in the Rossely core, Pb/La ratios are low and relatively steady: 2.6 ± 1.5 (1σ). Similar values are found at the base of the Gazon-du-Faing core: 2.0 ± 0.7 (1σ), although it is not certain that the background was attained. These values are about 4–5 times greater than that the typical value of the upper continental crust (Pb/La∼0.5,Wedepohl, 1995), but should be preferred here as reference values, because they probably depict the local geochemical background better. Excess Pb profiles, computed using a Pb/La ratio of 2.3 ± 2 (1σ), for both cores, are shown inFig. 4a and b. For each core, they appear to be almost the same as those of total lead because the natural contribution is too low to be significant. Surprisingly, below 300 cm depth in the Rossely core, in other words in horizons formed before 2000 BC, the206Pb/207Pb ratios of ∼1.18
(Table 4,Fig. 4a) are markedly lower than those generally observed for Pb naturally present at trace level in rocks and soils, supposed to be between 1.19 and 1.22 in France (Elbaz-Poulichet et al., 1986; Shotyk et al., 1998; Alfonso et al., 2001; Lévêque et al., 2002). It is nonetheless worth mentioning that values of 1.18–1.19 have already been reported by Le Roux et al. (2005) for lead isotopic compositions of pre-anthropogenic horizons in a peat column collected in the Black Forest, Germany, on the other side of the Rhine. Here, this signature probably reflects the local natural atmospheric deposition, as previously suggested for the Hercynian massif of the Black Forest byLe Roux et al. (2005).
Fig. 2. Depth vs.14
C-based calibrated calendar dates for the peat bogs of Rossely (a) and Gazon-du-Faing (b). The error bars are given with a 95% confidence level.
Table 4
Core of Rossely. Total organic carbon (TOC), nitrogen contents, C/N ratios, loss on ignition (LOI), La, Sr, Cu, Zn, and Pb contents and206Pb/207Pb and208Pb/206Pb ratios. The errors for
isotopic ratios are given at 95% confidence level. See text for errors in concentration measurements.
Depth (cm) TOC (%) N (%) C/N LOI (%) La (μg g−1) Sr (μg g−1) Pb (μg g−1) 206Pb/207Pb ± 208Pb/206Pb ±
−3 47.2 2.5 19 – 2.4 24.1 278 1.166 0.005 2.085 0.009 −6 47.4 2.2 22 – 1.0 13.6 133 1.179 0.009 2.093 0.013 −12 47.9 1.4 33 96.2 0.48 13.1 415 1.198 0.010 2.064 0.015 −18 48.1 1.2 42 – 0.32 11.9 – – – – – −20 – – – – 0.60 10.6 452 1.199 0.001 2.068 0.009 −24 47.5 0.77 62 – 1.5 4.0 283 1.195 0.005 2.065 0.014 −27 46.2 0.70 66 – 0.14 5.3 283 1.195 0.008 2.063 0.021 −30 – – – – 0.51 9.4 – – – – – −33 49.8 1.6 31 – 0.43 5.5 89 – – – – −39 49.3 1.0 48 – 0.80 8.1 48 1.197 0.008 2.078 0.016 −40 – – – – 0.38 5.9 84 1.198 0.002 2.063 0.005 −45 49.8 1.3 37 – 0.61 10.0 17 1.185 0.007 2.078 0.020 −55 48.6 1.0 50 – 0.40 6.9 69 1.191 0.009 2.080 0.016 −59 49.1 0.88 56 98.0 0.20 6.5 106 1.193 0.006 2.064 0.016 −67 49.5 1.3 37 – 0.22 4.7 14 1.186 0.008 2.086 0.014 −71 48.5 0.88 55 – 0.24 8.1 15 1.175 0.006 2.090 0.017 −75 48.2 0.82 59 – 0.50 3.4 4.8 – – – – −78 – – – – 0.21 4.1 4.6 1.180 0.004 2.085 0.005 −83 47.2 0.79 60 98.7 0.21 7.1 6.4 – – – – −87 48.7 0.89 55 – 0.23 8.3 7.7 – – – – −91 48.1 0.67 72 – 0.10 5.2 6.0 – – – – −95 49.8 0.95 52 – 0.20 3.8 5.5 – – – – −96 – – – – 0.44 5.8 3.1 1.186 0.003 2.074 0.007 −107 48.5 0.88 55 – – – – – – – – −115 – – – – 0.70 7.8 3.7 1.174 0.003 2.083 0.011 −119 48.9 0.99 49 – – – – – – – – −125 48.8 0.92 53 98.9 0.50 11.8 2.4 1.174 0.004 2.087 0.009 −137 48.6 1.2 42 – – – – – – – – −143 48.8 0.97 50 – – – – – – – – −146 – – – – 0.54 6.1 2.8 1.166 0.003 2.094 0.006 −147 47.9 0.93 52 – – – – – – – – −153 – – – – 0.57 5.6 2.4 1.174 0.003 2.087 0.007 −155 49.0 1.1 47 98.8 – – – – – – – −161 51.1 1.5 35 – – – – – – – – −167 49.6 1.4 35 – – – – – – – – −173 50.9 1.9 27 – – – – – – – – −175 – – – – 0.92 6.7 10 1.178 0.003 2.092 0.007 −179 51.4 1.8 28 – – – – – – – – −185 – – – – 2.1 8.0 22 1.179 0.003 2.097 0.005 −191 51.6 0.71 73 – – – – – – – – −196 – – – – 0.97 6.3 8.5 1.178 0.003 2.089 0.006 −197 50.7 1.1 46 98.6 – – – – – – – −203 – – – – 0.72 5.6 3.0 1.179 0.004 2.089 0.004 −207 48.5 0.81 60 – – – – – – – – −219 50.3 1.3 40 – – – – – – – – −225 50.1 0.90 56 98.6 0.68 6.7 0.9 1.183 0.005 2.084 0.009 −237 48.2 0.75 64 – – – – – – – – −243 49.4 0.81 61 – – – – – – – – −245 – – – – 0.49 6.3 1.1 1.179 0.008 2.078 0.016 −247 48.0 0.66 73 – – – – – – – – −253 – – – – 0.76 9.5 4.9 1.159 0.002 2.098 0.006 −258 48.4 0.73 66 – – – – – – – – −265 – – – – 0.46 9.7 3.1 1.162 0.003 2.095 0.005 −270 48.5 0.74 66 – – – – – – – – −276 47.9 0.52 92 – – – – – – – – −282 47.4 0.46 103 98.9 – – – – – – – −285 – – – – 0.40 10.3 1.8 1.169 0.005 2.089 0.012 −294 46.6 0.63 74 – – – – – – – – −295 – – – – 0.38 9.9 1.6 1.165 0.006 2.096 0.013 −302 48.9 0.32 153 – – – – – – – – −303 – – – – 0.41 9.9 0.6 1.183 0.002 2.086 0.005 −315 – – – – 0.39 12.1 0.9 – – – – −326 47.1 0.60 79 98.8 – – – – −335 – – – – 0.13 10.8 1.1 1.176 0.005 2.086 0.013 −345 – – – – 0.20 11.8 1.0 – – – – −346 48.1 0.71 68 98.9 – – – – – – – −360 – – – – 0.20 14.0 0.4 – – – – −375 47.7 0.55 87 – – – – – – – – −389 – – – – 0.15 15.8 0.7 – – – – −405 47.2 0.56 84 98.4 – – – – – – – −430 – – – – 0.18 20.4 0.4 – – – – −455 50.4 0.75 67 – – – – – – – – −485 – – – – 0.71 6.9 0.6 1.186 0.009 2.076 0.018 −490 53.6 1.4 39 98.7 – – – – – – –
Comparisons of excess lead profiles between cores are nonetheless difficult even when a chronological scale is preferred to a depth scale because concentrations are directly governed by growth rates of peatlands. For this reason,fluxes of excess lead were calculated for the Rossely and Gazon-du-Faing sequences by taking into account excess lead contents, accumulation rates and apparent densities (cfMihaljevič et al. 2006). The two sequences for the Vosges are reported together with three others collected in surrounding areas (Fig. 1a,Fig. 5): (i) the“Kohlhütte Moor” sequence, located south of the Black Forest, Germany, about 90 km from our sites (Le Roux et al., 2005), (ii) the“Etang de la Gruère” sequence, in the Swiss Jura mountains, 80 km away (data inShotyk et al., 1998, fluxes reported inLe Roux et al., 2005), and (iii) the“Port-des-Lamberts”
sequence, situated in the Morvan, Massif Central, France, 240 km away (data inMonna et al., 2004a). The206Pb/207Pb ratios of the average
anthropogenic component alone were calculated when possible using the procedure described inMonna et al. (2004a), which takes into account the
206Pb/207Pb and La/Pb ratios (or Sc/Pb ratios for the Gruère core) of both
background and bulk samples.
3.4. Reading leadfluxes and lead isotopic compositions in historical terms 3.4.1. Prehistoric times–Bronze Age
Before 2000 BC, no measurable anthropogenic inputs can be recognized in the Rossely sequence (Fig. 5b). From 2000 BC to
Table 5
Core of Gazon-du-Faing. Total organic carbon (TOC), nitrogen contents, C/N ratios, loss on ignition (LOI), La, Sr, Cu, Zn, Bi, and Pb contents and206Pb/207Pb and208Pb/206Pb ratios. The
errors for isotopic ratios are given at 95% confidence level. See text for errors in concentration measurements.
Depth (cm) TOC (%) N (%) C/N LOI (%) La (μg g− 1) Sr (μg g− 1) Bi (μg g− 1) Pb (μg g− 1) 206Pb/207Pb ± 208Pb/206Pb ±
−1 – – – – 0.79 5.6 0.075 18 1.145 0.001 2.114 0.005 −6 – – – – 1.5 4.6 0.089 37 1.130 0.001 2.128 0.004 −10 46.7 1.30 36 96.4 – – – – – – – – −15 – – – – 2.1 15 0.541 158 1.165 0.002 2.096 0.005 −21 45.9 2.11 22 – – – – – – – – – −26 – – – – 1.8 7.3 0.094 46 1.184 0.002 2.080 0.006 −31 48.4 1.73 28 96.1 – – – – – – – – −36 – – – – 0.79 6.9 0.027 17 1.193 0.002 2.070 0.005 −41 – – – – 1.1 7.8 0.026 15 1.188 0.002 2.074 0.004 −47 – – – – 1.3 11 0.037 16 1.181 0.002 2.078 0.006 −53 45.4 0.47 97 – – – – – – – – – −58 – – – – 0.53 10 0.101 18 1.181 0.002 2.083 0.006 −63 – – – – 0.81 10 0.071 16 1.177 0.001 2.087 0.004 −68 46.1 0.33 140 98.3 0.65 9.8 0.045 17 1.175 0.001 2.090 0.006 −74 – – – – 0.32 7.8 0.020 10 – – – – −81 – – – – 0.66 11 0.021 17 1.186 0.002 2.076 0.005 −91 46.3 0.43 108 – 0.31 7.0 0.016 14 1.191 0.001 2.071 0.005 −96 – – – – 0.92 9.3 0.018 14 1.190 0.002 2.070 0.004 −103 – – – – 0.44 8.8 0.016 7.8 1.180 0.002 2.082 0.005 −108 44.8 0.32 140 98.7 – – – – – – – – −113 – – – – 0.77 9.9 0.013 2.5 1.180 0.001 2.086 0.004 −118 – – – – 0.36 6.1 0.007 1.6 1.176 0.002 2.091 0.005 −123 – – – – 0.22 6.5 0.015 1.5 1.173 0.001 2.092 0.006 −129 46.3 0.20 232 – – – – – – – – – −134 – – – – 0.30 8.3 0.011 0.91 1.173 0.002 2.097 0.004 −139 – – – – 0.26 8.4 0.010 1.4 1.169 0.003 2.102 0.007 −144 – – – – 0.35 13 0.009 1.0 1.174 0.002 2.094 0.003 −153 46.8 0.65 72 98.6 0.61 8.0 0.018 2.4 1.177 0.002 2.086 0.004 –158 – – – – 0.26 7.2 0.010 1.6 1.169 0.001 2.101 0.004 −168 44.7 0.10 447 – 0.20 7.6 0.007 0.6 1.168 0.003 2.108 0.004 −173 – – – – 0.39 7.9 0.006 1.4 1.167 0.001 2.109 0.005 −178 47.0 0.27 174 99.1 0.38 8.8 0.008 0.94 – – – – −183 – – – – 0.28 7.8 0.018 0.82 1.168 0.003 2.111 0.007 −188 – – – – 0.47 8.5 0.016 1.6 1.172 0.002 2.096 0.002 −193 – – – – 0.46 8.3 0.012 1.2 1.171 0.002 2.101 0.006 −198 47.5 0.72 66 – 0.42 6.7 0.012 1.4 1.172 0.002 2.098 0.005 −208 47.9 0.45 106 98.9 0.44 7.0 0.011 4.9 – – – – −213 – – – – 0.24 5.2 0.011 7.3 1.157 0.001 2.098 0.005 −218 – – – – 0.39 5.9 0.010 4.0 1.165 0.002 2.099 0.005 −223 46.3 0.19 244 99.0 – – – – – – – – −228 – – – – 0.56 9.0 0.007 6.4 1.174 0.002 2.068 0.004 −238 – – – – 0.53 8.7 0.016 8.0 1.171 0.002 2.095 0.005 −243 – – – – 0.58 8.9 0.041 11 1.169 0.002 2.096 0.003 −248 45.8 0.30 153 98.8 0.47 9.5 0.021 8.7 1.174 0.002 2.094 0.004 −259 – – – – 0.46 8.8 0.034 13 1.171 0.001 2.093 0.005 −264 46.6 0.91 51 – – – – – – – – – −269 – – – – 0.42 10 0.018 12 1.171 0.001 2.093 0.004 −274 – – – – 0.36 10 0.012 9.2 1.171 0.001 2.097 0.005 −279 – – – – 0.44 11 0.013 11 1.174 0.002 2.092 0.004 −284 48.1 0.25 193 98.5 0.74 10 0.025 11 1.174 0.002 2.097 0.004 −289 – – – – 0.58 11 0.018 7.0 1.174 0.001 2.092 0.004 −294 48.1 0.72 67 – 0.73 11 0.025 4.6 1.178 0.001 2.093 0.005 −299 – – – – 0.83 11 0.024 4.3 1.173 0.001 2.092 0.006 −308 – – – – 0.57 12 0.012 1.4 1.174 0.002 2.096 0.006 −314 45.7 0.39 117 98.7 0.37 14 0.009 2.5 1.160 0.001 2.100 0.006 −320 – – – – 0.28 8.6 0.008 0.76 1.174 0.002 2.097 0.004 −333 – – – – 0.78 15 0.015 1.3 1.171 0.002 2.096 0.005 −339 50.5 1.53 33 98.0 0.94 12 0.020 1.4 1.177 0.002 2.097 0.006
1500 BC, discrete but significant geochemical anomalies with excess Pbfluxes reaching 0.2 mg m−2y−1 are noticed in the Rossely
se-quence, although nothing similar has been seen in the Morvan core, which covers the same period (Fig. 5e). This variation could perhaps be attributed to a durable episode of changes in the nature of the mineral matter integrating the peatland, in other words changes in Pb/La ratios. This hypothesis is however not fully satisfactory because the lead isotopic signature of excess lead (206Pb/207Pb∼1.155) is
incompatible with natural dust inputs. Another possible explanation could be local mining by prehistoric societies, for which no archaeological evidence remains. This scenario is compatible with the lead isotopic compositions of one group of galena extracted from the surrounding ore deposits, which present 206Pb/207Pb ratios
∼1.15–1.16 (seeFig. 1for localisation andFig. 6, details are given in
Table 6). However, the available data are too scarce to confirm either hypothesis.
Fig. 3. Total organic carbon (TOC), loss on ignition (LOI), lanthanum, and strontium contents against depth for the cores of Rossely (a) and Gazon-du-Faing (b). The error bars are given with a 95% confidence level.
3.4.2. Bronze Age–Antiquity
In the Rossely core, the period between 1300 BC and 600 BC is characterised by extremely low excess Pbfluxes (Fig. 5b). In contrast, the Morvan core recorded notable anthropogenic inputs during this period (Fig. 5e) which were interpreted as the impact of mining and metallurgy performed by nearby populations (Monna et al., 2004a). Significant excess Pb fluxes are noticeable in the Vosges during the Iron Age and Antiquity (Fig. 5a and b). It is well established that, during this period, mining and metallurgy developed in Europe (Settle and Patterson, 1980; Nriagu, 1983, 1996). The amount of lead introduced into the atmosphere was so large that significant fall-out of anthropo-genic origin is systematically recognized in lake sediments and peat bogs across Europe (e.g.Shotyk et al., 1998; Kylander et al., 2009) reaching areas as remote as Sweden or Greenland where metallurgy was obviously not present at that time (Hong et al., 1994; Rosman et al., 1997; Brännvall et al., 1999). Because the contamination was wide-spread, some authors have even proposed using the lead anomaly as a chronostratigraphic marker to date sediments (Renberg et al., 2001). It is therefore not surprising to observe this signal in the Vosges Mountains. The point is nonetheless to determine if lead emitted by possible local mining may have been added in substantial amounts to that resulting from long-range transport of polluted airborne particulate matter. Comparing lead isotopic signatures of anthropogenic lead contribution andfluxes recorded in the Vosges Mountains with other neighbouring sites can help to answer this question. First of all, the anthropogenic leadflux peaked at approximately the same time in the Vosges, Morvan, Black Forest and Swiss Jura. Time shifts can be observed
between the profiles but they may be due to uncertainties in the chronology, more particularly at Rossely where the time scale is poorly constrained between 1000 BC and 1000 AD. In addition, moderate post-deposition migrations of Pb may have led to an overestimation of the contamination phase duration. There is a remarkable similarity in the maximum anthropogenic leadfluxes: about 1 mg m−2y−1at each of
these sites, although metallic deposition is known to be controlled by local climatic and geomorphological conditions (rainfall amount, topography, etc.). However, while the isotopic signatures of the anthropogenic component were approximately the same at Rossely (206Pb/207Pb
∼ 1.178–1.179, Fig. 5b), Gazon-du-Faing (206Pb/ 207Pb∼1.174–1.175; Fig. 5a) and in the Jura (206Pb/207Pb∼1.176–
1.177;Fig. 5d), a slightly less radiogenic component was noticed in the Morvan during this period (206Pb/207Pb
∼1.170–1.172,Fig. 5e); no isotopic data is available for the Black Forest core during Antiquity (Fig. 5c). These features plead in favour of a common remote source impacting all sites in approximately the same way. The only difference resides in the situation of the Morvan where the adjunction of locally derived pollution may have produced a mean anthropogenic compo-nent slightly less radiogenic than those calculated for the other sites. Everything therefore tends to demonstrate that, despite the abundance of mineral resources, significant local mining did not take place in the Vosges at this period.
3.4.3. Middle Ages–Modern times
Excess lead appears to be low in all cores including those from the Vosges from the 4th century AD and for six centuries onwards (Fig. 5).
Fig. 4. Total lead, Pb/La ratios, excess lead (see text for calculation),206
Pb/207
Pb ratios Bi contents, and Pb/Bi ratios against depth for the cores of Rossely (a) and Gazon-du-Faing (b). The error bars are given with a 95% confidence level.
Fig. 5. Excess leadfluxes through time: Gazon-du-Faing (a) and Rossely (b) in the Vosges Moutains; Kohlhütte Moor (c) in the Black Forest; Etang de la Gruère (d) in the Swiss Jura Mountains; Port des Lamberts (e) in the Morvan massif. The isotopic206
Pb/207
Pb ratios of excess lead are reported on the graphs. Attention must be paid to the Rossely diagram which presents a double Y-axis scale.
With the fall of the Roman Empire, a period known as the Dark Ages began. Many mines closed across Europe and the main metallurgical centres slowed down. Wars and barbarian invasions disorganized industrial production and airborne particulate matter became rapidly less contaminated at the European scale (Shotyk et al., 1998; Brännvall et al., 1999). From the 10th century to the present, both environmental records and the local history of mining and smelting differ somewhat for the districts of Sainte-Marie-aux-Mines and Plancher-les-Mines. As a consequence, they are discussed separately.
3.4.3.1. Gazon-du-Faing. A drastic increase in excess Pb deposition is noticed from the 10th century (Fig. 5a). This intensification is accompanied by a major shift in lead isotopic compositions towards more radiogenic values; the calculated206
Pb/207Pb ratios of excess lead progress rapidly from 1.170 to 1.192. The oldestfield evidence of mining ever found at Sainte-Marie-aux-Mines dates from that period. It is based on two radiocarbon analyses of coals (845–980 AD and 895–1015 AD) associated with scoria and furnace fragments (Fluck, 2000). Such dates are in very good agreement with the earliest written source which reports that the monk who founded the monastery of Echery (ca. 938 AD) also started mining activities in the area (Fluck, 2000 and sources cited therein). Moreover, the rise of the206Pb/207Pb ratios
toward radiogenic values is coherent with the signatures of one group of local galena, namely type B, which present206Pb/207Pb ratios of about
1.20 (seeFig. 1for localisation andFig. 6, details are given inTable 6). Lead isotopic compositions of peat undoubtedly record the environ-mental impact of local mining and smelting. From the 11th to the 13th centuries AD, excess leadfluxes stabilised, reaching more than 2 mg m−2y−1, while 206Pb/207Pb ratios of the anthropogenic lead
signature regularly decreased to 1.175. Smelters, galleries and hydro-logical installations built to wash ores, which all testify to persistent metallurgical activity from the 10th to 14th century AD have been discovered by Fluck and colleagues in the Altenberg (Sainte-Marie-aux-Mines district). The fall of the206Pb/207Pb ratios observed in the
Gazon-du-Faing peat bog probably illustrates the progressive extension of
mining works to another group of local ore deposits (i.e. galena of type A, characterised by206Pb/207Pb ratios of about 1.165, cfTable 6,Fig. 6).
There is a turning point around the 13th–14th century. Lead pollution decreased and206Pb/207Pb ratios of the pollutant end-member rose again to values greater than 1.190 (Fig. 5a). It is known that mining declined at that time without totally collapsing (Fluck, 2009) in part because of the disorganisation of the society due to successive famines (1292–1295 and 1315–1317), the Black Plague which was particularly severe in 1348, 1359, 1370 and 1400 in the Vosges, and the Hundred Years' War lasting from 1337 to 1453. Other reasons, such as technical problems related to the accumulation of water in galleries, have also been invoked to explain this recession. Production is known to have focused only on specific mines selected for their profitability. Such a change is illustrated by the sudden shift in206Pb/207Pb ratios toward
more radiogenic values. From the beginning of the 16th century,
anthropogenic lead fluxes quickly increased to reach more than 10 mg m−2y−1during the 17th–18th century, while206
Pb/207Pb ratios of the anthropogenic contribution dropped to 1.165 (Fig. 5a). This new turning point is in perfect agreement with the revival of mining exploitation which occurred from the end of the 15th century AD at Sainte-Marie-aux-Mines. Thefirst success recorded from the beginning of the 16th century AD led to intense and systematic prospection. However, difficulties quickly appeared: (i) forest clearances had to extend to respond to the increasing demand for shoring beams and the wood supply decreased so that its price rose, (ii) too much silver persisted in copper ingots reducing profits, and (iii) mined veins deepened and consequently the exploitation cost increased.
Fig. 6.206
Pb/207
Pb vs.208
Pb/206
Pb diagram. Open boxes and closed triangles correspond to samples from Rossely and Gazon-du-Faing respectively. Potential lead sources are reported for comparative purposes: Grey circles for local Pb ore deposits of types A and B (data fromMarcoux, 1987), and recent evolution of leaded gasoline (see text for details). Typical error bars for isotopic measurements are also reported (95% confidence level).
Table 6
Lead isotopic compositions of Vosges ore deposits measured by TIMS (data from
Marcoux, 1987). Errors were typically ±0.01, ± 0.01 and ±0.02 for206Pb/204Pb,207Pb/ 204
Pb,208
Pb/204
Pb ratios, respectively (at 95% confidence level). Ak, G, Bl, Z, P, Bert., for aikinite, galena, boulangerite, zinkenite, plagionite, and berthierite. Two groups can be recognized. The less radiogenic, namely Type A, (model ages of 300–400 Ma,206
Pb/
207
Pb∼1.15–1.16) corresponds to high temperature deposits (Lac des Perches, Saulx), the vein of Heidenkopf, and the Pb/Sb veins (Lepuix Gy, Urbeis), while the more radiogenic includes all of the F/Ba and Ag/Pb veins, except Lusse. This group, namely Type B, is characterised by model ages from + 30 Ma to−140 Ma and206
Pb/207 Pb ratios of about 1.19–1.20. Location Mineral 206 Pb/ 204 Pb 207 Pb/ 204 Pb 208 Pb/ 204 Pb 206 Pb/ 207 Pb 208 Pb/ 206 Pb High temperature ore deposits
Lac des Perches Ak 17.964 15.546 37.918 1.156 2.111 Saulx G 18.120 15.547 37.798 1.165 2.086 Sainte-Marie-aux-Mines G 18.789 15.630 38.679 1.202 2.059 Mesothermal deposits La Croix aux-Mines G 18.871 15.638 38.785 1.207 2.055 La Croix aux-Mines G 18.848 15.642 38.770 1.205 2.057 Remémont G 18.883 15.629 38.740 1.208 2.052 Lusse G 18.320 15.640 38.398 1.171 2.096 Urbéis G 18.182 15.603 38.110 1.165 2.096 Urbéis Bl 18.171 15.597 38.090 1.165 2.096 Moosch G 18.625 15.604 38.439 1.194 2.064 Lepuix-Gy Z 18.066 15.569 38.107 1.160 2.109 Lepuix-Gy P 18.080 15.570 38.137 1.161 2.109 Lepuix-Gy Bl 18.089 15.565 38.128 1.162 2.108 Charbes Bert. 18.370 15.735 38.837 1.167 2.114 Epithermal veins Giromagny G 18.869 15.652 38.770 1.206 2.055 Giromagny G 18.844 15.642 38.750 1.205 2.056 Trémeures G 18.877 15.652 38.820 1.206 2.056 Maxonchamp G 18.788 15.632 38.695 1.202 2.060 Auxelles G 18.814 15.625 38.529 1.204 2.048 Mont-de-Vannes G 18.761 15.679 38.805 1.197 2.068 Mont-de-Vannes G 18.787 15.682 38.947 1.198 2.073 Heidenkopf G 18.169 15.576 38.148 1.166 2.100
Fortunately, the discovery in 1549 of a silver-rich copper vein some kilometers south of Sainte-Marie-aux-Mines in the Neuenberg (the new mountain) by Schwartz Collin strongly stimulated production. Simul-taneously, a new process, liquation, which consists in adding consid-erable amounts of lead to copper in order to increase silver extraction, was massively applied thus improving profitability. Nonetheless, after a thirty-year period of wealth, mining declined again due to wood shortages, augmentation of production costs, and the discovery of mines in the New World which provided silver for Europe. The Thirty Years' War during thefirst half of the 17th century led to plundering and occupation by Swedish, French and Imperial troops. Water rose in shafts and production collapsed again. At the beginning of the 18th century, mines reopened focusing on silver, lead, copper and a newly exploited metal: cobalt. However, infrastructures suffered fromfires, floods and various accidents which damaged the fragile industrial balance. A new phase of recession occurred from the second half of the 18th century. This historical summary shows that local mining and smelting underwent several peaks and troughs during the 16th–18th century. Unfortunately, they are not all visible in our profile, except the revival in the 18th century which probably corresponds to leadfluxes peaking at about 11 mg m−2y−1(Fig. 5a). A higher resolution sub-sampling and the establishment of a 210Pb chronology over the last century, extrapolated to depth, should improve the reconstruction of this past history. However, it must be kept in mind that, because they are formed from living plants, peat sequences are probably less efficient than laminated and undisturbed sediments at preserving high-frequency variations. In all cases, the slow industrial decline of the area, which was marked only by some attempts at exploitation during the 19th century, lingering on until World War II, explains the decrease in excess lead fluxes during the 19th and 20th centuries. The low206Pb/207Pb ratio ca
1.12 in the sub-surface horizon of Gazon-du-Faing (Fig. 5a) is clearly incompatible with local or regional mining (Fig. 6). In contrast, it illustrates the influence of unradiogenic lead added as an antiknock compound in gasoline from the end of the 20th century (Hamester et al., 1994; Monna et al., 1997; Chiaradia and Cupelin, 2000).
3.4.3.2. Rossely. Thefirst signs of medieval contamination appear from the 12th–13th century in the Rossely core (Fig. 5b), in other words later than for Gazon-du-Faing. Although the medieval mining history is not well known in the district of Plancher-les-Mines, some sources seem to indicate that mining started in the area as early as the 12th century AD. The first written evidence dates from the 15th century, when the priests of Lure signed a lease for local metal exploitation. Later, during the 16th century, anthropogenic leadfluxes increased rapidly. At the beginning of the 16th century, the silver mines of Plancher-les-Mines were among the most productive in the Empire. The district furnished Guebwiller (Alsace, France) with silver for coinage. As in the case of the Sainte-Marie-aux-Mines district, the Thirty Years' War damaged local mining and smelting. Extraction and treatment works began again from the end of the 17th century, peaked during the 18th century andfinally ceased in 1770. In the Rossely core, just as in the Gazon-du-Faing core, the peak of activity is clearly recorded (Fig. 5b), as is perhaps the slowing down which occurred during thefirst half of the 16th century. Except for the topmost samples which are less radiogenic, probably because of the influence of unradiogenic leaded gasoline, the lead isotopic composi-tions of the anthropogenic inputs remained steady at Rossely from the end of the 13th century to modern times, with206Pb/207Pb ratios between 1.19 and 1.20 (Fig. 5b). These signatures suggest a mixture between the two types of galena recognized in the area: 206Pb/ 207
Pb = 1.155–1.165 and206
Pb/207Pb = 1.194–1.204 (see Fig. 1 for localisation andFig. 6, details are given inTable 6), with however a paramount importance of the second end-member. Interestingly, the isotopic differences observed between the two cores from the 10th century onwards (Fig. 5a and b) confirm that atmospheric deposition at this period is mainly driven by local mining and smelting, rather
than by inputs originating from remote sources. It is also noteworthy that excess leadfluxes appear to be much greater in magnitude at Rossely than at Gazon-du-Faing (Fig. 5a and b). It would nonetheless be false to conclude that exploitation at Plancher-les-Mines was more intense than at Sainte-Marie-aux-Mines. The peatland of Rossely is located leeward, at only 5–10 km from the main mines, while the Gazon-du-Faing peat was cored more than 20 km south of Sainte-Marie-aux-Mines (Fig. 1). Their situations with respect to supposed contamination sources are thus quite different in terms of distance from emissions and position with respect to dominant wind direction. 3.5. Bismuth as possible proxy of metallurgy
Bismuth is a metal that was often mistaken for lead in the past as they are chemically close. It may be associated as a by-product to some lead or copper ores, so that discrete but significant contamina-tion has been observed as early as Greek/Phoenician times in Arctic ice (Krachler et al., 2009). In our case, from the medieval period and onwards, the Bi profile in the Gazon-du-Faing core exhibits some resemblance with Pb, except that it begins to increase later and that it drops appreciably during the 14th century (Fig. 4b). The resulting large variations in Pb/Bi ratios between 100 and 850 appear to be smooth and closely related to those of206Pb/207Pb ratios from the
Middle Ages (see the simultaneous peaks at times T1 and T2 in
Fig. 4b). This similitude strongly suggests that Pb/Bi ratios might help in identifying the mineralizations exploited throughout history. As a matter of fact, the drastic rise in Bi contents from the 16th century AD onwards clearly matches mining works undertaken from 1549 in the Neuenberg, an area known to present substantial traces of Bi, while ores from Altenberg exploited earlier do not contain as much. During the Iron Age and Antiquity, high Pb/Bi ratios are also detected (Fig. 4b). They present two top values corresponding to horizons dated at approximately 250 BC and 50 AD. This feature, if it is confirmed, might be used in the future to trace the pollution deriving from long-range transport of contaminated particles across Europe. 4. Conclusion
The geochemical reading of lead signals archived in both cores is in very good agreement with the local archaeological and historical knowledge available for the two mining districts over the last millennium. This result clearly demonstrates the effectiveness of our approach. Even if the temporal resolution may appear rather poor to archaeologists and historians, it allows a rapid overview of local mining and smelting. Concerning the earliest periods, no mining or smelting was clearly identified before the 10th century. Geochemical anomalies recognized for the Iron Age and Antiquity were attributed to continental signals observed everywhere in Europe at those periods. A discrete anomaly was also noticed for the Bronze Age at the site of Rossely but its origin is not clear enough to identify local mining with confidence.
The present work also stresses the massive metal contamination in areas nowadays protected by the French government because of their remarkable biotopes. Pb concentrations reach respectively more than 100μg g−1and 500μg g−1in the sub-surface horizons of
Gazon-du-Faing and Rossely. These areas are located several kilometers away from former emission sources, so that the immediate surroundings of the former mines and smelters are in all probability much more heavily contaminated. Environmental studies should therefore be undertaken to assess the impact on present-day fauna and human health. Acknowledgements
We wish to thank the Regional Council of Burgundy and the CNRS for their support, and funding for the Ph.D. thesis of Benoit Forel (CNRS BDI-R 2004.3 Bourgogne), as well as the ACR programme
directed by Jean-François Piningre, which studies the Bronze Age in eastern France. We are grateful to anonymous reviewers who improved the manuscript by their judicious comments.
References
Alfonso, S., Grousset, F., Massé, L., Tastet, J.-P., 2001. A European lead isotope signal recorded from 6000 to 300 years BP in coastal marshes (SW France). Atmospheric Environment 35, 3595–3605.
Arnaud, F., Revel-Rolland, M., Bosch, D., Winiarski, T., Desmet, M., Tribovillard, N., Givelet, N., 2004. A 300 year history of lead contamination in northern French Alps reconstructed from distant lake sediment records. Journal of Environmental Monitoring 6, 448–456.
Baker, J., Peate, D., Waight, T., Meyzen, C., 2004. Pb isotopic analysis of standards and samples using a Pb-207–Pb-204 double spike and thallium to correct for mass bias with a double-focusing MC–ICP–MS. Chemical Geology 211, 275–303.
Bari, H., Benoit, P., Brugerolles, E., Fluck, P., Schoen, H., 1992. La mine mode d'emploi. La Rouge Myne de Sainct Nicolas de La Croix. Collection Découvertes Gallimard. 84 pp. Baron, S., Lavoie, M., Ploquin, A., Carignan, J., Pulido, M., de Beaulieu, J.-L., 2005. Record of metal workshops in peat deposits: history and environmental impact on the Mont Lozere Massif, France. Environmental Science and Technology 39, 5131–5140. Bindler, R., 2006. Mired in the past— looking to the future: geochemistry of peat and the
analysis of past environmental changes. Global and Planetary Change 53, 209–221. Bindler, R., Renberg, I., Rydberg, J., Andren, T., 2009. Widespread waterborne pollution
in central Swedish lakes and the Baltic Sea from pre-industrial mining and metallurgy. Environmental Pollution 157, 2132–2141.
Brännvall, M.-L., Bindler, R., Renberg, I., Emteryd, O., Bartnicki, J., Billström, K., 1999. The medieval metal industry was the cradle of modern large-scale atmospheric lead pollution in Northern Europe. Environmental Science and Technology 33, 4391–4395.
Chiaradia, M., Cupelin, F., 2000. Behaviour of airborne lead and temporal variations of its source effects in Geneva (Switzerland): comparison of anthropogenic versus natural processes. Atmospheric Environment 34, 959–971.
De Vleeschouwer, F., Gerard, L., Goormaghtigh, C., Mattielli, N., Le Roux, G., Fagel, N., 2007. Atmospheric lead and heavy metal pollution records from a Belgian peat bog spanning the last two millennia: human impact on a regional to global scale. Science of the Total Environment 377, 282–295.
Dumontet, S., Lévesque, M., Mathur, S.P., 1990. Limited downward migration of pollutant metals (Cu, Z, Ni, and Pb) in acidic virgin peat soils near a smelter. Water Air Soil Pollution 49, 329–342.
Elbaz-Poulichet, F., Holliger, P., Martin, J.M., Petit, D., 1986. Stable lead isotopes ratios in major french rivers and estuaries. Science of the Total Environment 54, 61–76. Faure, G., 1986. Principles of Isotope Geology. Wiley and sons, NewYork, USA. Fluck, P., 2000. Sainte-Marie-aux-Mines. Les mines du rêve. Editions du patrimoine
minier, p. 208.
Fluck, P., 2009. PCR Altenberg (Ste-Marie-aux-Mines, Haut-Rhin): fonderies et mines d'argent, Xe-XVIIe s., Les Actes du CRESAT, No. 6. Université de Haute-Alsace. Fluck, P., Weil, R., 1975. Géologie des gîtes minéraux dans les Vosges: Mémoires du B.R.
G.M., 87, p. 190.
Hamester, M., Stechmann, M., Steiger, M., Dannecker, W., 1994. The origin of lead in urban aerosols— a lead isotopic ratio study. Science of the Total Environment 146/ 147, 321–323.
Hong, S., Candelone, J.P., Patterson, C.C., Boutron, C.F., 1994. Greenland ice evidence of hemispheric lead pollution two millenia ago by Greek and Roman civilizations. Science 265, 1841–1843.
Jouffroy-Bapicot, I., Pulido, M., Galop, D., Monna, F., Ploquin, A., Baron, S., Petit, C., Lavoie, M., Beaulieu, J.-L., de Richard, H., 2007. Environmental impact of early palaeometallurgy: pollen and geochemical analysis. Vegetation History and Archaeobotany 16, 251–258. Komárek, M., Ettler, V., Chrastný, C., Mihaljevič, M., 2008. Lead isotopes in
environmental sciences: a review. Environment International 34, 562–577. Krachler, M., Zheng, J., Fisher, D., Shotyk, W., 2009. Global atmospheric As and Bi
contamination preserved in 3000 year old Arctic ice. Global Biogeochemical cycles 23, GB3011 7 pp..
Kylander, M.E., Weiss, D.J., Martínez Cortízas, A., Spiro, B., Garcia-Sanchez, R., Coles, B.J., 2005. Refining the pre-industrial atmospheric Pb isotope evolution curve in Europe using an 8000 year old peat core from NW Spain. Earth and Planetary Science Letters 240, 467–485.
Kylander, M.E., Weiss, D.J., Kober, B., 2009. Two high resolution terrestrial records of atmospheric Pb deposition from New Brunswick, Canada, and Loch Laxford, Scotland. Science of Total Environment 407, 1644–1657.
Le Roux, G., Aubert, D., Stille, P., Krachler, M., Kober, B., Cheburkin, A., Bonani, G., Shotyk, W., 2005. Recent atmospheric Pb deposition at a rural site in southern Germany assessed using a peat core and snowpack, and comparison with other archives. Atmospheric Environment 39, 6790–6801.
Lévêque, J., Phillippe, S., Baize, D., Monna, F., Haack, U., 2002. Utilisation des isotopes stables du plomb pour la détermination des sources de pollutions et l'étude de son transfert dans les sols contaminés. In: Baize, D., Tercé, M. (Eds.), « Les éléments traces métalliques dans les sols. Approches fonctionnelles et spatiales »INRA: coord., pp. 375–391. MacKenzie, A.B., Pulford, I.D., 2002. Investigation of metal dispersal from a disused
mine site at Tyndrum, Scotland, using concentration gradients and stable Pb isotope ratios. Applied Geochemistry 17, 1093–1103.
Marcoux, E., 1987. Isotopes du plomb et paragenèses métalliques. Traceurs de l'histoire des gîtes minéraux. Document du BRGM, No. 117. 289 pp.
Martínez-Cortizas, A., Pontevedra-Pombal, X., Nóvoa-Muñoz, J.C., García-Rodeja, E., 1997. Four thousand years of atmospheric Pb, Cd and Zn deposition recorded by the ombrotrophic peat bog of Penido Vello (Northwestern Spain). Water Air Soil Pollution 100, 387–403.
Martínez-Cortizas, A., Garcia-Rodeja, E., Pontevedra Pombal, X., Nóvoa-Muñoz, J.C., Weiss, D., Cherbulin, A., 2002. Atmospheric Pb deposition in Spain during the last 4600 years recorded by two ombrotrophic peat bogs and implications for the use of peat as archive. Science Total Environment 292, 33–44.
Mighall, T.M., Abrahams, P.W., Grattan, J.P., Hayes, D., Timberlake, S., Forsyth, S., 2002. Geochemical evidence for atmospheric pollution derived from prehistoric copper mining at Copa Hill, Cwmystwyth, mid-Wales, UK. Science of the Total Environment 292, 69–80.
Mighall, T.M., Timberlake, S., Foster, I.D.L., Krupp, E., Singh, S., 2009. Ancient copper and lead pollution records from a raised bog complex in Central Wales, UK. Journal of Archaeological Science 36, 1504–1515.
Mihaljevič, M., Zuna, M., Ettler, V., Šebek, O., Strnad, L., Goliáš, V., 2006. Lead fluxes, isotopic and concentration profiles in a peat deposit near a lead smelter (Pribram, Czech Republic). Science of the Total Environment 372, 334–344.
Monna, F., Lancelot, J., Croudace, I., Cundy, A.B., Lewis, T., 1997. Pb isotopic signature of urban air in France and in UK: implications on Pb pollution sources. Environmental Science and Technology 31, 2277–2286.
Monna, F., Loizeau, J.-L., Thomas, B.A., Guéguen, C., Favarger, P.-Y., 1998. Pb and Sr isotope measurements by inductively coupled plasma–mass spectrometer: efficient time management for precise improvement. Spectrochimica Acta B 59, 1317–1333.
Monna, F., Loizeau, J.-L., Thomas, B., Guéguen, C., Favarger, P.-Y., Losno, R., Dominik, J., 2000. Noise identification and sampling frequency determination for precise isotopic measurements by quadrupole-based inductively coupled plasma mass spectrometry. Analusis 28, 750–757.
Monna, F., Petit, C., Guillaumet, J.-P., Jouffroy-Bapicot, I., Blanchot, C., Dominik, J., Losno, R., Richard, H., Lévêque, J., Chateau, C., 2004a. History and environmental impact of mining activity in Celtic Aeduan territory recorded in a peat-bog (Morvan, France). Environmental Science and Technology 38, 657–673.
Monna, F., Galop, D., Carozza, L., Tual, M., Beyrie, A., Marembert, F., Chateau, C., Dominik, J., Grousset, F.E., 2004b. Environmental impact of early Basque mining and smelting recorded in a high ash minerogenic peat deposit. Science of the Total Environment 327, 197–214.
Monna, F., Poujol, M., Annegarn, H., Losno, R., Coetze, H., Dominik, J., 2006. Origin of atmospheric lead in Johannesburg, South Africa. Atmospheric Environment 40, 6554–6566.
Nriagu, J.O., 1983. Lead and Lead Poisoning in Antiquity. Wiley, New York. Nriagu, J.O., 1996. A history of global metal pollution. Science 272, 223–224. Renberg, I., Bindler, R., Brännvall, M.-L., 2001. Using the historical atmospheric
lead-deposition record as a chronological marker in sediment deposits in Europe. Holocene 11, 511–516.
Rosman, K.J.R., Chisholm, W., Hong, S.M., Candelone, J.P., Boutron, C.F., 1997. Lead from Carthaginian and Roman Spanish mines isotopically identified in Greenland ice dated from 600 BC to 300 AD. Environmental Science and Technology 31, 3413–3416.
Settle, D., Patterson, C., 1980. Lead in albacore: guide to lead pollutions in Americans. Science 207, 1167–1176.
Shotyk, W., 1996a. Peat bog archives of atmospheric metal deposition: geochemical evaluation of peat profiles, natural variations in metal concentrations, and metal enrichment factors. Environmental Review 4, 149–183.
Shotyk, W., 1996b. Natural and anthropogenic enrichments of As, Cu, Pb, Sb, and Zn in ombrotrophic vs. minerotrophic peat bog profiles, Jura Mountains, Switzerland. Water Air Soil Pollution 90, 375–405.
Shotyk, W., 2002. The chronology of anthropogenic, atmospheric Pb deposition recorded by peat cores in three minerogenic peat deposits from Switzerland. Science of the Total Environment 292, 19–31.
Shotyk, W., Cheburkin, A.K., Appleby, P.G., Fankhauser, A., Kramers, J.D., 1997. Lead in three peat bog profiles, Jura Mountains, Switzerland: enrichment factors, isotopic composition, and chronology of atmospheric deposition. Water Air and Soil Pollution 100, 297–310.
Shotyk, W., Weiss, D., Appleby, P., Cherbukin, A., Frei, R., Gloor, M., Kramer, J., Reese, S., Van der Knaap, W., 1998. History of atmospheric lead deposition since 12, 370 14C yr BP from a peat bog, Jura Mountains, Switzerland. Science 281, 1635–1640. Shotyk, W., Goodsite, M.E., Roos-Barraclough, F., Frei, R., Heinemeier, J., Asmund, G.,
Lohse, C., Hansen, T.S., 2003. Anthropogenic contributions to atmospheric Hg, Pb and As accumulation recorded by peat cores from southern Greenland and Denmark dated using the 14C“bomb pulse curve”. Geochimica Cosmochimica Acta 67, 3991–4011.
Vile, M.A., Wieder, R.K., Novak, M., 1999. Mobility of Pb in Sphagnum-derived peat. Biogeochemistry 45, 35–52.
Wedepohl, K.H., 1995. The composition of the continental crust. Geochimica et Cosmochimica Acta 59, 1217–1232.
Weiss, D., Shotyk, W., Appleby, P.G., Cheburkin, A.K., Kramers, J.D., 1999. Atmospheric Pb deposition since the Industrial Revolution recorded byfive Swiss peat profiles: enrichment factors, fluxes, isotopic composition, and sources. Environmental Science and Technology 33, 1340–1352.
Weiss, D., Shotyk, W., Boyle, E.A., Kramers, J.D., Appleby, P.G., Cheburkin, A.K., 2002. Comparative study of the temporal evolution of atmospheric lead deposition in Scotland and eastern Canada using blanket peat bogs. Science Total Environment 292, 7–18.