HAL Id: hal-03017978
https://hal.archives-ouvertes.fr/hal-03017978
Submitted on 7 Dec 2020
HAL is a multi-disciplinary open access
archive for the deposit and dissemination of
sci-entific research documents, whether they are
pub-lished or not. The documents may come from
teaching and research institutions in France or
abroad, or from public or private research centers.
L’archive ouverte pluridisciplinaire HAL, est
destinée au dépôt et à la diffusion de documents
scientifiques de niveau recherche, publiés ou non,
émanant des établissements d’enseignement et de
recherche français ou étrangers, des laboratoires
publics ou privés.
Rotational spectroscopic study of S-methyl thioformate
A. Jabri, B. Tercero, L. Margulès, R. Motiyenko, E. Alekseev, I. Kleiner, J.
Cernicharo, J.-C. Guillemin
To cite this version:
A. Jabri, B. Tercero, L. Margulès, R. Motiyenko, E. Alekseev, et al.. Rotational spectroscopic study
of S-methyl thioformate: A global laboratory analysis of ground and excited torsional states up to
660 GHz. Astronomy and Astrophysics - A&A, EDP Sciences, 2020, 644, pp.A102.
�10.1051/0004-6361/202038200�. �hal-03017978�
Astronomy
&
Astrophysics
https://doi.org/10.1051/0004-6361/202038200
© A. Jabri et al. 2020
Rotational spectroscopic study of S-methyl thioformate
A global laboratory analysis of ground and excited torsional states
up to 660 GHz
?
A. Jabri
1, B. Tercero
2,3, L. Margulès
4, R. A. Motiyenko
4, E. A. Alekseev
5, I. Kleiner
1,
J. Cernicharo
6, and J.-C. Guillemin
71Laboratoire Interuniversitaire des Systèmes Atmosphériques (LISA), UMR CNRS 7583, Université Paris-Est-Créteil,
Université de Paris, Institut Pierre Simon Laplace (IPSL), 61 av. du Général de Gaulle, 94010 Créteil, France e-mail: [email protected]
2Observatorio Astronómico Nacional (OAN-IGN). Calle Alfonso XII, 3, 28014 Madrid, Spain 3Observatorio de Yebes (IGN). Cerro de la Palera s/n, 19141 Yebes, Guadalajara, Spain
4Univ. Lille, CNRS, UMR 8523 - PhLAM - Physique des Lasers Atomes et Molécules, 59000 Lille, France 5Radiospectrometry Department, Institute of Radio Astronomy of NASU, Kharkov, Ukraine
6Instituto de Física Fundamental (IFF-CSIC). Calle Serrano 123, 28006 Madrid, Spain
7Univ. Rennes, Ecole Nationale Supérieure de Chimie de Rennes, CNRS, ISCR-UMR 6226, 35000 Rennes, France
Received 19 April 2020 / Accepted 13 October 2020
ABSTRACT
Context. S-methyl thioformate CH3SC(O)H is a monosulfur derivative of methyl formate, a relatively abundant component of the
interstellar medium (ISM). S-methyl thioformate being, thermodynamically, the most stable isomer, it can be reasonably proposed for detection in the ISM.
Aims. This work aims to experimentally study and theoretically analyze the ground and first torsional excited states for CH3SC(O)H
in a large spectral range for astrophysical use.
Methods. S-methyl thioformate was synthesized as a result of a reaction of methyl mercaptan with acetic-formic anhydride. The millimeter-wave spectrum was then recorded for the first time from 150 to 660 GHz with the solid-state spectrometer located at Lille.
Results. A set of 3545 lines is determined and combined with 54 previously measured lines in the microwave region, belonging to ground state νt= 0 as well as 1391 transitions in the first excited state of torsion ν18= 1. Some 164 lines were also assigned to ν18= 2
for the A-species. A global fit was performed using the BELGI-Cscode taking into account the large splitting of A and E lines due to
methyl internal rotation motion with a relatively low barrier, V3= 127.4846(15) cm−1.
Conclusions. Using our spectroscopy work, a deep search of S-methyl thioformate was carried out in the IRAM 30 m and ALMA data of different high-mass star-forming regions (Orion KL and Sgr B2). We derived an upper limit to the CH3SC(O)H column density in
these regions.
Key words. line: identification – catalogs – ISM: abundances – submillimeter: ISM – methods: laboratory: molecular
1. Introduction
In recent years, the detection of many complex organic molecules (COMs) in the interstellar medium (ISM) and circum-stellar envelopes has been made possible by substantial progress accomplished in astrophysical observation. According to the Cologne Database for Molecular Spectroscopy (CDMS,Endres et al. 2016) and to the recent review ofMcGuire(2018), around 204 different molecules have been detected, and almost a third of them contain more than five atoms (Herbst & Van Dishoeck 2009). Most of the molecular identifications were accomplished by recording their spectra in the laboratory and comparing them to the interstellar surveys by means of microwave, millimeter- or submillimeter-wave telescopes.
The detection of molecular species in space by microwave, millimeter- and submillimeter-wave telescopes would have been
?Full Table A.1 is only available at the CDS via anonymous ftp
tocdsarc.u-strasbg.fr(130.79.128.5) or viahttp://cdsarc. u-strasbg.fr/viz-bin/cat/J/A+A/644/A102
impossible without dedicated studies in the laboratory address-ing the high-resolution rotational and rovibrational spectroscopy, both in theory and experimentally, of relevant species. Precise knowledge of the rotational spectra was the key point for the detections of many complex molecules compiled and updated in the existing international databases such as CDMS (Endres et al. 2016), Splatalogue, JPL catalog (Pickett et al. 1998),
NIST catalog(Lovas 2004), and Toyama Microwave Atlas for spectroscopists and astronomers. To gain this knowledge, a com-mon strategy is to combine experimental microwave, millimeter-and submillimeter-wave spectroscopy, followed by the analysis of these spectra using appropriate effective quantum mechanical Hamiltonians and ab initio calculations, if no information on the rotational constants is available from previous studies.
In the last decades, several molecules exhibiting internal rotations of the methyl CH3 group have been detected in the
interstellar and circumstellar media; for example, methanol (CH3OH,Ball et al. 1970), methyl formate and its isotopologues
(HCOOCH3, Churchwell & Winnewisser 1975; Demyk et al.
2008;Favre et al. 2014;Carvajal et al. 2009;Haykal et al. 2014; A102, page 1 of9
A&A 644, A102 (2020)
Kobayashi et al. 2013), acetaldehyde (CH3CHO,Fourikis et al.
1974), acetic acid (CH3COOH,Mehringer et al. 1997;Remijan
et al. 2003), and acetamide (CH3CONH2,Hollis et al. 2006).
Sulfur-bearing molecules are important species when it comes to understanding the chemical evolution of hot cores, and their molecular ratios have previously been used as chem-ical clocks to obtain information about the age of those hot cores (Wakelam et al. 2004; Charnley 1997). However, the chemistry of interstellar sulfur is still not well understood. The observed abundance of sulfur-bearing species in dense clouds only represents about 0.1% of the abundance of sulfur in dif-fuse clouds (where it corresponds almost to its solar abundance). There is still some mystery surrounding this missing sulfur and what its reservoir would be (Anderson et al. 2013). About 20 different molecules containing sulfur have been identified in space so far, and among them, only methyl mercaptan (CH3SH)
exhibits observable internal rotation splitting (called A−E split-ting) (Linke et al. 1979;Xu et al. 2012;Kolesniková et al. 2014;
Zakharenko et al. 2019).
S-methyl thioformate CH3SC(O)H is the sulfur analog of
methyl formate CH3OC(O)H, a relatively abundant and
ubiq-uitous molecule in the ISM (Brown et al. 1975;Churchwell & Winnewisser 1975). It is also detected in the comet Hale-Bopp (Bockelée-Morvan et al. 2000) and in low-mass star-forming regions (hot corinos) such as NGC 1333-IRAS4B and IRAS2A (Bottinelli et al. 2007). Methyl thioformate can be thus consid-ered as a potentially detectable species in this medium because most of the abundant oxygen derivatives have the corresponding sulfur derivative detected in the ISM (Cernicharo et al. 1987).
Relatively few laboratory spectroscopic studies exist on inter-nal rotors containing sulfur, and in the case of methyl thio-formate those studies mainly concern transitions in the ground torsional state νt= 0. Two isomers exist for methyl
thiofor-mate where either the sp3 oxygen atom of methyl formate HCOOCH3is substituted by a sulfur atom (S-methyl thioformate
CH3SC(O)H) or the sp2oxygen is substituted (O-methyl
thiofor-mate CH3OC(S)H). In 2014Senent et al.(2014) performed
high-level quantum chemical calculations to determine the spectro-scopic parameters (rotational and centrifugal distortion constants as well as the potential barrier hindering the internal rotation of the methyl group). They also characterized the relative energies for the two isomers, CH3SC(O)H and CH3OC(S)H. Figure 2 of
Senent et al. (2014) shows the two isomers with their possible conformers, cis- and trans-, depending on the position of the methyl group relative to that of the C= O or C = S bonds for CH3SC(O)H and CH3OC(S)H, respectively. The cis- S-methyl
thioformate CH3SC(O)H is determined as the most stable
struc-ture at 1134 cm−1below the trans- CH3SC(O)H, and at 4372.2
and 6335.8 cm−1 below the cis- and trans- configurations of
O-methyl thioformate CH3OC(S)H, respectively. In the present
paper, we focus on the spectroscopy of the cis- S-methyl thiofor-mate CH3SC(O)H as it corresponds to the most stable species.
To our knowledge, only two spectroscopic studies are avail-able for CH3SC(O)H:Jones et al.(1976) recorded the microwave
spectrum between 10 and 41 GHz, as well as an infrared spec-trum recorded at low resolution between 50 and 4000 cm−1.
Although they measured about 40 lines of the torsional A-species in the R-branch (corresponding to the a-type selection rule) and in the R- and Q-branches (corresponding to the b-type selection rule), their search for the A−E splitting due to internal rotation was unsuccessful because of the poor information about the barrier height to internal rotation V3. Self consistent field
(SCF) ab initio calculations allowed them to conclude that their measured lines correspond to the cis- CH3SC(O)H isomer. Using
Stark-effect measurements, they were able to determine the elec-tric dipole moment values µaand µbin the principal axis system
to be 1.52 and 0.43 Debye, respectively. Later on, Caminati et al.(1981) recorded the microwave spectrum of CH3SC(O)H
between 10 and 40 GHz with a cold cell at 235 K. They also per-formed double resonance microwave measurements that allowed them to confirm the identification of the E-species lines. In total, they measured 22 and 15 lines belonging to the internal A- and E-rotation states, respectively, up to J= 20. They fit the 37 lines using 11 parameters. However, their study shows discrepancies up to 5.7 MHz when comparing the observed line positions to the calculated values (see Tables I and II of the ref. Caminati et al. 1981).
In this context, the goal of the present work is to extend, for the first time, the spectroscopic measurements of CH3SC(O)H
in the millimeter- and submillimeter-wave spectral ranges in order to produce a reliable line list of frequencies and intensities to be used for searching the molecule in space. Section 2
presents the experimental details, including the synthesis of the S-methyl thioformate. Section3 contains a presentation of the theoretical model used for data analysis. The second part of this section is dedicated to assignments and fits of the spectral data. Section 4 presents the intensity calculation and the line lists for astronomers. Section5corresponds to the astronomical search for CH3SC(O)H in the ISM. Section6is dedicated to the
discussion of our results. 2. Experimental details 2.1. Chemical synthesis
To prepare S-methyl thioformate CH3SC(O)H, we modified the
synthesis of Hershfield & Schmir (1972). In a Schlenk flask, methanethiol (methyl mercaptan, CH3SH; 0.1 mol) was slowly
added to acetic-formic anhydride (0.1 mol) at a temperature rang-ing from 5 to 10◦C. The flask was immersed in a liquid nitrogen
bath, degassed, and then closed with the stopcock. The mix-ture was stirred for 36 h at 35 ◦C. Then, a distillation with a short Vigreux Column (20 cm) gave a first fraction containing the S-methyl thioformate and about 30% of formic and acetic acids. Purification was performed in a vacuum line (0.1 mbar) with a first trap cooled at −50 ◦C to remove both carboxylic acids, and a second trap cooled at −90◦C to selectively
con-dense the S-methyl thioformate, which was thus obtained in a 37% yield.
2.2. Spectra measurements
The measurements in the frequency range under investigation (150−660 GHz) were performed using the Lille spectrometer (Zakharenko et al. 2015). The absorption cell was a stainless-steel tube (6 cm in diameter, 220 cm in length). The sample pressure during measurements was about 10 Pa and at room temperature, the line width was limited by Doppler broaden-ing. The frequency ranges, 150−330 and 400−660 GHz, were covered with various active and passive frequency multipliers from Virginia Diodes, Inc.(VDI Inc) and an Agilent synthe-sizer (12.5−18.25 GHz) was used as the source of radiation. As a detector, we used an InSb liquid He-cooled bolometer from QMC Instruments Ltd to improve the sensitivity of the spec-trometer. The sources were frequency modulated at 30 kHz. Estimated uncertainties for measured line frequencies are 30 and 50 kHz depending on the observed signal-to-noise (S/N) and the frequency range. Uncertainties of 100 kHz are also given to relatively broad transitions or presenting a weak S/N.
3. Results
3.1. Theoretical model
The S-methyl thioformate contains one methyl group internal rotor with a rather low torsional barrier hindering this motion, which was estimated by Caminati et al. (1981) to be V3=
147.96 cm−1. Therefore, the rotational analysis of its spectra
requires a suitable theoretical model and Hamiltonian to treat the internal rotation splitting between the A- and E-species.
In the present work, we used the BELGI-Cs1 program
(Hougen et al. 1994) using the rho-axis method (RAM) with a two-step procedure initially described by Herbst et al. (1984). The BELGI-Cs code was previously applied successfully to a
number of interstellar molecules containing an internal methyl rotor and was used in particular for the parent species of the cis- methyl formate (Carvajal et al. 2007) as well as for its
13C isotopic species H13COOCH
3 and HCOO13CH3 (Carvajal
et al. 2009),18O isotopologues HC18OOCH
3 and HCO18OCH3
(Tercero et al. 2012), and deuterated species DCOOCH3(Duan
et al. 2015). The method takes its name from the choice of the axis system, which allows us to minimize the coupling between internal rotation and global rotation in the Hamiltonian, at least in the zeroth order. As it has been described in the literature (Lin & Swalen 1959;Hougen et al. 1994;Kleiner 2010) and applied extensively, we do not repeat it here.
The BELGI-Csprogram uses a global approach since it takes
into account the A- and E-symmetry states simultaneously, as well as all the νttorsional levels originating from a given
vibra-tional state, up to a truncation level. The interactions between rotation-torsion energy levels are treated explicitly within the Hamiltonian matrix elements. In our approach, only one set of rotational constants and parameters that describe the potential are fit for all the torsional states for a given vibrational state.
In the so-called RAM used in the BELGI-Cs code, we do not use the Principal Axis System (PAS). To simplify the calcu-lations and to get rid at the zeroth order of the torsion-rotation interaction terms, we use a non-principal axis system (called the rho-axis system (RAS); Kleiner 2010). As a consequence, we fit the Dab parameter, which multiplies the PaPb+ PbPa
off-diagonal operator, where Pa and Pb designate the projection
of the total rotational angular momentum on the a and b axes, respectively. The Dab parameter is related to the θRAM angle
between the z axis of the PAS and RAS, as described byKleiner
(2010): θRAM= 1 2arctan 2Dab ARAM− BRAM ! . (1)
Morever, in the BELGI-Cs code, a two-step diagonalisation
procedure is used to calculate the energy levels. First, a set of calculations are carried out to diagonalize the torsion part of the Hamiltonian for each K= Kavalue. Then in the second step, the
rest of the Hamiltonian terms (rotational, centrifugal distortion, and interaction terms between rotation and torsion) are diago-nalized. The RAM method has been sucessfully applied to a number of astrophysical internal rotors, such as methyl formate (Carvajal et al. 2007,2009). As described further in Sect.4, the BELGI-Csprogram also has an option allowing us to calculate
the line strengths (using the RAM values for the electric dipole moments).
1 The source code BELGI for the fit, an example of input data file
and a readme file are available at the web sitePROSPE, managed by Dr. Zbigniew Kisiel. Extended versions of code are also available by contacting the author I. Kleiner.
The torsional frequency mode v18 for the cis- S-methyl
thio-formate is predicted to lie between 80 and 111 cm−1depending on the level of theory used (see Tables III and VII of the ref.
Senent et al. 2014). Other low-frequency vibrational modes can also be responsible for rotational transitions observed in the spectrum, such as the v17mode (torsion of the CO group)
calcu-lated to be around 250 cm−1, the v12mode (bending of the CSC
bond) observed at 245 cm−1 and the v
11 mode (bending of the
OCS bond) observed at 320 cm−1(Senent et al. 2014). However, our present model does not take into account the interactions between the ground state and v17, v12or v11.
3.2. Millimeter- and submillimeter-wave spectral analysis First, we performed a preliminary fit using the microwave data measured by Jones et al. (1976) and Caminati et al. (1981) between 10 and 41 GHz in order to obtain the overall rotation and the internal rotation constants in the RAS using the BELGI-Csprogram. These preliminary parameters allowed us to obtain
a starting prediction of the millimeter-wave spectrum between 150 and 330 GHz in the ground torsional state νt= 0. Eventually,
we pursued our assignments up to 660 GHz.
FollowingJones et al.(1976), the electric dipole moment is maximal along the a principal axis (µa= 1.52 D; µb= 0.43 D).
Therefore, rotational structures of a-type R-branch series were identified with a shift between 2 and 10 MHz for lines with Ka 6 5. Then, lines belonging to higher J and Ka values were
progressively assigned and added to the fit. After the a-type transitions were analyzed, we also succeeded in assigning some b-type transitions, even though they are approximatively 12 times less intense [(µa
µb)
2 ≈ 12.5]. In this process, we simultaneously
assigned A- and E-type transitions, for J values up to 75. The same assignment process was pursued in the first and second excited torsional states νt= 1 and 2.
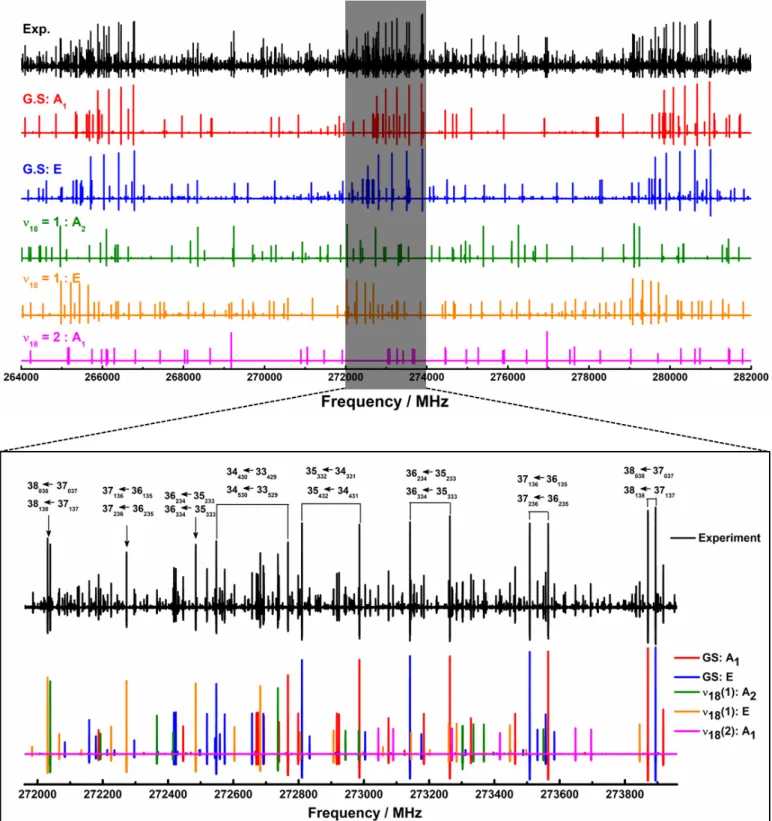
The spectrum was recorded at room temperature close to 300 K. For this reason, it was very dense (as shown in Fig.1) since it contains not only rotational transitions of the ground state but also those belonging to the low-lying excited states, as mentioned earlier in Sect.3.1.
In total, 5154 rotational transitions were assigned in our model and fit with experimental accuracy for J and Ka values
up to 75 and 24, respectively. We weighted all lines into four sets corresponding to differences in measurement accuracy. The first set corresponds to isolated lines with a weight correspond-ing to(∆ν)12, where∆ν is the measurement uncertainty of 30 kHz.
The second set is weighted corresponding to the measurement accuracy of 50 kHz since they are blended lines and their energy levels are degenerated. The third given set weighted to 100 kHz corresponds to relatively broad transitions or those with a weak (S/N) ratio. Finally, we weighted the microwave transitions mea-sured in earlier studies byJones et al.(1976) andCaminati et al.
(1981) to 150 kHz. Indeed, in our fit those lines seem to fit with larger residuals than the measurement accuracy of 100 kHz esti-mated by those authors. The quality of our fit is presented in Table1, with the unitless standard deviations for each torsional state.
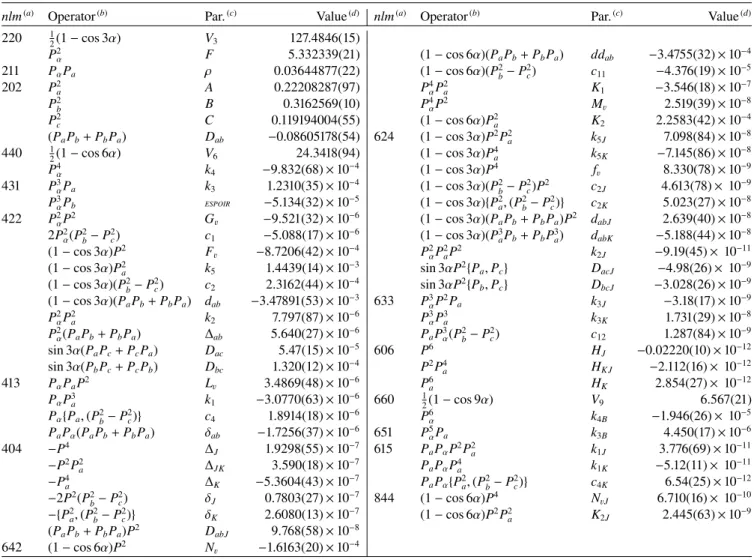
A global unitless standard deviation of 1.01 was obtained by floating 61 parameters for 3599 transitions belonging to the ground state νt= 0, 1391 transitions for ν18= 1, and 164
transitions for ν18= 2. Table2shows the values of the 61
molec-ular parameters obtained by the fit using the BELGI-Cs code
together with the operators that those parameters multiply. The three rotational constants A, B, and C as well as the quartic centrifugal distortion (∆J,∆JK,∆K, δJ and δK) and three sextic
A&A 644, A102 (2020)
Fig. 1.Upper panel: section of experimental spectrum between 264 and 282 GHz (in black) compared to calculated spectra obtained from our fit parameters described in Table2. Lower panel: expanded view of the 271.96−273.96 GHz region showing the assignments (A-species of the GS in red, E-species of the GS in blue, A-species of the ν18= 1 mode in green, E-species of the ν18= 1 mode in orange, and A-species of the ν18= 2 mode
in magenta).
constants (HJ, HK J and HK) were determined. As explained in
Sect. 3.1, in the RAM we also need to fit a parameter (Dab)
that corresponds to the fact that the inertial tensor is not diag-onal. The height of the potential barrier V3 was determined as
127.4846(15) cm−1. We note that as we globally fit the data from νt= 0, 1 and 2, we were also able to determine the value of the
internal rotation constant F= 5.332339(21) cm−1, and the sec-ond and the third terms in the cosine expansion of the potential (V6= 24.3418(94) cm−1, V9= 6.567(21) cm−1). Forty-five
inter-action parameters between rotation and torsion (such as ρ, c2,
c4, k5, k2, k1, etc.), as defined in Table2, were also necessary to
reproduce the observed transitions.
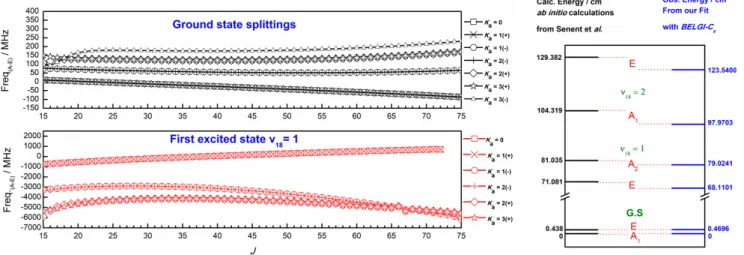
Fig. 2.Left plot: variation of A−E splittings with J values for R-type branches of CH3SC(O)H in the ground state (upper trace) and in the first
torsional state ν18= 1 (lower trace). Right plot: obtained energy levels from our BELGI-Csanalysis compared to those determined bySenent et al.
(2014) with quantum chemical calculations.
Table 1. Overview on the quality of measured lines included in the BELGI-Csfit, for the ground state (GS) and the two first excited states
ν18= 1 and ν18= 2.
Mm-wave and submm-wave data Mw data(a)
G.S ν18= 1 ν18= 2 G.S
Jmax 75 75 75 20
Kmax 24 13 3 6
NA/NE(b) 1831/1714 720/671 164/0 43/11
Std. dev.(c) 0.89 1.20 1.43 0.66
Notes. (a)These 54 lines were measured by Jones et al.(1976) and
Caminati et al.(1981) in the microwave domain between 10 and 41 GHz, and they were added to our new measured 3545 rotational transitions in the final fit. The total number of ground-state νt= 0 transitions is
thus 3599.(b)Number of A- and E-transitions included in our BELGI-C s
global fit.(c)Unitless standard deviation of the fit.
Using the set of parameters of Table2, the millimeter- and submillimeter-wave spectra measured between 150 and 660 GHz are very well reproduced to experimental accuracies, and the main strong rotational lines are assigned as shown in Fig. 1, where a section of 18 GHz (upper part) is presented with a zoomed portion of 2 GHz (lower part).
The internal rotation effect for the CH3SC(O)H molecule
is quite large in comparison with methyl formate. Its barrier height V3 is determined to be relatively low in comparison
with its oxygenated analog methyl formate, CH3OC(O)H, for
which V3= 372.6720(42) cm−1(Ilyushin et al. 2009). As a result,
the A−E splittings are larger in our case where, for Ka 6 3,
differences between A- and E-frequencies vary from −150 to 250 MHz instead of only few MHz for methyl formate for the ground torsional νt= 0 state. Moreover, this splitting between
A-and E-levels becomes larger for excited torsional states (ν18= 1
and ν18= 2), going up to some GHz. The left panel of Fig.2
shows the variation of those A−E splittings with increasing J for ground state (upper trace) and for the first excited state (lower trace). Therefore, the use of a suitable theoretical model based on the RAM is needed to predict these rotational lines correctly. Indeed, the global approach used in the BELGI-Cscode allows
us to treat all the torsional states together in the fit and to deal with the torsion-rotation interaction terms.
In the right panel of Fig. 2, we also compare the torsional energy levels determined by ab initio calculations (Senent et al. 2014) with those determined using our parameters from the fit. The agreement between our observations and those calculations is quite good.
4. Intensity calculation
For calculations of the line strengths, we used the same proce-dure as the one described in detail in Sect. 3.2 ofKleiner 2010. This method had been used for different molecules with Cs
sym-metry containing one methyl rotor such as methyl formate and its isotopologues (Favre et al. 2014;Carvajal et al. 2009,2007;
Haykal et al. 2014;Tercero et al. 2012;Duan et al. 2015) or vinyl acetate (Kolesnikova et al. 2015). We used the BELGI-Cscode
to calculate the line strengths, using the energy parameters deter-mined in Table2. In the same way that the Hamiltonian was used in the calculation and fit of the line positions in the RAM, the calculation of the line strengths also has to be carried out in this same axis system. For this purpose, the components of the dipole moment µaand µbobtained by Stark measurements (Jones et al.
1976) were thus transformed in the RAM system using Eq. (20) ofKleiner(2010) and determined to be 1.527 Debye and −0.404 Debye, respectively. The value of the angle between the PAS and the RAS was calculated using Eq. (1) to be 30.6◦.
The line frequencies, line strengths (S .µ2), and lower state
energies, as well as the assignments for the observed transitions of CH3SC(O)H in the millimeter-wave and submillimeter-wave
ranges are shown in Table A.1. Using a method and a code developed byFavre et al.(2014);Carvajal et al.(2019), we cal-culated the partition function for an internal rotor, including the torsional contribution. The values of the partition function are presented in TableA.2for temperatures allowing the search of this molecule in different regions in warm molecular clouds of the ISM.
5. Search for methyl thioformate in space
Using the rotational constants of Table2and the MADEX code (Cernicharo 2012), we searched for methyl thioformate in warm
A&A 644, A102 (2020)
Table 2. Spectroscopic parameters of CH3SC(O)H in the RAM obtained with the BELGI-Csprogram.
nlm(a) Operator(b) Par.(c) Value(d) nlm(a) Operator(b) Par.(c) Value(d)
220 1 2(1 − cos 3α) V3 127.4846(15) P2 α F 5.332339(21) (1 − cos 6α)(PaPb+ PbPa) ddab −3.4755(32) × 10−4 211 PαPa ρ 0.03644877(22) (1 − cos 6α)(P2b− P 2 c) c11 −4.376(19) × 10−5 202 P2 a A 0.22208287(97) P 4 αP2a K1 −3.546(18) × 10−7 P2 b B 0.3162569(10) P 4 αP2 Mv 2.519(39) × 10−8 P2 c C 0.119194004(55) (1 − cos 6α)P 2 a K2 2.2583(42) × 10−4 (PaPb+ PbPa) Dab −0.08605178(54) 624 (1 − cos 3α)P2P2a k5J 7.098(84) × 10−8 440 1 2(1 − cos 6α) V6 24.3418(94) (1 − cos 3α)P 4 a k5K −7.145(86) × 10−8 P4 α k4 −9.832(68) × 10−4 (1 − cos 3α)P4 fv 8.330(78) × 10−9 431 P3 αPa k3 1.2310(35) × 10−4 (1 − cos 3α)(P2b− P 2 c)P2 c2J 4.613(78) × 10−9 P3 αPb ESPOIR −5.134(32) × 10−5 (1 − cos 3α){P2 a, (P2b− P 2 c)} c2K 5.023(27) × 10−8 422 P2 αP2 Gv −9.521(32) × 10−6 (1 − cos 3α)(P aPb+ PbPa)P2 dabJ 2.639(40) × 10−8 2P2 α(P2b− P 2 c) c1 −5.088(17) × 10−6 (1 − cos 3α)(P3aPb+ PbP3a) dabK −5.188(44) × 10−8 (1 − cos 3α)P2 F v −8.7206(42) × 10−4 P2 αP2aP2 k2J −9.19(45) × 10−11 (1 − cos 3α)P2 a k5 1.4439(14) × 10−3 sin 3αP2{Pa, Pc} DacJ −4.98(26) × 10−9 (1 − cos 3α)(P2 b− P 2 c) c2 2.3162(44) × 10−4 sin 3αP2{Pb, Pc} DbcJ −3.028(26) × 10−9 (1 − cos 3α)(PaPb+ PbPa) dab −3.47891(53) × 10−3 633 P3αP2Pa k3J −3.18(17) × 10−9 P2 αP2a k2 7.797(87) × 10−6 P3αP3a k3K 1.731(29) × 10−8 P2 α(PaPb+ PbPa) ∆ab 5.640(27) × 10−6 PaP3α(P2b− P 2 c) c12 1.287(84) × 10−9 sin 3α(PaPc+ PcPa) Dac 5.47(15) × 10−5 606 P6 HJ −0.02220(10) × 10−12 sin 3α(PbPc+ PcPb) Dbc 1.320(12) × 10−4 P2P4a HK J −2.112(16) × 10−12 413 PαPaP2 Lv 3.4869(48) × 10−6 P6a HK 2.854(27) × 10−12 PαP3 a k1 −3.0770(63) × 10−6 660 12(1 − cos 9α) V9 6.567(21) Pα{Pa, (P2b− P 2 c)} c4 1.8914(18) × 10−6 P6α k4B −1.946(26) × 10−5 PaPα(PaPb+ PbPa) δab −1.7256(37) × 10−6 651 P5αPa k3B 4.450(17) × 10−6 404 −P4 ∆ J 1.9298(55) × 10−7 615 PaPαP2P2a k1J 3.776(69) × 10−11 −P2P2 a ∆JK 3.590(18) × 10−7 PaPαP4a k1K −5.12(11) × 10−11 −P4 a ∆K −5.3604(43) × 10−7 PaPα{P2a, (P2b− P 2 c)} c4K 6.54(25) × 10−12 −2P2(P2 b− P 2 c) δJ 0.7803(27) × 10−7 844 (1 − cos 6α)P4 NvJ 6.710(16) × 10−10 −{P2 a, (P2b− P 2 c)} δK 2.6080(13) × 10−7 (1 − cos 6α)P2P2a K2J 2.445(63) × 10−9 (PaPb+ PbPa)P2 DabJ 9.768(58) × 10−8 642 (1 − cos 6α)P2 N v −1.6163(20) × 10−4
Notes. All values of these rotational constants are in cm−1, except for ρ, which is unitless.(a)n= l + m, where n is the total order of the operator,
lis the order of the torsional part, and m is the order of the rotational part.(b)P
a, Pband Pcare the components of the overall rotational angular
momentum. Pαis the angular momentum of the internal rotor. {u,v} is the anticommutator uv+vu.(c)The product of the parameter and operator
from a given row yields the term actually used in the vibration-rotation-torsion Hamiltonian, except for F, ρ and A, which occur in the Hamiltonian in the form F(Pα−ρPa)2+ APa(d)Values of the parameters from the present fit for νt= 0, 1, and 2. Statistical uncertainties are given in parentheses
in units of the last quoted digits.
Table 3. S-methyl thioformate column densities.
Orion KL(a) Orion KL(a) Sgr B2(b) (MF peak) (ET peak) (IRAM 30m) Coordinates α = 05h35m14.1s α = 05h35m14.4s α = 17h47m20.0s (J2000.0) δ = −05◦22036.800 δ = −05◦22034.7400 δ = −28◦22019.000 HPBW(c)(00) ∼2.0 × 1.5 ∼2.0 × 1.5 30−21 Freq.(d)(GHz) 213.7−246.6 213.7−246.6 80−115.5 vLSR(km s−1) 7.5 8.0 63.5 / 73.5 ∆vFWHM(km s−1) 2.0 3.0 7.0 / 7.0 dsou(00) 3.0 3.0 4.0 / 4.0 Trot(K) 150 150 80 / 80 N(CH3SCOH) ≤1.0 × 10¹⁴ ≤1.0 × 10¹⁴ ≤2.0 / 1.0 × 10¹⁶ (cm−2)
Notes. (a)Physical parameters derived for the main spectral component
of HCOOCH3byTercero et al.(2018).(b)Physical parameters derived for
two spectral components of HCOOCH3byBelloche et al.(2013).(c)Half
power beam width (HPBW) for observations with a single-dish tele-scope (IRAM 30m) and synthetic beam for the ALMA SV observations.
(d)Range of frequencies considered in the analysis.
molecular clouds. High-mass star-forming regions are the best candidates for this search. On one hand, it is well known that methyl formate is one of the most abundant species in hot cores. In addition, these regions are associated with molecular outflows in which large abundances of sulfur-bearing species arise (see e.g., Esplugues et al. 2013; Crockett et al. 2014;
Luo et al. 2019; Belloche et al. 2013). On the other hand, one of the HCOOCH3 derivatives, ethyl formate (HCOOCH2CH3),
has only been unambiguously detected in this kind of region (Belloche et al. 2009, 2013; Tercero et al. 2013, 2015, 2018;
Rivilla et al. 2017;Marcelino et al. 2018). Therefore, we mainly focused on the available astronomical data of Orion KL and Sgr B2. Our frequency predictions are sufficiently reliable for a-type transitions up to 300 GHz, which is the range of the astronomical search. Nevertheless, owing to the high line den-sity of the data and in order to ensure the line identification, we restricted our search to transitions with uncertainties in the predicted frequency of less than 0.1 MHz.
We used the ALMA science verification (SV) data of Orion KL between 213.7 and 246.6 GHz (for observations and data reduction, see e.g., Tercero et al. 2018) and the IRAM 30 m, A102, page 6 of9
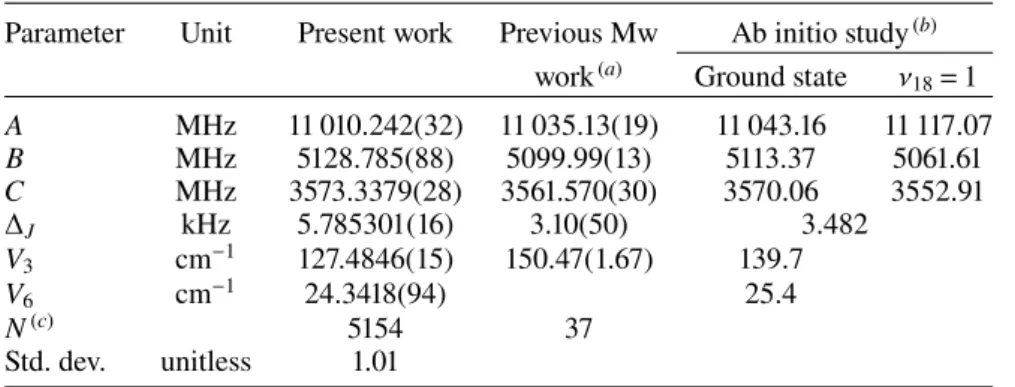
Table 4. Comparison of spectroscopic constants of CH3SC(O)H, obtained by BELGI-Cs,fit with those determined in previous experimental and
theoretical investigations.
Parameter Unit Present work Previous Mw Ab initio study(b)
work(a) Ground state ν18= 1
A MHz 11 010.242(32) 11 035.13(19) 11 043.16 11 117.07 B MHz 5128.785(88) 5099.99(13) 5113.37 5061.61 C MHz 3573.3379(28) 3561.570(30) 3570.06 3552.91 ∆J kHz 5.785301(16) 3.10(50) 3.482 V3 cm−1 127.4846(15) 150.47(1.67) 139.7 V6 cm−1 24.3418(94) 25.4 N(c) 5154 37 Std. dev. unitless 1.01
Notes. Overall rotational constants A, B, and C are transformed into the PAS, as explained in the text.(a)Constants taken from the previous
microwave study (νt= 0) ofCaminati et al.(1981).(b)Values obtained bySenent et al.(2014) using ab initio calculations at the CCSD(T)/VTZ level
of theory.(c)Total number of measured lines used in the fit.
3 mm survey of Sgr B2 provided byBelloche et al.(2013). In the ALMA data, we concentrated the search in the emission peaks of methyl (MF and ET peaks ofTercero et al. 2018). These positions also seem to be associated with the molecular outflow driven by source I (seeTercero et al. 2018and references therein).
We did not find this species above the detection limit of both sets of data. To provide upper limits to its column density, we used MADEX to derive the synthetic spectrum of CH3SC(O)H
for both sources assuming local thermodynamic equilibrium (LTE) and the same physical parameters as those derived for methyl formate by Tercero et al. (2018) and Belloche et al.
(2013) in Orion KL and Sgr B2, respectively. The results are summarized in Table3.
These results provide an abundance ratio of [HCOOCH3]
[CH3SC(O)H]> 10
3
in the emission peaks of methyl formate within Orion KL (Tercero et al. 2018) and a value >14−20 for the different methyl formate components of Sgr B2 (Belloche et al. 2013). It is worth noting that the latter value may be greatly underestimated due to the high level of line confusion in the IRAM 30m data of Sgr B2, which leads to a less constrained upper limit for the CH3SC(O)H
column density in this region. 6. Discussion
The values for the rotational constants A, B, and C with the BELGI-Cs code are obtained via the RAM. To compare them
directly with the values derived from the previous microwave study (Caminati et al. 1981) or with the values calculated by ab initio methods (Senent et al. 2014), we need to transform them from the RAS to the PAS. This transformation is done with a rotation by an angle θRAMbetween the z axis of both systems, as
described in Sect.3.1using Eq. (1) (Kleiner 2010).
Table 4 shows the values of the rotational constants after transforming back to the PAS and comparing with those deter-mined in the literature. The spectroscopic parameters A, B, and Ccarried out in the present study are more accurate, but they are slightly different from those determined in the previous exper-imental microwave investigations (Caminati et al. 1981). They also differ from the values determined by previous theoretical calculations (Senent et al. 2014) by 0.5–1%. This could mainly be explained by the fact that we used a different Hamiltonian based on a “global approach”, taking into account both ground state and excited torsional states with a determination of higher order interaction terms between overall and internal rotations (shown in Table2).
In Fig.3, we show the torsion-rotation interaction diagrams, which represent the reduced energy levels (E − BJ(J+ 1)) in terms of the rotational quantum number J. As shown in Figs.3a and b for A- and E-species, respectively, the torsional levels in ground state with J > 16 begin to be mixed, though rotation-torsional interactions or resonances, with those of ν18= 1 and 2
excited states. Figure3c presents a zoomed section of Fig.3a to highlight the complexity of the interaction scheme for J > 56. As shown in Fig.3d, the interactions often correspond to the rotation-torsion states’ avoided crossings (with large differences in the K values between the interacting energy levels), such as between νt= 0, for values of Ka= 7 and ν18= 1 for 2 6 Ka6 4,
and ν18= 2, Ka≤ 1.
Our global fit represents a clear improvement on previ-ous work, especially for the ground torsional state and the first excited state, which are fit with 54 and 120 kHz standard deviations, respectively. However our analysis only contains a limited number of rotational transitions within ν18= 2, with 164
transitions belonging to the A-species. No E-species could be assigned without ambiguity for this state. Presumably the rota-tional excited torsional states of S-methyl thioformate interact with the levels from other low-frequency vibrational modes, such as the bending of the CSC bond ν12(a0) observed at 245 cm−1
(Jones et al. 1976) and the torsional mode ν17 of the CO
cal-culated at 253 cm−1 (Senent et al. 2014). A natural next step in
the understanding of the rotation-vibrational-torsional spectrum of S-methyl thioformate will be the recording of the far-infrared spectrum at high resolution, in order to measure the torsional fundamental bands at low frequencies. As in the case of methyl formate, the assignment and fit of the higher excited torsional states of S-methyl thioformate will also depend on the global treatment of the various vibrations (Ilyushin et al. 2009). It is possible that the ν18= 2 and ν18= 3 analysis will require
sig-nificant extension of the current model to include suspicious perturbations from the ν12 bending mode at 245 cm−1, or ν17
torsion mode at 253 cm−1. 7. Conclusion
This work presents a global fit consisting of pure rotational tran-sitions and rotation-torsion trantran-sitions using the BELGI-Cscode
for an internal rotor. The present fit makes it possible to repro-duce, from microwave to submillimeter-wave domains, data up to 660 GHz with root mean square deviations close to experi-mental accuracies. Using our spectroscopy work, a deep search
A&A 644, A102 (2020)
Fig. 3.(a,b) Torsion-rotation diagrams (reduced energy) [E − BJ(J+ 1)] in the ground state, the ν18= 1 and ν18= 2 states of torsion for both
A-species (left plot) and E-species (right plot). (c) An enlargement of the torsion-rotation diagram for J values between 56 and 70 in order to highlight how energy levels become close to each other. (d) Examples of perturbations between different torsional states (avoided crossings are shown around J= 61 and 62, as well as around J = 66).
of S-methyl thioformate was carried out in the IRAM 30 m and ALMA data of different high-mass star-forming regions (Orion KL and Sgr B2). We derive an upper limit to the CH3SC(O)H
column density in these regions.
Acknowledgements. This paper makes use of the following ALMA data: ADS/JAO.ALMA #2011.0.00009.SV. ALMA is a partnership of ESO (repre-senting its member states), NSF (USA), and NINS (Japan), together with NRC (Canada), NSC and ASIAA (Taiwan), and KASI (Republic of Korea), in coop-eration with the Republic of Chile. The Joint ALMA Observatory is operated by ESO, AUI/NRAO, and NAOJ. The results are also based on observations obtained with the IRAM 30 m telescope supported by INSU/CNRS (France), MPG (Germany), and IGN (Spain). We would like to thank Dr. Carvajal for kindly providing us values for the partition functions. A.J. and I.K. also thank the French Groupe de Recherche GDR SPECMO for travel fundings. This work was supported by the Programme National Physique et Chimie du Milieu Intestel-laire (PCMI) of CNRS/INSU with INC/INP co-funded by CEA and CNES. B.T. and J.C. thank the ERC for support under grant ERC-2013-Syg-610 256-NANOCOSMOS and the Spanish MINECO for funding support under grants AYA2012-32032 and FIS2014-52172-C2, and the CONSOLIDER-Ingenio pro-gram “ASTROMOL” CSD 2009-00038. J.-C.G. thanks the Centre National d’Etudes Spatiales (CNES) for a grant.
References
Anderson, D. E., Bergin, E. A., Maret, S., & Wakelam, V. 2013,ApJ, 779, 141
Ball, J. A., Gottlieb, C. A., Lilley, A., & Radford, H. 1970,ApJ, 162, L203
Belloche, A., Garrod, R. T., Müller, H. S. P., et al. 2009,A&A, 499, 215
Belloche, A., Müller, H. S. P., Menten, K. M., Schilke, P., & Comito, C. 2013,
A&A, 559, A47
Bockelée-Morvan, D., Lis, D. C., Wink, J. E., et al. 2000,A&A, 353, 1101
Bottinelli, S., Ceccarelli, C., Williams, J. P., & Lefloch, B. 2007,A&A, 463, 601
Brown, R., Crofts, J., Gardner, F., et al. 1975,ApJ, 197, L29
Caminati, W., van Eijck, B. P., & Lister, D. G. 1981,J. Mol. Spectr., 90, 15
Carvajal, M., Willaert, F., Demaison, J., & Kleiner, I. 2007,J. Mol. Spectr., 246, 158
Carvajal, M., Margulès, L., Tercero, B., et al. 2009,A&A, 500, 1109
Carvajal, M., Favre, C., Kleiner, I., et al. 2019,A&A 627, A65
Cernicharo, J. 2012,EAS Pub. Ser., 58, 251
Cernicharo, J., Guelin, M., Hein, H., & Kahane, C. 1987,A&A, 181, L9
Charnley, S. 1997,ApJ, 481, 396
Churchwell, E., & Winnewisser, G. 1975,A&A, 45, 229
Crockett, N. R., Bergin, E. A., Neill, J. L., et al. 2014,ApJ, 787, 112
Demyk, K., Wlodarczak, G., & Carvajal, M. 2008,A&A, 489, 589
Duan, C., Carvajal, M., Yu, S., et al. 2015,A&A, 576, A39
Endres, C. P., Schlemmer, S., Schilke, P., Stutzki, J., & Müller, H. S. 2016,J. Mol. Spectr., 327, 95
Esplugues, G. B., Tercero, B., Cernicharo, J., et al. 2013,A&A, 556, A143
Favre, C., Carvajal, M., Field, D., et al. 2014,ApJS, 215, 25
Fourikis, N., Sinclair, M., Robinson, B., Godfrey, P., & Brown, R. 1974,Aust. J. Phys., 27, 425
Haykal, I., Carvajal, M., Tercero, B., et al. 2014,A&A, 568, A58
Herbst, E., & Van Dishoeck, E. F. 2009,ARA&A, 47, 427
Herbst, E., Messer, J., De Lucia, F. C., & Helminger, P. 1984,J. Mol. Spectr., 108, 42
Hershfield, R., & Schmir, G. L. 1972,J. Am. Chem. Soc., 94, 1263
Hollis, J., Lovas, F. J., Remijan, A. J., et al. 2006,ApJ, 643, L25
Hougen, J. T., Kleiner, I., & Godefroid, M. 1994,J. Mol. Spectr., 163, 559
Ilyushin, V., Kryvda, A., & Alekseev, E. 2009,J. Mol. Spectr., 255, 32
Jones, G. I., Lister, D. G., Owen, N. L., Gerry, M. C., & Palmieri, P. 1976,J. Mol. Spectr., 60, 348
Kleiner, I. 2010,J. Mol. Spectr., 260, 1
Kobayashi, K., Takamura, K., Sakai, Y., et al. 2013,ApJS, 205, 9
Kolesniková, L., Tercero, B., Cernicharo, J., et al. 2014,ApJ, 784, L7
Kolesnikova, L., Peña, I., Alonso, J., et al. 2015,A&A, 577, A91
Lin, C. C., & Swalen, J. D. 1959,Rev. Mod. Phys., 31, 841
Linke, R., Frerking, M., & Thaddeus, P. 1979,ApJ, 234, L139
Lovas, F. J. 2004,J. Phys. Chem. Ref. Data, 33, 177
Luo, G., Feng, S., Li, D., et al. 2019,ApJ, 885, 82
Marcelino, N., Gerin, M., Cernicharo, J., et al. 2018,A&A, 620, A80
McGuire, B. A. 2018,ApJS, 239, 17
Mehringer, D. M., Snyder, L. E., Miao, Y., & Lovas, F. J. 1997,ApJ, 480, L71
Pickett, H., Poynter, R., Cohen, E., et al. 1998,J. Quant. Spectr. Rad. Transf., 60, 883
Remijan, A., Snyder, L., Friedel, D., Liu, S.-Y., & Shah, R. 2003,ApJ, 590, 314
Rivilla, V. M., Beltrán, M. T., Martín-Pintado, J., et al. 2017,A&A, 599, A26
Senent, M., Puzzarini, C., Hochlaf, M., Domínguez-Gómez, R., & Carvajal, M. 2014,J. Chem. Phys., 141, 104303
Tercero, B., Margulès, L., Carvajal, M., et al. 2012,A&A, 538, A119
Tercero, B., Kleiner, I., Cernicharo, J., et al. 2013,ApJ, 770, L13
Tercero, B., Cernicharo, J., López, A., et al. 2015,A&A, 582, L1
Tercero, B., Cuadrado, S., López, A., et al. 2018,A&A, 620, L6
Wakelam, V., Caselli, P., Ceccarelli, C., Herbst, E., & Castets, A. 2004,A&A, 422, 159
Xu, L.-H., Lees, R. M., Crabbe, G. T., et al. 2012,J. Chem. Phys., 137, 104313
Zakharenko, O., Motiyenko, R. A., Margulès, L., & Huet, T. R. 2015,J. Mol. Spectr., 317, 41
Zakharenko, O., Ilyushin, V. V., Lewen, F., et al. 2019,A&A, 629, A73 A102, page 8 of9
Appendix A: Additional tables
Table A.1. Excerpt of the line list for CH3SC(O)H in the microwave and millimeter-wave range.
Upper state Lower state
vt J Ka Kc vt J Ka Kc Sym. Obs. Calc. Obs. − Calc. Eup Elow S*µ2
MHz MHz MHz cm−1 cm−1 Debye2 0 2 1 2 0 1 1 1 A 15 804.360(150) 15 804.262 0.098 48.2813 47.7541 0.192588E+01 0 2 1 2 0 1 1 1 E 15 807.960(150) 15 808.067 −0.107 48.7485 48.2212 0.189151E+01 0 2 0 2 0 1 0 1 E 17 003.290(150) 17 003.268 0.022 48.5911 48.0239 0.250867E+01 0 2 0 2 0 1 0 1 A 17 092.040(150) 17 092.095 −0.055 48.1266 47.5565 0.254265E+01 0 16 5 11 0 15 5 10 E 150 541.933( 30) 150 541.964 −0.031 94.3548 89.3333 0.186967E+02 0 16 5 11 0 15 5 10 A 151 336.356( 30) 151 336.343 0.013 94.0586 89.0106 0.187751E+02 1 21 0 21 1 20 0 20 A 151 567.769(100) 151 567.960 −0.191 182.6137 177.5580 0.230444E+02 1 21 1 21 1 20 1 20 A 151 567.769(100) 151 567.483 0.286 182.6137 177.5580 0.230444E+02 1 21 1 21 1 20 1 20 E 152 072.790(100) 152 072.771 0.019 172.0147 166.9421 0.285556E+02 1 21 0 21 1 20 0 20 E 152 072.790(100) 152 072.789 0.001 172.0147 166.9421 0.285556E+02 2 24 1 23 2 23 1 22 A 183 932.733( 50) 183 932.639 0.094 226.8075 220.6722 0.327233E+02 0 21 20 1 0 20 20 0 A 183 952.286( 50) 183 952.242 0.044 203.5658 197.4298 0.250842E+01 0 21 20 2 0 20 20 1 A 183 952.286( 50) 183 952.242 0.044 203.5658 197.4298 0.250842E+01 2 25 0 25 2 24 0 24 A 184 013.640( 50) 184 013.698 −0.058 225.8189 219.6808 0.319334E+02 1 28 0 28 1 27 0 27 A 201 218.098(100) 201 218.032 0.066 224.6298 217.9179 0.369771E+02 1 28 1 28 1 27 1 27 A 201 218.098(100) 201 218.032 0.066 224.6298 217.9179 0.369771E+02 0 23 6 18 0 22 6 17 E 201 240.369( 30) 201 240.379 −0.010 137.3375 130.6249 0.270077E+02 0 23 22 2 0 22 22 1 E 201 325.474( 30) 201 325.440 0.034 235.4292 228.7137 0.250758E+01 0 23 22 1 0 22 22 0 A 201 389.321( 50) 201 389.268 0.053 235.3366 228.6190 0.248480E+01 0 23 22 2 0 22 22 1 A 201 389.321( 50) 201 389.268 0.053 235.3366 228.6190 0.248480E+01 1 28 1 28 1 27 1 27 E 201 487.949(100) 201 487.963 −0.014 214.1165 207.3955 0.663354E+02 1 28 0 28 1 27 0 27 E 201 487.949(100) 201 487.963 −0.014 214.1165 207.3955 0.663354E+02 0 39 2 37 0 38 2 36 E 294 442.233( 50) 294 442.247 −0.014 254.2485 244.4269 0.815427E+02 0 39 3 37 0 38 3 36 E 294 442.233( 50) 294 442.247 −0.014 254.2485 244.4269 0.815427E+02 0 40 2 38 0 39 2 37 A 301 662.222( 50) 301 662.212 0.010 264.0225 253.9602 0.589426E+02 0 40 3 38 0 39 3 37 A 301 662.222( 50) 301 662.212 0.010 264.0225 253.9602 0.589426E+02 1 65 1 65 1 64 1 64 E 461 957.557(100) 461 957.616 −0.059 628.0309 612.6216 0.150728E+03 1 65 0 65 1 64 0 64 E 461 957.557(100) 461 957.616 −0.059 628.0309 612.6216 0.150728E+03 0 75 1 74 0 74 1 73 A 542 497.712( 50) 542 497.777 −0.065 748.5724 730.4766 0.182046E+03 0 75 2 74 0 74 2 73 A 542 497.712( 50) 542 497.777 −0.065 748.5724 730.4766 0.182046E+03 2 75 1 74 2 74 1 73 A 544 005.163( 50) 544 004.966 0.197 849.2223 831.0762 0.174155E+03 0 75 5 70 0 74 5 69 E 568 540.980( 50) 568 540.717 0.263 812.0658 793.1013 0.152061E+03 0 75 6 70 0 74 6 69 E 568 540.980( 50) 568 540.718 0.262 812.0658 793.1013 0.152061E+03 0 74 6 68 0 73 6 67 A 568 684.774(100) 568 684.805 −0.031 808.1602 789.1909 0.156142E+03 0 74 7 68 0 73 7 67 A 568 684.774(100) 568 684.806 −0.032 808.1602 789.1909 0.156142E+03 0 75 5 70 0 74 5 69 A 569 084.432( 50) 569 084.411 0.021 812.2936 793.3110 0.162207E+03 0 75 6 70 0 74 6 69 A 569 084.432( 50) 569 084.411 0.021 812.2936 793.3110 0.162207E+03
Notes. The table includes assignments, observed frequencies, calculated frequencies from the BELGI − Cs fit, residuals, upper- and lower-state
energy levels, and line strengths S*µ2. The complete table is available at the CDS.
Table A.2. Partition functions of S-methyl thioformate, calculated at different temperatures.
T (K) Qrot(a) Qtor(b) Qvib(c) QRTV(d)
80.0 8501.8 2.83 1.03 24 781.9
150.0 21 828.0 3.62 1.27 100 352.0
225.0 40 100.6 4.18 1.85 310 097.9
300.0 61 738.9 4.53 2.86 799 876.8
Notes. The partition function is calculated using the method described inCarvajal et al.(2019). The experimental vibrational energies are taken from Jones et al. (1976), and the torsional band ν17 (CO-torsion) is
calculated with CCSD(T) by Senent et al. (2014). The nuclear spin degeneracy is assumed as 1.(a)Classical rotational partition function,
calculated for the A-species (the same value is expected for the E-species within this approximation) using rotational constants fromJones et al.(1976).(b)The torsional partition function, calculated using v
t=
0, 1, and 2.(c)The vibrational partition function, calculated using all
the fundamental energy levels except the CH3 torsional mode.(d)The