HAL Id: hal-00301591
https://hal.archives-ouvertes.fr/hal-00301591
Submitted on 1 Jan 2003
HAL is a multi-disciplinary open access
archive for the deposit and dissemination of
sci-entific research documents, whether they are
pub-lished or not. The documents may come from
teaching and research institutions in France or
abroad, or from public or private research centers.
L’archive ouverte pluridisciplinaire HAL, est
destinée au dépôt et à la diffusion de documents
scientifiques de niveau recherche, publiés ou non,
émanant des établissements d’enseignement et de
recherche français ou étrangers, des laboratoires
publics ou privés.
Observations and modelling of soil slip-debris flow
initiation processes in pyroclastic deposits: the Sarno
1998 event
G. B. Crosta, P. Dal Negro
To cite this version:
G. B. Crosta, P. Dal Negro. Observations and modelling of soil slip-debris flow initiation processes in
pyroclastic deposits: the Sarno 1998 event. Natural Hazards and Earth System Science, Copernicus
Publications on behalf of the European Geosciences Union, 2003, 3 (1/2), pp.53-69. �hal-00301591�
Natural Hazards and Earth System Sciences (2003) 3: 53–69 c
European Geosciences Union 2003
Natural Hazards
and Earth
System Sciences
Observations and modelling of soil slip-debris flow initiation
processes in pyroclastic deposits: the Sarno 1998 event
G. B. Crosta and P. Dal Negro
Universit`a degli Studi di Milano Bicocca, Dipartimento di Scienze Geologiche e Geotecnologie, Piazza della Scienza 4, I-20126 Milano, Italy
Received: 27 November 2001 – Accepted: 11 January 2002
Abstract. Pyroclastic soils mantling a wide area of the
Campanian Apennines are subjected to recurrent instability
phenomena. This study analyses the 5 and 6 May 1998
event which affected the Pizzo d’Alvano (Campania, south-ern Italy). More than 400 slides affecting shallow pyroclastic deposits were triggered by intense and prolonged but not ex-treme rainfall. Landslides affected the pyroclastic deposits that cover the steep calcareous ridges and are soil slip-debris flows and rapid mudflows. About 30 main channels were deeply scoured by flows which reached the alluvial fans
de-positing up to 400 000 m3of material in the piedmont areas.
About 75% of the landslides are associated with morpho-logical discontinuities such as limestone cliffs and roads. The sliding surface is located within the pyroclastic cover, gener-ally at the base of a pumice layer.
Geotechnical characterisation of pyroclastic deposits has been accomplished by laboratory and in situ tests. Numer-ical modelling of seepage processes and stability analyses have been run on four simplified models representing differ-ent settings observed at the source areas. Seepage modelling showed the formation of pore pressure pulses in pumice lay-ers and the localised increase of pore pressure in correspon-dence of stratigraphic discontinuities as response to the rain-fall event registered between 28 April and 5 May. Numerical modelling provided pore pressure values for stability analy-ses and pointed out critical conditions where stratigraphic or morphological discontinuities occur. This study excludes the need of a groundwater flow from the underlying bedrock to-ward the pyroclastic cover for instabilities to occur.
1 Introduction
Circumvolcanic areas are exposed to high natural hazards which can heavily impact human safety and activity. Haz-ards are related both to direct volcanic activity (such as lava
Correspondence to: G. B. Crosta
(giovannib.crosta@unimib.it)
effusion or eruptions) and to secondary effects such as debris flows or hyperconcentrated flows. Debris flows are supplied by sediments brought by fall, pyroclastic flows or surges, lava flows, collapses of portions of volcanoes and to the contribu-tion of significant amounts of water. Rainfall or processes related to volcanic activity, such as rapid melting of snow and glaciers near volcanoes, rapid draining of crater lakes by failure of the rim or by ejection of water from crater lakes (Costa, 1984; Smith and Lowe, 1991) provide the necessary amount of water. In some cases eruptions could generate heavy rains that contribute to mobilize pyroclastic deposits as documented for example in Vesuvius activity (Rolandi et al., 1993). In addition, the influence of vegetation changes and of ash fall and pyroclastic flows on hydrologic processes (Smith and Lowe, 1991; Suwa et al., 1997) must be considered. The reduction of the vegetation cover leads to the decrease of in-filtration capacity of soils and the increase of runoff which erodes sediments and could generate debris flows.
Volcanic debris flows are the most powerful kind of de-bris flows according to volume of transported mass, trav-elled distance and extension of damaged areas (Perov et al., 1997). Lahars have been recognised as the principal cause of destruction and fatalities in volcanic settings (Costa, 1984). Examples of catastrophic events are widely reported in liter-ature (Fairchild, 1987; Pierson et al., 1990; Rodolfo and Ar-guden, 1991; Vallance and Scott, 1997; Zimmermann et al., 1997; Mothes et al., 1998). Studies carried out in volcanic areas (Suwa et al., 1997; Zimmermann et al., 1997) assert that sediment delivery from volcano slopes, substantially by means of debris flows, follows an exponential decay from the time of eruption. This statement should be considered strictly valid only for volcano slopes.
This paper focuses on natural hazards related to debris flow occurrence in perivolcanic areas, and with an high im-pact both immediately after eruptions and after long time.
As a consequence of fall-out, pyroclastic flows, surges, and subsequent weathering processes, circumvolcanic ar-eas undergo changes in geological, geomorphologic, hydro-logic and hydrogeohydro-logic settings. The emplacement of layers
54 G. B. Crosta and P. Dal Negro: Soil slip-debris flow initiation process in pyroclastic deposits
Fig. 1. Landslide inventory map for the 5–6 May 1998 Sarno event. 1: source area, 2: transport area, 3: accumulation of debris flows and lateral lobes, 4: site of in situ permeability tests, 5: field surveyed landslide. Source areas are very small and difficult to be shown at this scale.
with vertical and lateral contrasting properties on very steep slopes, in conjunction with local geomorphologic features, determines the predisposing factors for landslide occurrence. The town of Sarno (Campania, Southern Italy) (Fig. 1) is located 18 km to the east of the Somma- Vesuvius volcanic edifice. On May 1998, several hundreds of soil slip-debris flows involved huge volumes of pyroclastic material.
Wide areas of the Campanian Apennines are covered by volcaniclastic deposits frequently affected by landslide events; occurring with yearly frequency in the last two decades. Their occurrence is widely documented in litera-ture (Cardinali et al., 1998; Del Prete et al., 1998; Calcaterra et al., 2000a; Pareschi et al., 2000). Guzzetti (2000) shows that in the time span from 1410 AD to 1999 AD Campania is the second most affected Italian region by landslide disas-ters. This is true both for the frequency and the magnitude of events.
The 1998 event is unique for the huge number of fail-ures that took place. For example, the 9–11 January 1997 event in the Sorrentine Peninsula-Lattari Mountains area trig-gered more than 400 instabilities of different type (soil slips, slumps, rockfalls, flows, topplings) on a much larger area.
2 Geological and geomorphologic settings
The Pizzo d’Alvano massif is a NW-SE trending horst, with steep slopes bordered on the SW side by the Campanian Plain graben. It is composed of limestones and calcareous marls
intercalations of Cretaceous age. Strata gently dip (25◦–30◦)
toward N–NW, outlining a monocline. Two major joint sys-tems are present trending NE–SW (antiapenninic trend) and NW–SE (apenninic trend), like major regional structures. El-evation ranges from 30 m a.s.l to 1133 m a.s.l. The mean
terrain gradient along the slopes is 34◦ whereas
subverti-cal limestone cliffs interrupt their morphologisubverti-cal continuity (Fig. 2).
Bedrock has been affected by karstic processes which influence both the geomorphologic settings and the deep groundwater flow (Celico and Guadagno, 1998).
The Pizzo d’Alvano slopes are mantled by pyroclastic deposits mainly associated with explosive activity of the Somma-Vesuvius. Air-fall deposits were dispersed from N– NE to S–SE, according to prevailing wind direction and cov-ered a wide area reaching distances up to 50 km.
The stratigraphical settings of the Quaternary pyroclastic cover have been described by field surveys. Pumiceous and ashy deposits belonging to at least 5 different eruptions were
G. B. Crosta and P. Dal Negro: Soil slip-debris flow initiation process in pyroclastic deposits 55
Fig. 2. Landslide scars uphill of Episcopio. The widening of initial slides on rectilinear or convex slopes is evident. Note the presence of rocky cliffs interrupting the morphological continuity of slopes.
recognised. From the older to the younger, they are: Ot-taviano Pumice (8000 years b.p.), Avellino Pumice (3800 years b.p.), 79 A.D. Pumice, 472 A.D. Pumice, 1631 A.D. Pumice. The 79 A.D. Pumice have been certainly recognised only in the lowlands (Rolandi et al., 2000). The deposits have been affected by pedogenetic processes, determining an alternation of pumiceous levels (C horizons) and buried soils (A or B horizons). According to the terminology adopted for soil layers and genetic soil horizons (USDA, 1998), A and B horizons are mineral horizons, with all or many of the original deposit structure and characteristics having been obliterated. C horizons are the soil’s parent material. The layers discontinuously mantle the slopes, showing both lat-eral and longitudinal terminations, also along distances of a few metres. Hollows usually preserve a larger number of pumiceous levels than in convex areas. Field work showed that total depth of pyroclastic cover increases from ridges to open slopes to hollows, and from crest (about 1,5–2 m) to the foot of slopes (several metres), in agreement with ob-servations in similar geomorphologic settings (Celico et al., 1986). Thickness increases also from steep slopes towards the upper palaeo-surfaces, which are characterised by wide flat karstic plains and gentle residual relief (Brancaccio et al., 2000). Boreholes in these flat areas showed a total thick-ness greater than 14 m (Celico et al., 2000). Wide coalescing alluvial fans form the transition from alluvial plains to cal-careous slopes. The considerable areal and volumetric extent of alluvial fans, as well as sedimentologic evidence suggests that, besides a consistent primary volcanic sedimentation, a great sediment supply from upslope took place, both as post-eruption remobilization of unstable air-fall volcaniclastic
de-posits and as debris flow activity (Dal Negro, 2000). Karstic springs are located at the foot of the slopes (S. Maria la Foce, Mercato-Palazzo, Cerola, S. Marina di La-vorate). Water supplies to deep karstic aquifer is modulated by the overlying pyroclastic aquifer. Deep gullies, along the Pizzo d’Alvano slopes, are scoured by ephemeral creeks that are active during intense rainfall and rill erosion is evident along the slopes.
The upper flat areas and the toe of slopes have been ter-raced for prevalent hazelnut cultivation. In relation to this activity an extended road network has been realised. From analysis of aerial photos (1954, 1974, 1990, 1996, 1998) a great increase in road density has been recognised in the last 30 years.
3 Meteorological event
Two main rain gauges (Lauro, near Quindici, at 192 m a.s.l. and Sarno at 36 m a.s.l., Fig. 1), are located close to the 1998 landslide area on the Pizzo d’Alvano, but no rain gauges were present at higher elevations. The high spatial variabil-ity of intense rainfall events, documented in adjacent areas (Sorrentine peninsula and Lattari mountains, De Falco et al., 1997), and the orographic effect associated with these slopes that are exposed to prevalent wind direction make the anal-ysis of rainfall data difficult. The Lauro rain gauge can be considered the most representative because of the distance from landslide initiation areas and the recorded amount of rain (173 mm in 48 h). The antecedent rainfall recorded at Lauro from 28 April to 3 May amounts to 61.4 mm and sim-ilar values were recorded at other rain gauges in the area. The daily rainfall for the four antecedent months at the Ponte Camerelle rain gauge (97 m a.s.l.) can be found in Del Prete et al. (1998). The 1998 rainfall event showed a first low in-tensity burst from 00:00 LT to 05:00 LT on 4 May. After a break of 11 h, it rained uninterruptedly till early morning on 6 May (Onorati et al., 1999). The hourly and cumulative rain-fall at the Lauro station are reported in Fig. 3. A maximum rainfall intensity of 15 mm/h was registered at 15:00 LT on 5 May; the mean intensity over 48 h was 3,6 mm/h.
The maximum rainfall recurrence time is of 33 years for the 24 h rainfall recorded at Lauro (Onorati et al., 1999), and shorter recurrence times have been computed for other rain-fall durations. The rainrain-fall pattern suggests the occurrence of an intense but not exceptional event, in contrast with the severity of landsliding. An insight comes from the analysis of rainfall data for past instabilities affecting the pyroclastic covers in the area. The intensity versus duration values for events that triggered shallow soil slips and debris flows all over the world and in the Campanian Apennines are plotted in Fig. 4. The intensity vs duration relationship proposed by
56 G. B. Crosta and P. Dal Negro: Soil slip-debris flow initiation process in pyroclastic deposits Figure 3 0 2 4 6 8 10 12 14 16 1 3 5 7 9 11 13 15 17 19 21 23 25 27 29 31 33 35 37 39 41 43 45 47 Time (h) Hourly inten sity (mm/h) 0 20 40 60 80 100 120 140 160 180 200 Cumulative rainfal l (mm) hourly intensity cumul. rainfall 4 May 5 May
Fig. 3. Hourly intensity and cumulative rainfall recorded from 00:00 LT on 4 May at Lauro rain gauge (192 m a.s.l.). Gray and white arrows point the time of landsliding at Quindici and Sarno, re-spectively. Figure 4 0,1 1 10 100 1000 0,01 0,1 1 10 100 1000 10000 Duration (h) Ra in fa ll In te n s ity (mm/h ) International literature Campanian Apennines Sarno 1998 Crosta & Frattini, 2001 Calcaterra et al., 2000b, (1) Calcaterra et al., 2000b, (2) Ceriani et al., 1992 Guadagno, 1991 I = 33.27 * D-0.61 I = 28.1 * D-0.74 I = 176.4 * D-0.90 I = 8 * (0.9 / D + 0.06) I = 20.1 * D-0.55
Fig. 4. Log I vs Log D plot of rain-fall which triggered shallow soil slips and debris flows at different sites in the world. Data have been collected by the soil slip and soil slip-debris flow lit-erature by Crosta and Frattini (2002). Data from Campanian Apennines and for the 1998 Sarno event (Guadagno, 1991; Del Prete et al., 1998; De Vita, 2000; Calcaterra et al., 2000b), are evi-denced. Crosta and Frattini (2002) and Ceriani et al. (1992) thresholds are re-ported together with those previously published for the Campanian Apen-nines (Guadagno, 1991; Calcaterra et al., 2001).
Crosta and Frattini (2002) on the basis of a world wide data set fits as a lower bound threshold for landslide occurrence in Campanian pyroclastic covers. For the Sarno event a bet-ter fitting is obtained by the threshold proposed by Ceriani et al. (1992) on completely different soils. Rainfall thresh-olds, as proposed by Guadagno (1991) and by Calcaterra et al. (2000b), give critical rainfall values that are too high with respect to the observed values (Fig. 4). Rainfall of long du-ration (D) and low to medium intensity (I) seems more effi-cient in triggering instabilities in the Campanian settings than high I – short D events. Nevertheless, very intense short rain-fall have been critical in some occasions (e.g. October 1954 Salerno event: 504 mm of rainfall in 16 h, Lazzari, 1954). This peculiarity can be explained considering the high water retention (up to 100% of dry weight) of volcaniclastic de-posits. In this way, rainfall patterns which enhance infiltra-tion over prolonged time determine a great increase of the unit weight, beside decreasing shear strength, much more
than in other materials. The exceptionality of the event is evident when considering that May is at the end of the rainy season and that it rained for nine consecutive days. Maxi-mum rainfall intensity (ca. 15 mm/h), recorded during the last two days of the event, show a recurrence time greater than 100 years when compared with data for the spring pe-riod.
4 Landslide analysis
4.1 Description of the 1998 event
The Pizzo d’Alvano was affected by a widespread landslide event from the afternoon on 5 May till the early hours of the next day. The first landslides were recorded at Quindici between 12:00 and 12:30 LT and successive failures on the northern side occurred between 14:00 and 15:30 LT, be-tween 18:00 and 18:30 LT, and at 20:30–21:00 LT.
Land-G. B. Crosta and P. Dal Negro: Soil slip-debris flow initiation process in pyroclastic deposits 57
Table 1. Description and diffusion of landslides observed during the 5–6 May 1998 event on the Pizzo d’Alvano
Typology of landslide Description Number Total
Failures at the channel head Soil slips/debris flows reaching the alluvial fans 139
Soil slips/debris flows evolving to hyperconcentrated flows
which did not leave significant 33 172
evidences of their passage on alluvial fans
Lateral failures Landslides related to the
passage of the main flows in the 99
valley axis
Landslides independent to the 202
passage of the main flows in the 103
valley axis
Soil slips Soil slips which did not evolve
in debris flows 60 Total number 434 Morphological discontinuities 0 10 20 30 40 50 A B C D No morph. disc. relative percentage (%) Sarno Siano Bracigliano Quindici
Slope morphology at source area
0 10 20 30 40 50 60 Valley axis Valley sides Open slopes Ridges relative percentage (%) Sarno Siano Bracigliano Quindici D C A B a) b)
Fig. 5. Morphological characteristics of source areas and relative frequency: (a) road cut with instabilities in the upslope sector and within the downs-lope earth fill; (b) rock cliff inducing a natural interruption of volcaniclastic
cover. About 75% of the landslides
took place at sites with morphologic and stratigraphic interruptions of pyro-clastic covers.
slide activity developed in the Sarno area at 16:00 LT, 20:00 and 22:00 LT. These landslides are classified as soil slip-debris/earth flows, from very to extremely rapid, with high water content (Cruden and Varnes, 1996), but the term rapid mudflow seems more precise in the description (Hutchinson, 1988). According to Pierson and Costa rheological classifi-cation (1987) these phenomena are identified as slurry flows evolving into hyperconcentrated flows.
More than 400 soil slips were triggered and most of them transformed into debris flows (see Table 1, Dal Negro, 2000).
They scoured the pyroclastic cover and vegetation along their path, and incorporated bedrock fragments. Flows were con-fined in very deep (up to 30 m) natural channels in the up-per sector of the alluvial fans. Overbanking occurred on sharp bends along their path. Velocities between 9.3 m/s and 10 m/s have been estimated measuring superelevations of flows in correspondence of bends (Johnson and Rodine, 1984). Spreading and deposition of muddy detrital sediment occurred along the lower unchanneled sector of the alluvial fans. Maximum thickness of the deposits (about 3.5 m) was
58 G. B. Crosta and P. Dal Negro: Soil slip-debris flow initiation process in pyroclastic deposits
Fig. 6. Photo taken downward from the source area of a landslide occurred at Bracigliano. Failure surface is within the pyroclastic cover; the bedrock is exposed some metres downslope from source area.
recorded in the axial part of flow. Rapid mudflows destroyed houses and settlements in these areas, killing 137 people at Episcopio, 11 at Quindici, 6 at Bracigliano and 5 at Siano.
4.2 Landslides characteristics
Analysis of post event aerial photos and field investigations allowed to reconstruct the pattern and characteristics of the landslides in the Pizzo d’Alvano area. Detailed field surveys were conducted at 26 landslide sites (Fig. 1) chosen accord-ing to their geomorphologic settaccord-ings and accessibility. 434
single scars over an area of 65 km2(Table 1) were mapped.
This number is higher than other determinations (e.g. 300 by Calcaterra et al., 2000b; 129 by Guadagno and Perriello Zampelli, 2000). This discrepancy can derive by consider-ing major landslides or the sconsider-ingle scars composconsider-ing it or mi-nor aborted failures, or different methodology of survey. The 13.5% of the total number of landslides were soil slips which did not evolve into debris flows, whereas 7.2% were diluted flows with no consequence in transport zones and on alluvial fans. Lateral landslides (with respect to major channelled flows) are distinguished in Table 1 as related or not to the passage of the main flow along the valley axis according to
Fig. 7. Idealized stratigraphy of the pyroclastic cover in the upper slopes of Pizzo d’Alvano, with the frequency distribution of failure surfaces as observed from field surveys. It is evident the prevalence of failure surfaces within pumice layers. 79 d.C. Pumice were rarely and discontinuously surveyed along the slopes.
their morphology and to the presence of physical interrup-tions of the pyroclastic cover (e.g. bedrock cliffs or roads).
Landslides started high on the slopes, between 700 m and
950 m a.s.l, with slope angles between 33◦and 55◦. On
aver-age, slides were 20 m wide but frequently increased rapidly in breadth reaching 100 m, especially on the northern side of the Pizzo d’Alvano. Mean slide surface depth is about 1 m, with maximum of 1.8 m, so that landslides initially involved only a few tens of cubic metres of soils. The debris flows usu-ally travelled a 2000 to 3000 m long horizontal distance (L), with relieves (H) of about 600–700 m (maximum 850 m at Sarno), determining H/L values between 0.2 and 0.35. While flowing the involved volume greatly increased although bulk-ing changed for different flows. A linear erosion rate rangbulk-ing
from a few cubic metres to more than 80 m3/m has been
de-termined. The maximum rate has been determined for flows with initial failure located on open or convex slopes and rapid increase in the width of transport zone (see Fig. 2). Erosion along the channels can be recognised up to the apex of allu-vial fans. Debris flows stopped in unchannelled areas with
mean slope of 9◦. The deposits are matrix supported and
formed by pyroclastic soils, pumice, subordinate limestone clasts and vegetation debris. The deposited volume for each
flow is in the order of 104up to 105m3.
Morphological surveys at source areas (excluding lateral instabilities related to the passage of main landslides) are summarised in Fig. 5. About 75% of the landslides occurred along valley axis or flanks, where runoff or superficial flow convergence occur. More than half of initial slides are lo-cated upslope of morphological discontinuities such as lime-stone cliffs and roads, which interrupt the stratigraphical con-tinuity of pyroclastic deposits. Natural discontinuities (e.g. limestone cliffs) are more important than artificial ones (e.g. roads, Fig. 5) on southern slopes, and the opposite is true on
G. B. Crosta and P. Dal Negro: Soil slip-debris flow initiation process in pyroclastic deposits
Figure 8
59Figure 8
4 6 8 10 12 14 16
Dry bulk density (kN/m3)
Guadagno and Magaldi 2000 Celico et al., 1986 Guadagno, 1991 Guadagno, 1991 Guadagno et al., 2000 Guadagno et al., 2000
Scotto di Santolo et al., 2000 Terlien, 1996
Terlien, 1996
This study
Dry bulk density (kN/m3)
1,0E-10 1,0E-08 1,0E-06 1,0E-04 1,0E-02 1,0E+00
Hydraulic conductivity (m/s) Celico and Guadagno, 1998 Celico and Guadagno,1998 Kitamura et al., 1988 Kitamura et al., 1988 Maeda et al., 1977 Terlien, 1996 Terlien, 1996 This study Hydraulic conductivity (m/s) 20 25 30 35 40 45 50
Peak friction angle (°)
Guadagno and Magaldi 2000 Celico et al., 1986 Kitamura et al., 1988 Kitamura et al., 1988 Aleotti et al., 2000 Scotto di Santolo et al., 2000 Terlien, 1996 Guadagno, 1991 Guadagno, 1991 This study
Peak friction angle (°)
0 10 20 30 40 Cohesion (kPa) Guadagno and Magaldi, 2000 Celico et al., 1986 Kitamura et al., 1988 Aleotti et al., 2000 Scotto di Santolo et al., 2000 Terlien, 1996 This study Cohesion (kPa)
Fig. 8. Comparison between measured geotechnical parameters and literature data. Solid line refers to paleosoils, dotted line to pumice, dashed and dotted line to undifferentiated pyroclastic deposits. Shaded areas show the range of values measured in this study.
northern slopes. This pattern reflects the different distribu-tion of roads along the Pizzo d’Alvano slopes.
In all the observed cases the failure surface is located within the pyroclastic cover and never at the contact with underlying bedrock. Bedrock crops out only some tens of metres downslope from the source area (Fig. 6). This ob-servation excludes two triggering processes for these land-slides: the hydraulic underpressure model and the ground-water rising. The hydraulic underpressure model (Celico et al., 1986) states that failures are in relation with groundwater flow from the bedrock and connected to water flow in the up-per and more up-permeable portion of karstic limestones. The second model assumes the water table rising at the boundary between bedrock and the pyroclastic cover as a consequence of the different hydraulic conductivity. This model is usually suggested to explain the triggering of shallow landslides in colluvial and regolithic materials (Campbell, 1975; Skemp-ton and DeLory, 1957).
The failure surfaces are usually planar and dip at an
an-gle variable from 40◦ to 58◦ (45◦on average). In 58% of
the observed failures, the surface is located at the bottom of
a pumice layer, whereas in 26% of the cases it is within a palaeosoil (Fig. 7) and usually between horizons with dif-ferent characteristics. For 13% of the landslides, the failure occurred in undifferentiated colluvium (soil with dispersed pumice and limestone fragments). Only in one case (3%), the instability occurred within earthfill materials, but this value is higher when considering the entire landslide population. In fact, field surveys were localised along the southern slopes where roads are rare.
In hydrologically triggered landslides the localisation of zones with positive pore pressure gives indication for poten-tial failure sites (Terlien, 1996). In this study, field obser-vations constrain the mechanism involved in the build-up of pore pressure. In particular, the prevalence of failure surfaces located at the bottom of a pumice layer allows to hypothesize the formation of perched water tables within pumice layers. This assumed mechanism must be verified. In order to do it, field and laboratory tests, numerical modelling of seepage processes in pyroclastic covers and stability analyses were carried out.
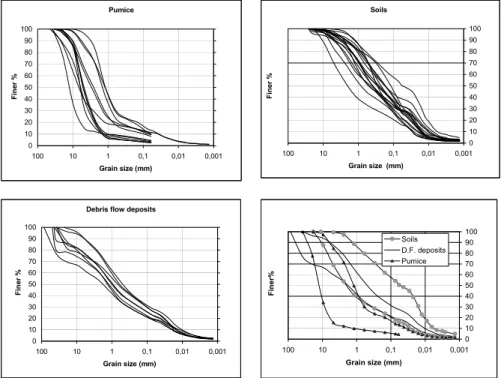
60 G. B. Crosta and P. Dal Negro: Soil slip-debris flow initiation process in pyroclastic deposits Figure 9 0 10 20 30 40 50 60 70 80 90 100 0,001 0,01 0,1 1 10 100 Grain size (mm) Fine r% Soils D.F. deposits Pumice Pumice 0 10 20 30 40 50 60 70 80 90 100 0,001 0,01 0,1 1 10 100 Grain size (mm) Fi ne r %
Debris flow deposits
0 10 20 30 40 50 60 70 80 90 100 0,001 0,01 0,1 1 10 100 Grain size (mm) Fi ne r % Soils 0 10 20 30 40 50 60 70 80 90 100 0,001 0,01 0,1 1 10 100 Grain size (mm) Fi ne r %
Fig. 9. Grain size analyses for soil sam-ples collected from pumice and soil lay-ers at failure surfaces. Samples from the landslides accumulations have been collected and results are compared with those from failure areas.
5 Geotechnical properties
In order to characterise the mechanical behaviour of soils and tephra involved in landsliding, samples have been collected at some source areas.
It has been recognised that pumice have a particular geotechnical behaviour (Esposito and Guadagno, 1998). Moreover pyroclastic soils mantling the Pizzo d’Alvano show a peculiar mineralogical composition, which influences their geotechnical properties. An allophane and imogolite content ranging between 6% and 20% has been identified in these soils (Terribile et al., 2000; de Gennaro et al., 2000). Allophanic soils show peculiar geotechnical properties as low bulk density, high porosity, high water retention values at saturation, high liquid limit and low plasticity (Maeda et al., 1977). The most remarkable characteristic of these soils is represented by the irreversible changes on drying. Fur-thermore soils in the study area show thixotropic properties, related to the presence of low-grade cristallinity clays. This characteristic could play an important role in the downslope propagation and enlargement of initial slides.
Undisturbed soil samples were collected with an hand soil core sampler at landslide scars, to determine unit weight. Dry
unit weight ranges between 7.2 kN/m3and 9.9 kN/m3. This
is the result of the high content in organic matter (between 5,1% and 19,6%), the low bulk density of pumiceous clasts, and the high porosity ranging between 58% and 67%.
In Fig. 8 some of the determined geotechnical proper-ties are compared with values reported in literature for sim-ilar materials. Results of grain size analyses performed on palaeosoils, pumice layers and debris flow deposits are re-ported in Fig. 9. Pumiceous layers are coarser than buried
soils, and could be identified as gravel with sand (GW) and as silty sand with gravel (SP-SM) when pedogenised. Buried soils are classified as sand with silt (SM) with a mean per-centage of fines (φ < 0,074 mm) equal to 30%. Debris flow deposits show an intermediate granulometric range between that of pumice horizons and buried soils, and are sand with silt and gravel (SM) with an additional content (about 10%) of limestone clasts larger than 75 mm.
Aerometries have been conducted on air-dried samples at room temperature. This non standard procedure has been fol-lowed to avoid or minimize the possibility of aggregation of clay and silt particles on drying. Maeda et al. (1977) pointed out the relevance of this process on allophanic soils. Com-paring these grain size determinations with those performed on the same soils by other authors it can be stressed that, notwithstanding the precautions, laboratory analyses under-estimate the finer fraction of soils (Guadagno and Magaldi, 2000).
Atterberg limits have been determined by complete drying of samples before determining the limits, and using samples at the natural water content. Soils are non plastic. Liquid limits are not very high, ranging between 39% and 78% and higher determinations are influenced by organic matter con-tent ranging between 5% and 20% (Fig. 10). A constant de-crease, usually 10%, of liquid limits as a consequence of dry-ing has been observed. This is probably related to the organic matter and the allophanic content and to the wetting-drying cycles that soils have suffered.
Direct shear tests have been conducted on soil samples collected in correspondence of the slide surfaces, and re-constituted with sieved material finer than 2 mm to eliminate pumiceous clasts greater than 2 mm in the soils that could
G. B. Crosta and P. Dal Negro: Soil slip-debris flow initiation process in pyroclastic deposits 61
Table 2. Direct shear strength determinations. B stands for mineral horizons of soil profile, dominated by the obliteration of all or much of the original deposit structure. The lower case suffixes b stand for buried horizons, t for clay accumulation, and w for little or no apparent illuvial accumulation of materials (terminology adopted according to USDA (1998))
Sample number Horizon Cohesion (kPa) Peak friction angle (◦) Residual friction angle (◦)
1 3 Bw1 18.3 35.5 35.0 2 2 Bb 34.0 38.5 38.0 3 4 Bt2 3.0 44.9 38.3 4 2 Bt1 15.0 40.9 39.3 5 3 Bt1 0 39.7 38.8 6 4 Bt2 10.0 37.8 37.8 7 2 Bw2 10.0 45.9 41.2 Figure 10 0 10 20 30 40 50 60 70 80 90 Organic matter (%) Li qui d li mi t (% ) L.L. on wet samples L.L. on dried samples 5 8 10 20
Fig. 10. Liquid Limit determinations for samples from paleosoils (same as in Fig. 9). Results obtained by adopting different treatment techniques for the samples are shown. Oven dried samples always show a lower liquid limit with respect to samples treated with no drying.
have altered determinations. The applied normal loads range between 50 kPa and 200 kPa. Results are reported in Table 2.
The peak friction angle ranges between 35.5◦and 45.9◦.
It appears very high, but similar values have been obtained by Aleotti et al. (2000) for soils (Fig. 8) and by Guadagno
et al. (1999) for pumice (38◦–45◦). Residual friction
an-gle is similar to the peak anan-gle, ranging between 35◦ and
41◦. These high values could be due to the presence of
allo-phane. This clay does not show the characteristic platy shape of clay particles and this excludes the reorientation of parti-cles in shearing. Cohesion ranges from 0 kPa to 34 kPa, in accordance with values reported in literature. A Guelph con-stant head permeameter has been used to investigate in situ hydraulic conductivity of pyroclastic soils. This instrument
determines hydraulic conductivities ranging from 10−4m/s
to 10−8m/s, at depths between 0 cm and 120 cm. The sites
of testing are reported in Fig. 1. Soils show hydraulic
con-ductivities ranging between 10−5m/s and 10−7m/s whereas
Fig. 11. In situ permeability values obtained by Guelph perme-ameter tests within the pyroclastic cover. Data plotted on the upper surface and just below it refer to tests performed on grass covered surfaces and on surfaces with removed grass, respectively. Tests at the surface have been performed through a Guelph permeameter equipped with an infiltrometric ring. Numbers refer to the location of tests. Maximum investigated depth is 1.2 m. SM and GW stand for silty sand and well graded gravel (USCS classification), respec-tively.
no determinations have been possible in pumice layers. Hy-draulic conductivity of pumice is too high to be detected with Guelph permeameter. We can assume for pumice layers an
hydraulic conductivity greater than 10−4m/s. Field analyses
did not show a clear inverse correlation of hydraulic conduc-tivity with depth (Fig. 11), as found for pyroclastic deposits of Pizzo d’Alvano by Celico et al. (2000). This could be due to the limited depth investigated by field tests and in-terested by slope failures. Permeability tests have been
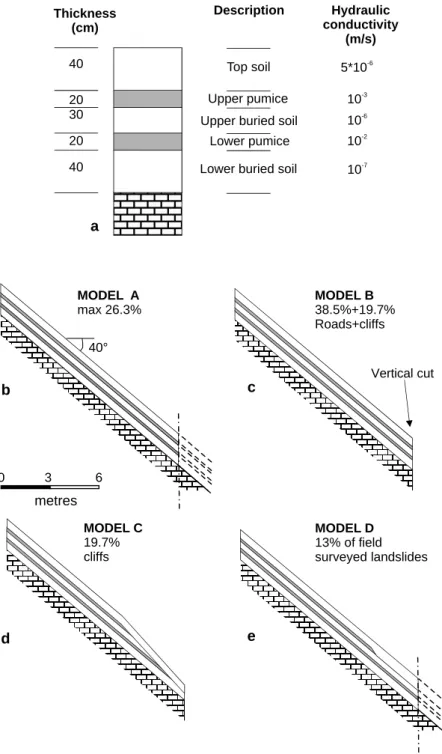
con-62 G. B. Crosta and P. Dal Negro: Soil slip-debris flow initiation process in pyroclastic deposits MODEL A max 26.3% 40° MODEL B 38.5%+19.7 Roads+cliffs % MODEL D 13% of field surveyed landslides MODEL C 19.7% cliffs 0 3 6 metres Lower pumice Upper buried soil
Upper pumice Hydraulic conductivity (m/s) Thickness (cm) 5*10-6 10-3 40 20 30 20 40 10-7 10-2 10-6
Lower buried soil Description Top soil a b c d e Vertical cut
Fig. 12. (a) Simplified stratigraphy of the pyroclastic covers and hydraulic parameters adopted in numerical mod-elling. (b)-(c)-(d)-(e): Geometrical and stratigraphical settings of the four mod-els on which simulation of seepage pro-cesses and stability analyses have been performed. (b) slope with no disconti-nuity interrupting soil layers; (c) pres-ence of a vertical cliff at the lower end of the modelled slope sector, (d) downs-lope pinching out of soil and pumice layers with a colluvial cover, (e) longi-tudinal discontinuity (in the downslope direction) of the upper pumice layer in a continuous slope sector. Percentages refer to the relative frequency of each model condition. 10 m long model are represented.
ducted with and without grass cover, and these few measure-ments suggest a decrease in permeability in fallow soils, as described in the literature (Ziemer, 1981).
6 Numerical modelling
Numerical modelling of seepage processes in pyroclastic soils has been performed by a 2-D finite element code (SEEP/W, Geoslope, 1998) to support field observations about location and failure surface characteristics. The com-puted pore pressures have been used in slope stability
analy-ses to determine the safety factors under different geometri-cal and stratigraphigeometri-cal conditions and at different time steps. A simplified stratigraphical model (Fig. 12a) has been adopted for the Quaternary volcaniclastic cover. Numeri-cal analyses have been performed on four models represen-tative of distinct geomorphologic settings along the slopes (Figs. 12b–e). The total thickness of the soil sequence re-flects the mean values observed during field work at land-slides scars. Hydraulic conductivities are those obtained by the in situ tests, excepted for pumice layers for which values have been inferred by literature (Fig. 8). Hydraulic
conduc-G. B. Crosta and P. Dal Negro: Soil slip-debris flow initiation process in pyroclastic deposits 63
Figure 13
V o lu me tr ic wa te r c o n te n t, ϑϑϑϑ0,1
0,2
0,3
0,4
0,5
0,6
0,7
0,8
0,1
1
10
100
Matric Suction (kPa)
(c m 3 /c m 3 ) Buried soils Pumice Top soil
Fig. 13. Volumetric water content,
θ, versus matric suction characteristic
curves adopted in numerical modelling for pyroclastic deposits.
Figure 14 0 2 4 6 8 10 12 14 16 0, 0E +00 4, 3E +04 8, 6E +04 1, 3E +05 1, 7E +05 2, 2E +05 2, 6E +05 3, 0E +05 3, 5E +05 3, 9E +05 4, 3E +05 4, 8E +05 5, 2E +05 5, 6E +05 6, 0E +05 6, 5E +05 6, 9E +05
Time since beginning of simulation - 28 April (s)
Rainfall inten sity (mm/h) 0 50 100 150 200 250 Cumulative rainfal l (mm) Hourly intensity Cumulative rainfall Landslide at Quindici Landslide at Sarno 28 29 30 1 2 3 4 5
Fig. 14. Cumulative rainfall and rain-fall intensity introduced in the numeri-cal models. Data correspond to values measured at the Lauro rain gauge from 28 April to 5 May 1998. Dots along the cumulative rainfall line show the time of occurrence for observed slope fail-ures.
tivity of the lower pumice layer has been imposed greater than the upper one to account for the higher degree of al-teration and percentage of fines typical of the upper pumice layers. Dip angle of soil layers has been assumed equal to
40◦(mean value measured at landslide scars). Two sets of
analyses have been carried out: on model slopes with total length of 10 m and 50 m. The last value represents the modal value of the distance upslope of landslide scars over which pyroclastic cover can be considered continuous.
Model A represents the situation of an undisturbed pyro-clastic cover, with no morphologic or stratigraphic discon-tinuities. 26.3% of landslides are not in correspondence of
morphological discontinuities, but not all of these have been checked in the field to detect possible stratigraphic disconti-nuities. As a consequence, we can only affirm that model A accounts for a maximum of 26.3% of the settings observed at landslide source areas. The other three cases introduce natural or anthropic elements observed at most of the land-slide scars and which modify the “undisturbed” condition of model A.
Longitudinal continuity of pyroclastic cover is interrupted by a vertical cut in model B, as in presence of road cuts or rocky cliffs. This model represents the geomorphologic set-tings of half of the observed slope failures, in fact landslides
64 G. B. Crosta and P. Dal Negro: Soil slip-debris flow initiation process in pyroclastic deposits
Fig. 15. Model A, pore pressure distri-bution versus time. (a) 10 m long, di-agram for all the 5 horizons at an hor-izontal distance of 7.3 m from the ups-lope model boundary. (b) 50 m long, di-agram for the lower pumice horizon at different horizontal distances from the upslope model boundary. Shaded area represents the failure time interval as from witness reports.
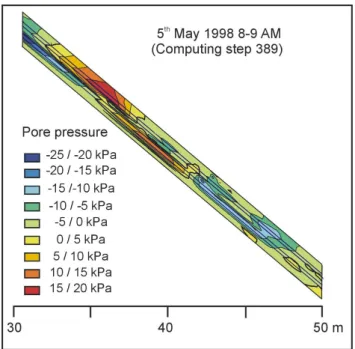
Fig. 16. Model B, 50 m long. Pore pressure contours (every 5 kPa) at 08:00–09:00 LT on 5 May (time step 389). 0 kPa contour line is marked with a thicker line.
in correspondence of road cuts are 38.5% of the total and those associated to rocky cliffs are 19.7%.
Model C is alternative to model B in representing the set-tings above rocky cliffs. All the soil horizons in this model are truncated by the topsoil. Model C accounts for 19.7% of the geomorphologic conditions observed at landslide ar-eas, which are widely distributed along the southern slopes of Pizzo d’Alvano. This geometry leads to the pinching out of pumiceous layers against an horizon with lower perme-ability able to generate a localised increase of pore pressure. A similar result is achieved in model D, where a pumice layer discontinuous in the direction of maximum slope angle is represented. Lateral discontinuity (i.e. transversal to the
maximum slope direction) of the layers was recognised dur-ing field work at 35% of the investigated sites. More difficult is to ascertain the presence of longitudinal discontinuities, which could be reasonably hypothesised in 13% of cases.
These models are not explanatory of all the settings asso-ciated to slope instabilities, but they give a general picture of the most frequently observed ones.
6.1 Input parameters
Besides defining the geometry of the models, the saturated and unsaturated hydraulic properties of the various horizons have to be defined. They include the characteristic curves and the hydraulic conductivity – suction relationships. The first group of curves has been modified according to Terri-bile et al. (2000) and are sketched in Fig. 13. Considering the similarity in geotechnical and hydrogeological behaviour of the buried soils, their characteristic curves have been as-sumed to be the same. Similarly has been done for the two pumice layers.
The hydraulic conductivity – suction curves have been reconstructed using the Green and Corey (1971) relation, which estimates them on the basis of characteristic curves and saturated hydraulic conductivity values.
6.2 Boundary conditions
On the upper face of all the four models it has been a transient flux condition, with values equal to the rainfall at Lauro from 28 April to 5 May, was applied. Daily average intensity has been imposed as from 28 April to 3 May and hourly intensity has been applied (Fig. 14) for the last two days.
A null flux condition has been imposed at the base of all the models. This condition excludes any exchange of water between pyroclastic cover and the underlying bedrock. As above mentioned, field surveys generally excluded the possi-bility of groundwater flow from the bedrock toward the soil cover at landslide scars. This is a conservative hypothesis, because the possibility of draining water from soils to the
G. B. Crosta and P. Dal Negro: Soil slip-debris flow initiation process in pyroclastic deposits 65
Fig. 17. Model C, pore pressure dis-tribution versus time for both pumice layers at the pinching out of the hori-zons. (a) 10 m long model, (b) 50 m long model. Shaded area represents the failure time interval as from witness re-ports.
underlying limestones is excluded. This is the long term pro-cess that normally feeds the deeper groundwater table.
The condition of total head equalling elevation has been imposed on the downslope vertical face of models B and C. The condition of null flux reviewed by pressure has been im-posed on the same face of models A and D, where the pyro-clastic cover is continuous.
An initial pore pressure of −3 kPa has been imposed in the pyroclastic cover. The correspondent water contents have been automatically determined on the basis of the charac-teristic curves. This condition accounts for the initial water content of the pyroclastic cover.
6.3 Results
Model A. In Fig. 15a the pore pressure is plotted versus time for the 10 m long model at an horizontal distance of 7,3 m, where the maximum pore pressures have been computed. A
slight decrease of pore pressure till t = 5, 87×105s,
corre-sponding to 17:00 on 4 May is shown. Since then a localised increase of pore pressures takes place in the upper horizons, but positive only in the first pumice layer. They are related to the passage of pore pressure pulses travelling downslope. Almost no changes in the pore pressure distribution are ob-served in the lower pumice layer.
The results for the 50 m long model shows some inter-esting differences. In the upper pumice layer positive pore
pressures pulses are recorded already after 1,72×10⁵s,
cor-responding to the end of the second rainy day (29 April). Fur-thermore, positive pore pressures in the lower pumice hori-zon are computed only for horihori-zontal distances greater than 22 m. This is shown in Fig. 15b, where pore pressure versus time, within the second pumice layer and at different hori-zontal distances, is plotted. This result put in evidence the influence of slope length and of downslope flow, parallel to permeability barriers, on the magnitude and distribution of pore pressure.
In the 50 m long model the maximum pore pressure
amounts to 21 kPa in both the pumice layers at t =
6.7×10⁵s.
Model B. The 10 m long model shows results similar to model A. In the 50 m long model the formation of positive pore pressure pulses, travelling downslope in the pumice lay-ers, is observed. Fig. 16 shows the pore pressure distribution computed at step 389, corresponding to 08:00–09:00 LT on 5 May.
Maximum pore pressure values of 32 kPa are computed in the 50 m long model. They are localised in both pumice
layers at t = 6.8×10⁵s (23:00 LT on 5 May).
Model C. In this model pumice layers are truncated by the topsoil, generating a situation that Reid et al. (1988) indicate as cause of localised increase of pore pressure. In fact, the higher pore pressures are computed where the pumice layer pinches out. Maximum pore pressures amount to 30 kPa and 250 kPa for the 10 m and 50 m long model, respectively.
They were computed at t = 6.7×10⁵s corresponding to
18:00 LT on 5 May (Figs. 17a and b). These plots show a secondary pore pressure maximum at a time corresponding to the second (for 10 m long model) and third rainy day (for 50 m long model).
Model D. In this case results similar to model C are obtained, but with lower pore pressures. Maximum pore pressure val-ues are computed where pumice layers pinch out, generating a pattern similar to that proposed for pipe flow by Pierson (1983). For the 10 m long model the maximum pore pressure of 14 kPa is reached at 08:00–09:00 LT on 5 May whereas for the 50 m long one the maximum pore pressure of 35 kPa is computed at 13:00 LT on 5 May. Figures 18a and b rep-resent pore pressure changes versus time and pore pressure distribution at time step 390 for the 50 m long model.
7 Slope stability analysis
Slope stability analyses have been conducted for each of the eight models using pore pressures determined at different time steps by numerical modelling of seepage.
The geotechnical parameters adopted for the different horizons are listed in Table 3. Data for paleosoils have been
66 G. B. Crosta and P. Dal Negro: Soil slip-debris flow initiation process in pyroclastic deposits
Table 3. Parameters adopted in slope stability analyses
Layer γsat(kN/m3) γunsat(kN/m3) Cohesion (kPa) φp(◦) φb(◦)
Top soil 15.8 12.3 15 36 15
Upper pumice 12.6 8.0 0 40 0
Upper buried soil 15.8 12.7 15 40 15
Lower pumice 12.6 8.0 0 40 0
Lower buried soil 15.0 11.5 10 37 15
Fig. 18. Model D, 50 m length. (a) Pore pressure distribution versus time com-puted at the pinching out of the pumice layer. Shaded area represents the fail-ure time interval as from witness re-ports. (b) Pore pressure contours (every 10 kPa) at 13:00 LT on 5 May (time step 390). 0 kPa contour line is marked with a thicker line. It is evident pore pres-sure accumulation at the stratigraphical discontinuity.
determined by laboratory analyses and those for pumice have been inferred by bibliography (Fig. 8). Unsaturated shear
strength has been considered in the analyses. The angle (φb)
defining the increase in shear strength with respect to matric
suction for soils is assumed equal to 15◦.
Safety Factor (SF ) for models A is greater than 1 for all calculated pore pressure conditions. In particular, the SF for the 10 m long model is equal to 2.14 for all computed pore pressures. This implies that seepage does not affect slope stability. In the 50 m long model the minimum safety factor (1.57) is obtained for the time step associated to the
maxi-mum computed pore pressure (t = 6.7×10⁵s or 18:00 LT, 5
May).
Similar results have been obtained for the 10 m long model B, but important differences appear in the longer model. In this case SF = 0.8 is obtained for pore pressures computed at a time correspondent to the morning on 5 May. The fail-ure surfaces are located at the base of the upper pumice layer (Fig. 19). It is worth noting that there is a quite good agree-ment with the actual position of failure surface and time of failure.
Major differences are present in model C with respect to the other models. In this model the occurrence of failure is observed also for the shorter slope. The safety factor is less
than unity at t = 6.7×10⁵s (18:00 LT of 5 May) for a failure
surface passing at the base of the lower pumice layer. The
longer model shows a SF < 1 few hours after the beginning of the simulated rain. These results imply that condition rep-resented in the 50 m long model is unrealistic, because of the little amount of rain needed to generate instability. The triggering of landslides just uphill of the rocky cliffs is best represented by model B.
More realistic are the results obtained for model D. The shorter model does not lead to instability (SF = 2.2) for all pore pressure conditions. The 50 m long model shows a good correlation with the reality concerning time and position of failure. In fact, a failure surface located at the base of one of
the two pumice layer is obtained at t = 6.5×10⁵s (13:00 LT
on 5 May). The failures develop at the bottom of the upper pumice layer.
8 Discussion and conclusions
Modelling of seepage processes gives an important insight about the influence and the distribution of groundwater on slope failures in pyroclastic cover.
The concentration of water in more permeable horizons (pumice) and where permeability contrasts occur is observed. In particular numerical modelling does not show, for the measured rainfall, the formation of a continuous perched wa-ter table, but of pulses of pore pressure moving downslope in more permeable layers.
G. B. Crosta and P. Dal Negro: Soil slip-debris flow initiation process in pyroclastic deposits 67 SF<1 T= 13 PM of 5 May SF>1 SF=0.8 T= 18 PM of 5 May 0 2 4 6 metres SF>1 SF=0.8 T= h 8-9 of 5 May Model A 0 5 10 15 metres SF>1 SF=0.8 T= 28 April SF>1 Model B Model C Model D 10 m models 50 m models
Fig. 19. Synthesis of the results ob-tained by slope stability analyses. The four different types of idealized slope models are shown for two different model lengths (10 and 50 m). Safety factors, SF , greater and lower than 1 are shown together with the instant,
T, for which unstable slope conditions
were reached. Geometry of the most critical failure surface is shown when
SF <1.
It is interesting to note that a certain slope length (greater than 15 m) is needed to obtain pore pressure pulses also in the lower pumice layer where many slope failures have been observed. This suggests that beyond vertical infiltration also longitudinal groundwater convergence, from upslope sectors, is relevant in pore pressure distribution, as reported by John-son and Sitar (1990). This effect is magnified in hollows, where lateral concentration of runoff and subsurface flow oc-curs (Montgomery and Dietrich, 1994).
The role of stratigraphic discontinuities in generating high pore pressures in layered pyroclastic materials has been demonstrated by the modelling. This is in agreement with re-sults of studies concerning the hydrologic conditions which triggered shallow landslides (Reid et al., 1988; Johnson and Sitar, 1990). These conditions can result from the primary spatial variability in the stratigraphic settings of pyroclastic deposits or their erosion and subsequent replacement by pe-dogenised colluvial material, especially close to subvertical cliffs.
Stability analyses point out that conditions represented by models B, C and D of length 50 m and model C of length
10 m are unstable. Slide surfaces are always located within the pyroclastic cover and in particular at the base of a pumice layer and almost never at the bedrock contact. Landsliding occurs, almost in all the cases, with pore pressure distribu-tions computed for the afternoon on 5 May. These results are in agreement with field observations and witness reports for the 1998 Sarno event. The most unstable conditions are those characterised by morphological or stratigraphical in-terruptions along the slopes (eg. road cuts, subvertical cliffs, etc.).
It is interesting to compare models A and B characterised by identical stratigraphical settings longitudinally continuous and, respectively, discontinuous. Morphological discontinu-ities clearly influence stability and in fact model A is stable, whereas model B is not. This is the case of lack of lateral support along road cuts or above rocky cliffs. In addition, the low unit weight allows the piling up of pumice layers and related soils in areas with high terrain gradient. As a con-sequence of prolonged rainfall the high retention capacity of these horizons allows a considerable increase of the soil unit weight and consequently of the driving shear stress.
Further-68 G. B. Crosta and P. Dal Negro: Soil slip-debris flow initiation process in pyroclastic deposits more, the collapsing of pumice layers under the action of
their own weight has been observed at some scar sites. The removal of little amounts of material at the toe of the layer determined the failing of the upslope pumice. This
circum-stance happened already at slopes of 37◦.
However, the performed analyses have some limitations. They do not take into account the influence of hollows in collecting runoff and subsurface flow. Their importance is evidenced by morphological localisation of scars (Fig. 5). 2-D modelling can represent only those landslides where there is minor upslope lateral contribution of throughflow. Nev-ertheless, the length of the modelled slope sector could be a proxy for a situation characterised by 3-D flow. Further-more, a simplified stratigraphy has been considered and only nine rainy days have been simulated. Notwithstanding all these simplifications it must be underlined the relative impor-tance of results. The analyses point out which are the most unstable settings and consequently which are the most haz-ardous ones. Furthermore, the analyses exclude the need for a groundwater flow contribution from the underlying bedrock to trigger landslides within the pyroclastic cover.
Acknowledgements. The authors are very grateful to F. M.
Guadagno and to S. Magaldi for the support given during the ini-tial phase of the study. The study has been parini-tially funded by ASI and MURST. P. Dal Negro benefited of a INRM grant. D. Calcaterra and M. C. Larsen provided useful criticism of earlier version of the manuscript.
References
Aleotti, P., Polloni, G., Canuti, P., and Iotti, A.: Debris flow hazard and risk assessment using airborne laser terrain mapping tech-niques (ALTM), In: Landslides in research, theory and practice, (Eds) Bromhead, E., Dixon, N., and Ibsen, M.-L., Proc. 8th Int. Symp. on Landslides, Cardiff, UK, 19–26, 2000.
Brancaccio L., Cinque A., Russo F., and Sgambati D.: Le frane del 5–6 maggio 1998 sul gruppo montuoso Pizzo d’Alvano (Cam-pania): osservazioni geomorfologiche sulla loro distribuzione e sulla dinamica delle connesse colate, Quaderni di Geologia Ap-plicata, 7(1), 5–36 (in Italian), 2000.
Calcaterra D., Parise, M., Palma, B., and Pelella, L.: Multiple debris flows in volcaniclastic materials mantling carbonate slopes, Proc. 2nd Int. Conf. On Debris flow Hazards Mitigation, Taipei, 99– 107, 2000a.
Calcaterra, D., Parise, M., Palma, B., and Pelella, L.: The influence of meteoric events in triggering shallow landslides in pyroclastic deposits of Campania, Italy, In: Landslides in research, theory and practice, (Eds) Bromhead, E., Dixon, N., and Ibsen, M.-L., Proc. 8th Int. Symp. on Landslides, Cardiff, UK, 209–214, 2000b.
Campbell, R. H.: Soil slips, debris flows, and rainstorms in
the Santa Monica Mountains and vicinity, southern California. U.S.G.S., Prof. Paper 851, 1975.
Cardinali, M., Cipolla, F., Guzzetti, F., Lolli, P., Pagliacci, S., Re-ichenbach, P., Sebastiani, C., and Tonelli, G.: Catalogo delle informazioni sulle localit`a italiane colpite da frane e da inon-dazioni, Pubblication n. 1799. CNR GNDCI, Perugia, two vol-umes (in Italian), 1998.
Celico, P., Guadagno, F. M., and Vallario, A.: Proposta di un mod-ello interpretativo per lo studio delle frane nei terreni piroclastici, Geologia Applicata e Idrogeologia, 21, 173–193, 1986. Celico, P. and Guadagno, F. M.: L’instabilit`a delle coltri
piroclas-tiche delle dorsali carbonapiroclas-tiche in Campania: attuali conoscenze, Quaderni di Geologia Applicata, Pitagora editrice, 5, 75–133 (in Italian), 1998.
Celico, P., Esposito, L., Piscopo, V., and Aquino, S.: Problem-atiche idrogeologiche connesse con i fenomeni di instabilit`a delle coltri piroclastiche della dorsale del Pizzo d’Alvano (Campania), Quaderni di geologia applicata, Pitagora editrice, 7(2), 167–187 (in Italian), 2000.
Ceriani, M., Lauzi, S., and Padovan, N.: Rainfalls and landslides in the alpine area of Lombardia region, central Alps, Italy, Proc. of Interpraevent 1992, Bern, Switzerland, band 2, 9–20, 1992. Costa, J. E.: Physical geomorphology of debris flows. In:
Devel-opments and applications of geomorphology, (Eds) Costa, J. E. and Fleisher, P. J., Springer-Verlag, Berlin, Heidelberg, 268–317, 1984.
Crosta, G. and Frattini, P.: Rainfall thresholds for triggering soil slips and debris flow, Proc. 2nd Plinius Int. Conf. on Mediter-ranean Storms, Siena, Italy, in press, 2002.
Cruden, D. M. and Varnes, D. J.: Landslides types and processes. In: Landslides: investigation and mitigation, (Eds) Turner, A. K. and Schuster, R. L.Transp. Res. Board Spec. Rep. 247, 36–75, 1996.
Dal Negro P.: Tesi di Laurea, Univ. Studi di Milano, 2000. De Falco, M., De Riso, R., and Ducci, D.: La piovosit`a della
Penisola Sorrentina e dei Monti Lattari in relazione all’evento del gennaio 1997, Proc. 9th Nat. Congr. of Geologist, Rome, 321–329, 1997.
De Gennaro M., Langella A., Colella A., and Buonodonno A.: Caratterizzazione mineralogica delle vulcanoclastiti del Pizzo d’Alvano, Quaderni di Geologia Applicata, 7(1), 49–58 (in Ital-ian), 2000.
Del Prete, M., Guadagno, F. M., and Hawkins, A. B.: Preliminary report of the landslides of 5 May 1998, Campania, southern Italy, Bull. Eng. Geol. Env., 57, 113–129, 1998.
De Vita, P.: Fenomeni di instabilit`a delle coperture piroclastiche dei Monti Lattari, di Sarno e di Salerno (Campania) ed analisi degli eventi pluviometrici determinanti, Quaderni di Geologia Appli-cata, 7(2), 213–239 (in Italian), 2000.
Esposito, L. and Guadagno, F. M.: Some special geotechnical prop-erties of pumice deposits, Bull. Eng. Geol. Env., 57(1), 41–50, 1998.
Fairchild, L. H.: The importance of lahar initiation processes, In: Debris flows/ avalanches: process, recognition and mitigation, (Eds) Costa, J. and Wieczorek, G. F., Geol. Soc. Am., Reviews in Engin. Geol., 7, 51–61, 1987.
GeoSlope: International Ltd., Calgary, Alberta, Canada, SEEP/W manual, 1998.
Green, R. E., and Corey, J. C.: Calculation of hydraulic conductiv-ity: a further evaluation of some predictive methods, Soil Science Society of America Proc., 35, 3–8, 1971.
Guadagno, F. M.: Debris flows in the Campanian volcaniclastic soils (Southern Italy), In: Proc. Int. Conf. on Slope stability en-gineering: developments and applications, (Ed) Chandler, R. J., Isle of Wight, UK, 109–114, 1991.
Guadagno, F. M. and Magaldi, S.: Considerazioni sulle propriet`a geotecniche dei suoli allofanici di copertura delle dorsali carbon-atiche campane, Quaderni di Geologia Applicata, Pitagora ed-itrice, 7(2), 143–155 (in Italian), 2000.
G. B. Crosta and P. Dal Negro: Soil slip-debris flow initiation process in pyroclastic deposits 69
Guadagno, F. M. and Perriello Zampelli, S.: Triggering mecha-nism of the landslides that inundated Sarno, Quindici, Siano, and Bracigliano (S. Italy) on 5–6 May 1998, In: Landslides in re-search, theory and practice, (Eds) Bromhead E., Dixon N., and Ibsen M.-L., Proc. 8th Int. Symp. on Landslides, Cardiff, UK, 671–676, 2000.
Guadagno, F. M., Celico, P. B., Esposito, L., Perriello Zampelli, S., Piscopo, V., and Scarascia Mugnozza, G.: The debris flows of 5–6 May 1998 in Campania, southern Italy, Landslide news, 12, 5–7, 1999.
Guzzetti, F.: Landslide fatalities and the evaluation of landslide risk in Italy, Eng. Geol., 58, 89–107, 2000.
Hutchinson, J. N.: General report: Morphological and geotechnical parameters of landslides in relation to geology and hydrogeology, Proc. 5th Int. Symp. on landslides, Lausanne, 3–35, 1988. Johnson, A. M. and Rodine, J. R.: Debris flow, In: Slope instability,
(Eds) Brunsden, D. and Prior, D. B., 257–361, 1984.
Johnson, K. A. and Sitar, N.: Hydrologic conditions leading to de-bris flow initiation, Can. Geotech. J., 27, 789–801, 1990. Kitamura, R., Haruyama, M., Jitousono, T., and Nakamura, J.:
Slope stability in volcanic soil based on its mechanical and physico-chemical characteristics, In: Landslides, (Ed) Bonnard, C., Proc 5th Int. Symp. on Landslides, Lausanne, 199–203, 1988. Lazzari, A.: Aspetti geologici dell’evento di Salerno in seguito alle piogge del 25–26 ottobre 1954, Boll. Soc. Natur. in Napoli, 63, 131–142 (in Italian), 1954.
Maeda, T., Takenaka, H., and Warkentin, B. P.: Physical properties of allophane soils, Advances Agronomy, 29, 229–264, 1977. Montgomery, D. R. and Dietrich, W. E.: A physically based model
for the orographic control on shallow landsliding, Water Re-source. Res., 30, 1153–1171, 1994.
Mothes, P. A., Hall, M. L., and Janda, R. J.: The enormous Chillos Valley Lahar: an ash flow generated debris flow from Cotopaxi volcano, Ecuador, Bulletin of Volcanology, 59, 233–244, 1998. Onorati, G., Braca, G., and Iiritano, G.: Evento idrogeologico del 4,
5 e 6 Maggio 1998 in Campania. Monitoraggio ed analisi idro-logica. Atti dei convegni dei Lincei 154: Il rischio idrogeologico e la difesa del suolo. Roma 1–2 Ottobre 1998, 103–108 (in Ital-ian), 1999.
Pareschi, M. T., Favalli, M., Giannini, F., Sulpizio, R., Zanchetta, G., and Santacroce, R.: 5 May 1998 debris flows in circum-Vesuvian areas (southern Italy): insights for hazard assessment, Geology, 28 (7), 639–642, 2000.
Perov, V. F., Artyukhova, I. S., Budarina, O. I., Glazovskaya, T. G., and Sidorova, T. L.: Map of the world mudflow phenomena, In: Debris flow hazards mitigation: Mechanics, Prediction and As-sessment, (Ed) Chen, C. I., ASCE, Proc. 1st Int. Conf., San Fran-cisco, California, 322–331, 1997.
Pierson, T. C.: Soil pipes and slope stability, Q. J. Engin. Geol., 16, 1–11, 1983.
Pierson, T. C. and Costa, J. E.: A rheologic classification of sub-aerial sediment-water flows, In: Debris flows/ avalanches: pro-cess, recognition and mitigation, (Eds) Costa, J. and Wieczorek, G. F., Geol. Soc. Am., Reviews in Engin. Geol., 7, 1–12, 1987. Pierson, T. C., Janda, R. J., Thoruet, J. C., and Borrero, C. A.:
Per-turbation and melting of snow and ice by the 13 November 1985 eruption of Nevado del Ruiz, Colombia, and consequent mobi-lization, flow, and deposition of lahars, J. Volc. and Geotherm. Res., 41, 17–66, 1990.
Reid, M. E., Nielsen, H. P., and Dreiss, S. J.: Hydrologic factors triggering a shallow hillslope failure, Bull. Ass. of Eng. Geol., 25 (3), 394–361,1988.
Rodolfo, K. S. and Arguden, A. T.: Rain lahar generation and sed-iment delivery systems at Mayon volcano, Philippine. Sedimen-tation in volcanic settings: SEPM Special Pubblication, 45, 71– 87, 1991. Rolandi, G., Barrella, A. M., and Borrelli, A.: The 1631 eruption of Vesuvius, J. Volc. and Geoth. Res., 58, 183– 201, 1993.
Rolandi, G., Bertollini, F., Cozzolino, G., Esposito, N., and San-nino, D.: Sull’origine delle coltri piroclastiche presenti sul versante occidentale del Pizzo d’Alvano (Sarno – Campania), Quaderni di Geologia Applicata, 7 (1), 37–48 (in Italian), 2000. Scotto di Santolo, A., Nicotera, M. V., and Ramondini, M.:
Analy-sis of instability phenomena affecting a cut slope in unsaturated pyroclastic soils, In: Landslides in research, theory and prac-tice, (Eds) Bromhead, E., Dixon, N., Ibsen, M.-L., Proc. 8th Int. Symp. on Landslides, Cardiff, UK, 1353–1360, 2000.
Smith, G. A. and Lowe, D. R.: Lahars: Volcano-hydrologic events and deposition in the debris flow-hyperconcentrated flow contin-uum, Sedimentation in volcanic settings: SEPM Special Pubbli-cation, 45, 59–70, 1991.
Skempton, A. W., and DeLory, F. A.: Stability of natural slopes in London Clay, Proc. 4th Int. Conf. Soil Mech. Found. Eng., London, 2, 378–381, 1957.
Suwa, H. and Yamakoshi, T.: Eruption, debris flow and hydrogeo-morphic condition at mount Unzen, In: Debris flow hazards miti-gation: Mechanics, Prediction and Assessment, (Ed) Chen, C. I., ASCE, Proc. 1st Int. Conf., San Francisco, California, 289–298, 1997.
Terlien, M. T. J.: Modelling spatial and temporal variations in rainfall-triggered landslides, Inter. Inst. Aerospace Surv. and Earth Sciences (ITC), Enschede, The Netherlands, 32, 253, 1996. Terribile, F., Basile, A., De Mascellis, R., Di Gennaro, A., and Vingiani S.: I suoli delle aree di crisi di Quindici e Sarno: pro-priet e comportamenti in relazione ai fenomeni franosi del 1998, Quaderni di Geologia Applicata, Pitagora editrice, 7(1), 60–79 (in Italian), 2000.
USDA: Keys to Soil Taxonomy. USDA-Nat, Res. Cons. Service, 8th ed., 328, 1998.
Vallance, J. W. and Scott, K. M.: The Osceola mudflow from Mount Rainier: sedimentology and hazard implications of a huge clay-rich debris flow, Geol. Soc. Amer. Bull., 109 (2), 143–163, 1997. Ziemer, R. R.: Storm flow response to road building and partial cutting in small streams of northern California, Water Resour. Res, 17 (4), 907–917, 1981.
Zimmermann, M. and Rickenmann, D.: Erosion and sedimentation in mount Pinatubo rivers, Philippines, In: Debris flow hazards mitigation: Mechanics, Prediction and Assessment, (Ed) Chen, C. I., ASCE, Proc. 1st Int. Conf., San Francisco, California, 405– 414, 1997.