HAL Id: hal-01357981
https://hal.sorbonne-universite.fr/hal-01357981
Submitted on 30 Aug 2016
HAL is a multi-disciplinary open access
archive for the deposit and dissemination of
sci-entific research documents, whether they are
pub-lished or not. The documents may come from
teaching and research institutions in France or
abroad, or from public or private research centers.
L’archive ouverte pluridisciplinaire HAL, est
destinée au dépôt et à la diffusion de documents
scientifiques de niveau recherche, publiés ou non,
émanant des établissements d’enseignement et de
recherche français ou étrangers, des laboratoires
publics ou privés.
Distributed under a Creative Commons Attribution| 4.0 International License
Robert T. Maughan, Eoin R. Feeney, Emilie Capel, Jacqueline Capeau, Pere
Domingo, Marta Giralt, Joep M. A. Lange, Praphan Phanuphak, David A.
Cooper, Peter Reiss, et al.
To cite this version:
Robert T. Maughan, Eoin R. Feeney, Emilie Capel, Jacqueline Capeau, Pere Domingo, et al..
Im-proved adipose tissue function with initiation of protease inhibitor-only ART. Journal of Antimicrobial
Chemotherapy, Oxford University Press (OUP), 2016, �10.1093/jac/dkw301�. �hal-01357981�
Improved adipose tissue function with initiation of protease
inhibitor-only ART
Robert T. Maughan
1*, Eoin R. Feeney
1, Emilie Capel
2, Jacqueline Capeau
2, Pere Domingo
3, Marta Giralt
4,5,
Joep M. A. Lange
6,7†, Praphan Phanuphak
7,8, David A. Cooper
9, Peter Reiss
6,7and Patrick W. G. Mallon
1on behalf
of the HIVNAT-019 Study Group‡
1
HIV Molecular Research Group, School of Medicine, University College Dublin, Dublin, Ireland;
2Sorbonne Universities, UPMC Univ Paris 06,
INSERM UMRS 938, Paris, France;
3Infectious Diseases Unit, Hospital de la Santa Creu/Sant Pau, Barcelona, Spain;
4Department of
Biochemistry and Molecular Biology, University of Barcelona, Barcelona, Spain;
5CIBER Fisiopatologia de la Obesidad y Nutricio´n, Barcelona,
Spain;
6Academic Medical Center, Department of Global Health and Division of Infectious Diseases, and Amsterdam Institute for Global
Health and Development, Amsterdam, The Netherlands;
7The HIV-Netherlands Australia Thailand Research Collaboration (HIV-NAT) - Thai
Red Cross Aids Research Center (TRCARC), Bangkok, Thailand;
8Department of Medicine, Chulalongkorn University, Bangkok, Thailand;
9
Kirby Institute, University of New South Wales, Sydney, Australia
*Corresponding author. Tel:+353-1-716-4584; Fax: +353-1-716-4539; E-mail: [email protected] †Deceased 17 July 2014.
‡Additional members of the HIVNAT-019 Study Group are listed in the Acknowledgements section.
Received 22 April 2016; accepted 27 June 2016
Objectives: Use of ART containing HIV PIs has previously been associated with toxicity in subcutaneous adipose
tissue (SAT), potentially contributing to the development of lipodystrophy and insulin resistance. However, the
effect of PIs on SAT function in ART-naive patients independent of other ART classes is unknown. This study
aimed to elucidate the effect of initiating PI-only ART on SAT function in ART-naive subjects.
Methods: In the HIVNAT-019 study, 48 HIV-infected, ART-naive Thai adults commencing PI-only ART comprising
lopinavir/ritonavir/saquinavir for 24 weeks underwent assessments of fasting metabolic parameters and body
com-position. In a molecular substudy, 20 subjects underwent SAT biopsies at weeks 0, 2 and 24 for transcriptional,
pro-tein, mitochondrial DNA (mtDNA) and histological analyses. ClinicalTrials.gov registration number: NCT00400738.
Results: Over 24 weeks, limb fat increased (
+416.4 g, P¼0.023), coinciding with larger adipocytes as indicated by
decreased adipocyte density in biopsies (232.3 cells/mm
2, P¼0.047) and increased mRNA expression of
adipogen-esis regulator PPARG at week 2 (
+58.1%, P¼0.003). Increases in mtDNA over 24 weeks (+600 copies/cell, P¼0.041),
decreased NRF1 mRNA expression at week 2 (233.7%, P,0.001) and increased COX2/COX4 protein ratio at week 24
(
+288%, P¼0.038) indicated improved mitochondrial function. Despite decreased AKT2 mRNA at week 2 (228.6%,
P¼0.002) and increased PTPN1 mRNA at week 24 (+50.3%, P¼0.016) suggesting insulin resistance, clinical insulin
sensitivity [by homeostasis model assessment (HOMA-IR)] was unchanged.
Conclusions: Initiation of PI-only ARTshowed little evidence of SAT toxicity, the changes observed being consistent
with a return to health rather than contributing to lipodystrophy.
Introduction
Metabolic comorbidities including lipodystrophy, insulin resistance
and dyslipidaemia are prevalent amongst people living with HIV
(PLWH),
1and not only affect adherence to therapy but also
con-tribute to cardiovascular disease risk, a leading cause of death in
treated PLWH.
2These conditions are in part caused by
subcutane-ous adipose tissue (SAT) toxicity due to HIV infection and exposure
to certain classes of ART.
Although toxicity in SAT has been demonstrated in untreated
HIV infection,
3,4the development of clinical lipodystrophy
(per-ipheral lipoatrophy, central lipohypertrophy, dyslipidaemia and
insulin resistance) is associated with ART exposure,
5and once
established is not fully reversible.
6Lipodystrophy was first
attrib-uted to HIV PIs;
7however, subsequent studies demonstrated
that treatment with thymidine analogue NRTIs (tNRTIs) is the
main factor,
8primarily via initiation of SAT mitochondrial
tox-icity.
9Due to the routine use of PIs in combination with NRTIs,
#The Author 2016. Published by Oxford University Press on behalf of the British Society for Antimicrobial Chemotherapy.
This is an Open Access article distributed under the terms of the Creative Commons Attribution License (http://creativecommons.org/licenses/by/ 4.0/), which permits unrestricted reuse, distribution, and reproduction in any medium, provided the original work is properly cited.
J Antimicrob Chemother
doi:10.1093/jac/dkw301
Journal of Antimicrobial Chemotherapy Advance Access published August 11, 2016
at UPMC on August 30, 2016
http://jac.oxfordjournals.org/
their relative contribution to ART-mediated SAT toxicity remains
unclear.
In vitro, PIs inhibit adipogenesis,
10,11alter lipid metabolism,
12impair glucose uptake insulin signalling,
13,14induce mitochondrial
dysfunction
11and alter secretion of adipocyte-derived hormones
and inflammatory cytokines.
12,15In clinical studies, PLWH
receiv-ing PI-containreceiv-ing ART had reduced expression of key genes
required for the regulation of lipid metabolism, insulin sensitivity
and adipogenesis in SAT.
16–18However, the concurrent use of
tNRTIs, as well as the established lipodystrophy, in many of the
subjects makes it difficult to determine the specific effects of
PIs in these studies.
As no study to date has explored the effects of PI therapy in the
absence of other ART classes on SAT function, we aimed to
eluci-date the effect of initiating PI-only ART through a comprehensive
prospective analysis measuring clinical metabolic parameters in
parallel with histological and molecular assessments of
adipo-genic, lipid metabolism, insulin signalling and mitochondrial
func-tion pathways in the SAT of ART-naive subjects.
Methods
Ethics
The study was approved by the Ethics Committee of the Faculty of Medicine, Chulalongkorn Hospital (approval number 235/2004), written informed consent was obtained for all patients prior to their inclusion and all study procedures were in accordance with standard ethical guide-lines.19ClinicalTrials.gov registration number: NCT00400738.
Study design
A molecular substudy was performed within the HIVNAT-019 trial, an open-label, randomized trial examining the virological efficacy and pharmacodynamics of four different dosing schedules of PI-only ART con-taining lopinavir boosted with ritonavir co-administered with saquinavir in ART-naive, HIV-1-infected subjects over 24 weeks. Dosing schedules com-prised 400/100 mg of lopinavir/ritonavir with 1000 mg of saquinavir twice daily; 400/100 mg of lopinavir/ritonavir with 400 mg of saquinavir twice daily; 266/66 mg of lopinavir/ritonavir with 1000 mg of saquinavir twice daily; and 266/66 mg of lopinavir/ritonavir with 400 mg of saquina-vir twice daily. Eligible adult (.18 years), HIV-1 antibody-positive and ART-naive subjects were recruited from the Thai Red Cross Society’s Anonymous Clinic and the HIV Outpatient Immune Clinic of King Chulalongkorn Memorial Hospital in Bangkok, Thailand. Relevant inclusion/ exclusion criteria and main clinical outcomes were described previously.20
Body composition and fasting blood parameters
Limb and trunk fat were quantified by DXA (Discovery W, Hologic) at weeks 0, 12 and 24. Abdominal subcutaneous and visceral adipose tissue areas at the fourth lumbar vertebra along with SATat the right mid-thigh were quan-tified using single-slice CT (Aquilion ONE, Toshiba), described previously.21
Fasting bloods (overnight) were drawn for total, LDL and HDL cholesterol, triglycerides, insulin and glucose at weeks 0, 12 and 24. Insulin resistance was estimated using the homeostasis model assessment (HOMA-IR).22
SAT biopsies
Molecular substudy subjects underwent biopsies of abdominal flank SAT as described previously at weeks 0, 2 and 24.23Biopsied tissue was
immedi-ately aliquoted and snap frozen in liquid nitrogen for DNA, RNA and protein extraction, and a tissue sample was formalin fixed for histology.
DNA and RNA extraction from adipose tissue
DNA was extracted from SAT using the QIAamp DNA Mini Kit (Qiagen) and RNA was extracted from homogenized SAT using TRIreagent (Ambion) according to the manufacturer’s instructions. The resulting RNA was treated with RQ1 DNase (Promega) and purified using the RNeasy Mini Kit (Qiagen).
Gene expression
Expression of 55 chosen mRNA targets was determined using a quantita-tive PCR (qPCR) array (RealTime Ready, Roche), with array details outlined in Table S1 and Table S2 (available as Supplementary data at JAC Online). In brief, cDNA libraries were prepared using the Transcriptor First Strand cDNA Synthesis Kit (Roche) and sample quality was verified by qPCR meas-urement of reference gene actin b (ACTB). cDNA libraries underwent a lin-ear 12-cycle pre-amplification using the RealTime Ready cDNA Pre-Amp System (Roche) and then assayed in duplicate with the appropriate con-trols on the LightCycler 480 (Roche). Gene expression was normalized to the average of reference genes ACTB, ribosomal protein L13a (RPL13A) and TATA box binding protein (TBP).
Mitochondrial DNA (mtDNA) content
Adipose tissue mtDNA copy number per cell was quantified as described previously.24In brief, DNA samples were quantified against a standard curve of known copy number by qPCR (LightCycler 480, Roche) with primers targeting mitochondrially encoded cytochrome b (MT-CYB; region 1) and mitochondrially encoded cytochrome c oxidase I (MT-CO1; region 2). mtDNA levels were compared with nuclear genome DNA copy number with primers targeting peroxisome proliferator-activated receptor g(PPARG) and mtDNA copies/cell was calculated as copy number of mtDNA/(copy number of nuclear DNA/2).
Protein expression
SAT samples were homogenized in extraction buffer [10 mM HEPES, pH 7.5/5 mM EDTA/5 mM dithiothreitol/5 mM MgCl2/PI (Complete Mini,
Roche)]. Protein was analysed by immunoblot as previously described,25
using antibodies against cytochrome c oxidase subunit 2 and 4 (COX2 and COX4) (A-6404 and A-21347, Invitrogen); PPARG and sterol regulatory element binding transcription factor 1 (SREBP1) (Sc-1984X and Sc-367X, respectively, Santa Cruz Biotechnology); and b2-microglobulin (B2M) (P0163, Dako Cytomation). Chemiluminescence was developed using horseradish peroxidase-conjugated secondary antibodies (170-6510, Bio-Rad and 711-135-152, Jackson Immunoresearch) and Immobilon ECL Plus kit (Millipore). ODs were quantified using the Multigauge 3.0 soft-ware suite (Fujifilm) and normalized to total protein content.
Adipose tissue adipocyte density
Paraffin-embedded SAT was cut into 3 mm sections and stained with haematoxylin phloxine saffron by standard protocols.16The number of
adipocytes per field (×10 magnification) was quantified using Mercator software (Explora Nova) with adipocyte density expressed as the number of adipocytes/mm2.
Statistical analysis
Subjects with more than one biopsy available were included in molecular analyses. Changes in gene and protein expression were compared using Wilcoxon signed rank tests. Parameters expected to have continuous lon-gitudinal change (mtDNA, adipocyte density and clinical parameters) were analysed using longitudinal marginal models with appropriate covariance structures selected using Akaike’s information criterion (AIC). Data are
at UPMC on August 30, 2016
http://jac.oxfordjournals.org/
reported as mean (SEM) for marginal model analyses or as median (IQR) otherwise. P values ,0.05 were considered significant. Gene expression analyses were adjusted for multiple comparisons using the Benjamini – Hochberg procedure.26As the HIVNAT-019 molecular substudy was
exploratory, there were no data to guide sample size. However, previous studies demonstrate significant longitudinal reductions in mtDNA and changes in SAT mRNA levels with ART exposure in sample sizes of 20.23,24Statistical analyses were performed using SAS version 9.3 (SAS
Institute Inc.) and SPSS statistics V20 (IBM).
Results
Between October 2004 and March 2006, 20 of 48 subjects
rando-mized to the main study participated in the molecular substudy.
Baseline characteristics of substudy subjects were broadly
com-parable to those of the main study (Table
1
), with both genders
represented and average baseline CD4+ counts suggesting
advanced immunosuppression (14 of 20 subjects in the molecular
substudy had a CD4
+ T cell count ,200 cells/mm
3).
Of the substudy subjects, one was lost to follow-up (week 1),
two withdrew for personal reasons (weeks 13 and 21) and one
required ART intensification with the addition of NRTI. In the
main study, one hepatitis B virus-co-infected subject stopped
fol-lowing a hepatic grade 4 transaminase elevation (week 5) and
one required intensification with the addition of NRTI (week 6).
Changes in clinical metabolic parameters
Over 24 weeks, no changes were observed in BMI or trunk fat by
DXA, but limb fat increased significantly [
+416.4 (176.1) g,
P ¼ 0.023], as is expected with ART initiation (Table
2
).
5,27However, the trunk:limb fat ratio did not change, suggesting a
generalized gain in adiposity with ART initiation. Consistent with
this, both abdominal subcutaneous and visceral adipose tissue
area by CT also increased [
+9.5 (4.5) cm
2, P ¼ 0.039 and
+4.3
(2.2) cm
2, P ¼ 0.058, respectively], with no significant change in
their ratio (Table
2
). CT evaluation of thigh SAT revealed a
non-significant increase.
Fasting total, LDL and HDL cholesterol and triglycerides all
increased, with no significant change in the total cholesterol:HDL
cholesterol ratio. No changes were observed in fasting glucose,
insulin or HOMA-IR (Table
2
).
Gene expression analysis
The 55 genes examined reflected the following functions: (i) lipid
metabolism and adipogenesis; (ii) insulin signalling; (iii) markers of
inflammation and cell stress; (iv) adipocyte-secreted hormones;
and (v) mitochondrial function. The full list of genes and their
cor-responding change in expression at weeks 2 and 24 are
summar-ized in Table S1 and Table S3, respectively. Overall, biopsies from
15 subjects contributed to gene expression analyses, with 13
and 12 paired samples for week 2 and week 24 analyses,
respect-ively; 1 sample in the week 24 analysis did not pass initial quality
checks.
At week 2, expression of 13 genes changed significantly, 8 of
which remained significant after correction for multiple
compar-isons. Of these 13 genes, 6 were related to lipid metabolism
and adipogenesis, 3 to insulin signalling, 2 to mitochondrial
function and 2 to cell stress markers. At week 24, only 3 target
genes had significantly altered expression, none of which
remained significant after correction. Two of these were related
to insulin signalling and one to mitochondrial function. The
smaller number of differentially expressed genes at week 24
was due to a higher level of variance in expression levels at
this timepoint.
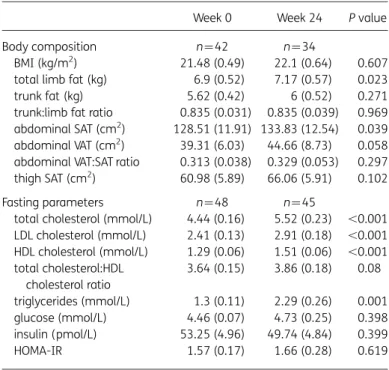
Adipogenesis and lipid metabolism genes
The initiation of PI-only ART resulted in significant increases in
expression of PPARG, the master transcriptional regulator of
adipogenesis, at week 2 [+58.1% (+23.5, +93.4), P¼0.003,
Figure
1
a], with a persistent but non-significant increase at
week 24 [
+45.4% (232.2, +88.6), P¼0.077, Figure
1
a]. This
Table 1. Baseline characteristics of study participants
HIVNAT study Molecular substudy N 48 20 Male, n (%) 20 (42) 11 (55) Asian, n (%) 48 (100) 20 (100)
Age (years), median (IQR) 36 (31.7, 43.3) 39 (30.7, 43.2) BMI (kg/m2), median (IQR) 21.5 (19.4, 24.3) 21.8 (19.5, 23.2)
CD4+ T cell count (cells/mm3
), median (IQR)
113.5 (67.8, 193.5) 119 (77.5, 217.3) HIV RNA (log10copies/mL),
median (IQR)
4.9 (4.6, 5.1) 4.8 (4.6, 5)
HIV RNA, HIV viral load.
Table 2. Changes in metabolic parameters over 24 weeks
Week 0 Week 24 P value
Body composition n¼42 n¼34
BMI (kg/m2) 21.48 (0.49) 22.1 (0.64) 0.607
total limb fat (kg) 6.9 (0.52) 7.17 (0.57) 0.023 trunk fat (kg) 5.62 (0.42) 6 (0.52) 0.271 trunk:limb fat ratio 0.835 (0.031) 0.835 (0.039) 0.969 abdominal SAT (cm2) 128.51 (11.91) 133.83 (12.54) 0.039
abdominal VAT (cm2) 39.31 (6.03) 44.66 (8.73) 0.058
abdominal VAT:SAT ratio 0.313 (0.038) 0.329 (0.053) 0.297 thigh SAT (cm2) 60.98 (5.89) 66.06 (5.91) 0.102
Fasting parameters n¼48 n¼45
total cholesterol (mmol/L) 4.44 (0.16) 5.52 (0.23) ,0.001 LDL cholesterol (mmol/L) 2.41 (0.13) 2.91 (0.18) ,0.001 HDL cholesterol (mmol/L) 1.29 (0.06) 1.51 (0.06) ,0.001 total cholesterol:HDL cholesterol ratio 3.64 (0.15) 3.86 (0.18) 0.08 triglycerides (mmol/L) 1.3 (0.11) 2.29 (0.26) 0.001 glucose (mmol/L) 4.46 (0.07) 4.73 (0.25) 0.398 insulin (pmol/L) 53.25 (4.96) 49.74 (4.84) 0.399 HOMA-IR 1.57 (0.17) 1.66 (0.28) 0.619
VAT, visceral adipose tissue. Data are presented as mean (SEM).
P values correspond to the output of the marginal model analysis.
Effect of PI-only ART initiation on adipose tissue
JAC
at UPMC on August 30, 2016
http://jac.oxfordjournals.org/
was accompanied by increases in week 2 expression (but not
week 24) of the downstream PPARG transcriptional targets
involved in lipid metabolism: fatty acid binding protein 4 (FABP4)
and lipoprotein lipase (LPL) [+58.8% (+27.3, +117.3), P,0.001
and
+36.3% (22.9, +45.8), P¼0.047, respectively, Figure
1
a].
Increases in PPARG expression and activity indicate that initiation
of PI-only ART facilitated increases in SAT lipid metabolism and
adipogenesis from diminished baseline levels in ART-naive
sub-jects despite previous associations of PIs with impaired
adipogen-esis and lipid metabolism.
11,12In addition, expression of CCAAT/
enhancer binding protein a (CEBPA) and sterol regulatory element
binding transcription factor 1 (SREBF1), major transcriptional
reg-ulators of adipogenesis implicated in ART-mediated adipose
tis-sue toxicity,
11,16did not change (Figure
1
a).
The following were also detected at week 2: (i) decreases in
hormone-sensitive lipase (LIPE) expression, a key enzyme involved
in the triglyceride hydrolysis in adipocytes; (ii) decreases in nuclear
receptor coactivator 1 (NCOA1), a transcriptional coactivator
implicated in adipose tissue energy balance;
28and (iii) increases
in a-2-glycoprotein 1, zinc-binding (AZGP1), a PPARG
transcrip-tional target
29(Table
3
).
Insulin signalling genes
In vivo, short-term exposure to certain PIs can reduce insulin
sensi-tivity.
30Supporting this, changes in gene expression suggested an
inhibition of insulin signalling in SAT with PI-only ART initiation.
Expression levels of V-akt murine thymoma viral oncogene
homologue 2 (AKT2), a key transducer of insulin signalling, and
insulin-like growth factor 2 (IGF2), which activates insulin signalling
via the insulin or IGF receptors, were both significantly reduced at
week 2 [228.6% (246.8, 28.5), P ¼ 0.002 and 239.2% (266.9,
2
25.7), P¼0.011, respectively, Figure
1
b], while expression of the
insulin receptor (INSR) decreased non-significantly [233% (236.9,
+16.7), P¼0.094, Figure
1
b]. In addition, expression of two
nega-tive regulators of insulin signalling increased: protein tyrosine
phos-phatase, non-receptor type 1 (PTPN1) at both week 2 and 24
[+30.5% (+6.5%, +43.5%), P¼0.052 and +55.6% (+22.6, +72),
P ¼ 0.024, respectively, Figure
1
b] as well as forkhead box O1
(FOXO1) at week 24 [
+29.1% (+5.7, +82.2), P¼0.028, Figure
1
b].
In contrast, expression of ras homologue family member Q
(RHOQ) involved in insulin-activated glucose uptake increased
sig-nificantly at week 2 [+42% (+27.2, +74.2), P¼0.022, Table
3
].
–100 SREBF1 CEBP A PPARG FABP4 LPL P e rcentage change f rom w eek 0 –50 0 50
*
*
*
***
*
***
***
100 150(a) Adipogenesis and lipid metabolism
–100
INSR AKT2 IGF2
PTPN1 FOXO 1 P e rcentage change f rom w eek 0 –50 0 50 100 150 (b) Insulin signalling
Positive mediators Negative regulators
Stress markers Adipocyte hormones
–100 IKBKB TP53 ADIPOQ LEP P e rcentage change f rom w eek 0 –50
***
***
0 50 100 150 (c)Markers of cell stress and adipocyte-secreted hormones –100 Week 2 Week 24 NRF1 CRTC3 PPARGC1A UCP2 P e rcentage change f rom w eek 0 –50 0 50 100 150 (d) Mitochondrial function
***
*** *
Figure 1. Gene expression changes in the adipose tissue of subjects initiating HIV PI-only ART. Changes in the expression of genes related to (a) adipogenesis and lipid metabolism, (b) insulin signalling, (c) markers of stress and adipocyte-secreted hormones and (d) mitochondrial function were measured by qPCR array. Target gene expression was normalized to the average crossing point of the reference genes: actin b (ACTB), ribosomal protein L13a (RPL13A) and TATA box binding protein (TBP). The bars represent the median (IQR) percentage change from week 0 to week 2 and to week 24; n ¼ 13 at week 2 and n ¼ 12 at week 24. Statistically significant differences from baseline are labelled *P≤0.05 and ***P≤0.005 (Wilcoxon signed rank test).
at UPMC on August 30, 2016
http://jac.oxfordjournals.org/
Genes encoding markers of cell stress and
adipocyte-secreted hormones
Elevated levels of cell stress and inflammation markers along with
decreases in adipocyte-secreted hormones are features of
ART-mediated SAT toxicity.
16–18However, in this study gene
expres-sion changes indicated a reduction in cellular stress inflammation
with initiation of PI-only ART. Expression levels of tumour protein 53
(TP53), a major stress-responsive activator of apoptosis, and IkB
kinase b (IKBKB), a key activator of inflammatory signalling, were
reduced at week 2 [215.9% (236, 24.1), P ¼0.003 and 245.5%
(268.9, 225.8), P,0.001, respectively, Figure
1
c]. The expression
of other inflammation genes, including TNF and IL6, did not change
significantly, and no changes were detected in the five target genes
encoding adipocyte-secreted hormones, including adiponectin
(ADIPOQ) and leptin (LEP) (Figure
1
c and Table S3).
Mitochondrial function genes and mtDNA
Both HIV infection itself and exposure to ART (principally tNRTIs)
are associated with altered expression of mitochondrial genes
4,18and reduced mtDNA content in SAT.
3,24In contrast, the initiation
of PI-only ART led to gene expression changes suggesting
improve-ments in mitochondrial function; nuclear respiratory factor 1
(NRF1) and CREB regulated transcription coactivator 3 (CRTC3),
both involved in mitochondrial response to cellular and oxidative
stress, were significantly reduced at week 2 [233.7% (246.9,
218.4), P,0.001 and 232.3% (238.1, 217.8), P,0.001,
respect-ively, Figure
1
d] and persisted to week 24, significantly so for CRTC3
[222% (232.4, 21.8), P ¼ 0.027, Figure
1
d]. No accompanying
changes were observed in the expression of the key regulator of
mitochondrial biogenesis PPARG coactivator 1a (PPARGC1A) or in
the mitochondrially associated uncoupling protein 2 (UCP2)
(Figure
1
d), genes dysregulated in tNRTI-mediated SAT toxicity.
31,32Analysis of the change in mtDNA content in a total of 19
sub-study subjects revealed a significant increase over 24 weeks
[
+600 (273.5) copies/cell, P¼0.042 at region 1 and +1134.1
(528.4) copies/cell, P ¼ 0.046 at region 2, Figure
2
] in keeping
with the gene expression changes identified.
Adipose tissue protein
Overall, biopsies from 16 subjects contributed to protein analyses,
although the numbers used in each protein analysis varied
depend-ing on sample abundance. No significant change was observed in
PPARG and SREBP1 protein (Figure
3
a and b), although levels tended
to increase. In keeping with gene expression and mtDNA results,
improved mitochondrial function was evidenced by decreased levels
of nuclear-encoded COX4 at week 24 [256.3% (265%, 229.6%),
P¼0.016, Figure
3
c] and by an increasing trend in mitochondrially
encoded COX2 at week 24 [
+64.1% (+21.2%, +110.9%),
P ¼ 0.203, Figure
3
d], resulting in a significant increase in the
COX2/COX4 ratio at week 24 [+288% (+42.2, +621.7), P¼0.038],
in contrast to the changes observed previously in tNRTI-mediated
SAT toxicity.
18,33Also observed were significantly reduced levels of
the inflammatory marker B2M at week 2 [248.7% (260.2%,
222.6%), P¼0.02] but not at week 24 (Figure
3
e).
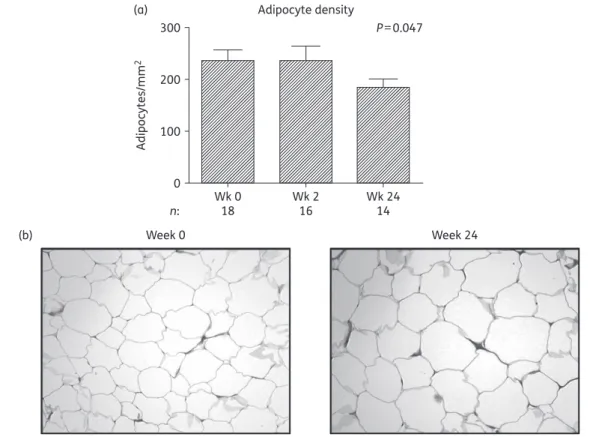
Adipocyte density
Biopsy sections from all 20 subjects contributed to adipocyte
dens-ity analysis. Histological analysis revealed normal white adipose
tis-sue structure at all timepoints. SAT adipocyte density decreased
Table 3. Overview of differentially expressed genes
Symbol Gene name Percentage change P val. Adj. P
Week 0 versus week 2
PPARG peroxisome proliferator-activated receptor g +58.1 (+23.5, +93.4) 0.003 0.026
FABP4 fatty acid binding protein 4, adipocyte +58.8 (+27.3, +117.3) ,0.001 0.009
LPL lipoprotein lipase +36.3 (22.9, +45.8) 0.048 0.194
LIPE lipase, hormone-sensitive 241 (271.5, 218.1) 0.005 0.031
AZGP1 a-2-glycoprotein 1, zinc-binding +56.3 (+29.6, +107.2) 0.017 0.084
NCOA1 nuclear receptor coactivator 1 214.3 (233.3, 27.2) 0.012 0.066
AKT2 V-akt murine thymoma viral oncogene homologue 2 228.6 (246.8, 28.5) 0.002 0.026
IGF2 insulin-like growth factor 2 (somatomedin A) 239.2 (266.9, 225.7) 0.011 0.063
RHOQ ras homologue family member Q TC10 +42 (+27.2, +74.2) 0.022 0.097
IKBKB inhibitor of k light polypeptide gene enhancer in B-cells, kinase b 245.5 (268.9, 225.8) ,0.001 0.005
TP53 P53 tumour suppressor 215.9 (236, 24.1) 0.003 0.026
NRF1 nuclear respiratory factor 1 233.7 (246.9, 218.4) ,0.001 0.005
CRTC3 CREB regulated transcription coactivator 3 232.3 (238.1, 217.8) ,0.001 0.009
Week 0 versus week 24
PTPN1 protein tyrosine phosphatase, non-receptor type 1 +55.6 (+24, +71.9) 0.024 0.509
FOXO1 forkhead box O1 222 (232.4, 21.8) 0.027 0.509
CRTC3 CREB regulated transcription coactivator 3 +29.1 (+5.7, +82.2) 0.028 0.509
P val., P values corresponding to comparisons made using Wilcoxon signed rank tests; Adj. P, adjusted P values corrected for multiple comparisons using the Benjamini–Hochberg procedure.
Data are presented as median (IQR).
Genes are ordered in functional categories corresponding to when they appear in text.
Effect of PI-only ART initiation on adipose tissue
JAC
at UPMC on August 30, 2016
http://jac.oxfordjournals.org/
significantly over 24 weeks [232.3 (15.5) cells/mm
2, P ¼ 0.047]
(Figure
4
a), implying larger adipocytes (Figure
4
b), which is in
keep-ing with the observed increases in body fat by DXA and CT.
Discussion
This is the first study (to our knowledge) to explore the in vivo
effect of PI-only ART initiation on adipose tissue composition
and function independently of other ART classes. Our findings
sug-gest improved SAT function as reflected by increases in adipocyte
size and molecular changes consistent with improvements in lipid
metabolism, mitochondrial function and inflammation with
PI-only ART initiation. Such changes indicate a return to health
associated with the suppression of HIV replication and do not
sup-port the introduction of new toxicity with PI exposure. The use of
focused transcriptional profiling, mtDNA, histological and protein
3000
mtDNA content: region 1 (MT-CYB)
P=0.042 2000 mtDNA copies/cell 1000 0 Wk 0 16 n: Wk 217 Wk 24 16 3000
mtDNA content: region 2 (MT-CO1)
P=0.046 2000 mtDNA copies/cell 1000 0 Wk 0 16 n: Wk 217 Wk 24 16
Figure 2. Changes in adipose tissue mtDNA content over 24 weeks in subjects initiating HIV PI-only ART. mtDNA was measured at two regions of the mitochondrial genome by qPCR: mitochondrially encoded cytochrome b (MT-CYB; region 1) and mitochondrially encoded cytochrome c oxidase I (MT-CO1; region 2). mtDNA levels were normalized to nuclear genome DNA copy number (primers targeting peroxisome proliferator-activated receptor g), with mtDNA copies/cell calculated as copy number of mtDNA/(copy number of nuclear DNA/2). Data are presented as mean (SEM) and P values correspond to the output of marginal model analyses. The number of samples (n) included at each timepoint is indicated under each graph. Wk, week. –100 Wk 2 13 Wk 24 12 n: 0 P e rcentage change fr om w eek 0 100 200 (a) PPARG –150 Wk 2 12 Wk 24 12 n: –100 P e rcentage change fr om w eek 0 –50 0 50 (c) COX4 P=0.016 –100 Wk 2 10 Wk 24 9 n: P e rcentage change fr om w eek 0 0 100 200 (d) COX2 P=0.203 –150 Wk 2 10 Wk 24 9 n: –100 P e rcentage change fr om w eek 0 –50 0 50 (e) B2M P=0.02 –100 Wk 2 9 Wk 24 8 n: 0 P e rcentage change fr om w eek 0 100 200 (b) SREBP1
Figure 3. Changes in the expression of proteins in the adipose tissue of subjects initiating HIV PI-only ART. Quantification was by immunoblotting with subsequent densitometric analysis. The bars represent the median (IQR) percentage change from week 0 to week 2 and to week 24. P values correspond to the Wilcoxon signed rank test. (a) PPARG, peroxisome proliferator-activated receptor g. (b) SREBP1, sterol regulatory element binding protein 1. (c) COX4, cytochrome c oxidase subunit 4. (d) COX2, mitochondrially encoded cytochrome c oxidase subunit 2. (e) B2M, b2 microglobulin. The number of samples (n) included at each timepoint is given under each graph. Wk, week.
at UPMC on August 30, 2016
http://jac.oxfordjournals.org/
analyses in parallel with the assessment of clinical metabolic
parameters and body composition allowed a detailed evaluation
of the metabolic effects of initiating PI-only ART. Using this
approach, adipose tissue toxicity indicative of the development
of lipodystrophy was not detected thus challenging the
conven-tional view that PIs cause adipose tissue toxicity.
While the role of tNRTI in the development of SAT toxicity is well
established,
9,32PIs have also historically been implicated,
7with
the primary mechanism proposed being the inhibition of PPARG,
CEBPA and SREBF1 activity resulting in impaired adipogenesis.
10,11However, in the current study, initiation of PI-only ART did not lead
to either the clinical changes suggestive of lipoatrophy or
reduc-tions in expression of these key regulators at either the mRNA or
protein level in SAT (Figure
1
a and Figure
3
a and b). In fact,
expres-sion of PPARG and its downstream targets, FABP4 and LPL,
increased (Figure
1
a), suggesting an increase from diminished
baseline levels in untreated HIV infection.
4,34Moreover, the
observed increases in adipocyte size and decreases in the
expres-sion of the triglyceride lipase LIPE are indicative of increased
adi-pocyte lipid uptake and storage, events that are consistent with
increased PPARG activity.
Although our findings contrast with previous clinical
stud-ies,
17,18subjects in these studies had previous and concomitant
exposure to tNRTI, thereby limiting the ability to determine the
relative contribution of PI to the observed toxicities. Furthermore,
our results are consistent with a recent study comparing two ART
combinations (neither of which contained tNRTI) in which SAT
adipogenic gene expression increased in subjects initiating
PI-containing ART but not with non-PI ART initiation.
35These
data, coupled with several clinical trials showing an absence of
SAT loss with use of PI-containing ART without a tNRTI,
24,36,37reinforce our view that the use of PIs is not independently
asso-ciated with SAT toxicity in vivo.
Exposure to certain PIs, including lopinavir/ritonavir, has also
been associated with insulin resistance in vitro
10,13and in healthy
volunteers.
30,38Despite the transcriptional changes observed
sug-gesting insulin resistance in this study (Figure
1
b), there was no
effect on systemic insulin sensitivity (HOMA-IR), indicating that
the transcriptional changes in SAT were insufficient to affect
whole-body insulin sensitivity. Although use of the
hyperinsuli-naemic – euglycaemic clamp may have allowed more sensitive
detection of changes in insulin sensitivity, the findings of previous
studies using this method were consistent with ours.
39,40Cross-sectional studies have previously demonstrated
increased expression of inflammation-related genes concurrent
with reduced expression of PPARG and PPARG-target genes in
the SAT of ART-naive HIV-infected subjects,
4,34presumably
reflecting the pro-inflammatory effects of uncontrolled HIV
infec-tion. In this study, we found that initiation of PI-only ART was
associated with the reverse—increased PPARG activity and
decreased expression of inflammatory markers IKBKB (mRNA)
and B2M (protein)—implying a recovery from HIV-induced effects
300 (a) (b) Adipocyte density 200 Adipocytes/mm 2 100 0 Wk 0 18 Week 0 Week 24 n: Wk 216 P=0.047 Wk 24 14
Figure 4. Histological analysis of the adipose tissue biopsies of subjects initiating HIV PI-only ART. (a) Change in adipose tissue adipocyte density over 24 weeks. The number of adipocytes per field (×10 magnification) was quantified using viewing software with adipocyte density expressed as the number of adipocytes/mm2. Data are presented as mean (SEM) and P values correspond to the output of marginal model analyses; n¼ 18, 18 and 14 at weeks 0, 2 and 24, respectively. Wk, week. (b) Representative micrographs of adipose tissue biopsy sections at week 0 and at week 24 taken at ×10 magnification, stained with haematoxylin phloxine saffron.
Effect of PI-only ART initiation on adipose tissue
JAC
at UPMC on August 30, 2016
http://jac.oxfordjournals.org/
on SAT rather than PI-mediated toxicity. Furthermore,
mitochon-drial toxicity, another key feature of both untreated HIV and
ART-mediated adipose tissue toxicity,
3,9was not observed in this
study. In fact, initiation of PI-only ART led to improvements
in markers of mitochondrial function in SAT; mtDNA and the
COX2/COX4 ratio increased while mRNA expression of the
stress-responsive regulators of mitochondrial biogenesis NRF1 and
CRTC3 decreased.
41,42These outcomes contrast considerably
with the mitochondrial dysfunction observed with tNRTI in
previ-ous studies,
24,33and further support an overall improvement in
SAT function with initiation of PI-only ART.
Taken together, our findings suggest that the initiation of PI-only
ART, independent of the confounding effects of other ART classes,
displays negligible SAT toxicity in clinical, transcriptional, protein
and histological analyses. In the context of an ever-expanding
number of PLWH and with the need to increase global access to
ART,
43the safety and efficacy of novel and cheaper ART regimens
including PI monotherapy are being increasingly explored.
44Within
this clinical setting, our results are particularly relevant and
reassur-ing considerreassur-ing the lack of significant PI-mediated SAT toxicity
observed.
This study had limitations. The absence of a group initiating
alternative ART regimens makes it difficult to differentiate
between the effects of PIs on SAT function and the effect of
sup-pressing HIV replication. In addition, the relatively advanced
immunosuppression of substudy subjects at baseline may have
contributed to an augmented ‘return to health’ phenomenon
that could differ from cohorts beginning ART at higher CD4
+
counts. However, our molecular and clinical data are consistent
with the findings of recent randomized studies that also
demon-strate generalized increases in adiposity in subjects of higher
base-line CD4
+ counts when initiating several types of tNRTI-sparing
ART.
45,46With follow-up limited to 24 weeks, SAT dysfunction
aris-ing from longer periods of PI exposure may not have been
detected. Despite this, PIs can induce adipocyte toxicity in vitro
after as little as 5 days of exposure
10and in vivo transcriptional
changes indicative of SAT toxicity have been demonstrated after
even shorter periods of ART exposure.
23,35While it may be argued
that these results may not apply to the PI class as a whole (only
two types of PI were examined), initiation of other commonly
used PIs, such as darunavir and atazanavir, has a similar effect
on body composition.
47Finally, study subjects were exclusively
Asian. Nevertheless, there is no reason to suggest that the effects
of PI on SAT would be markedly different in other patient groups.
In summary, the initiation of PI-only ART in this study
facili-tated an improvement rather than a deterioration in SAT function,
with the changes observed consistent with a return to health,
including increased adiposity, reduced levels of inflammation
and improved mitochondrial function in adipose tissue.
Acknowledgements
This work was presented in part at the Sixteenth International Workshop on Co-morbidities and Adverse Drug Reactions in HIV, Philadelphia, PA, USA, 2014 (Abstracts O02 and P02).
We thank the participants of the HIVNAT-019 study and the substudy participants in particular for their time and commitment to the study. We thank the HIVNAT-019 study team for their large contribution to and support of the study, especially Dr Anchalee Avihingsanon for her help with the database. We also would like to thank Dr Ferdinand Wit (Academic
Medical Center, Amsterdam) and Dr Willard Tinago (University College Dublin) for statistical advice, as well as Rube´n Cereijo (Universitat de Barcelona) for the protein work and Kerri Malone (University College Dublin) for proof-reading and comments prior to submission.
Additional members of the HIVNAT-019 Study Group
Saskia R. Autar, Jasper van der Lugt, Anchalee Avihingsanon, Supalak Klungklang and Sasiwimol Ubolyam.
Funding
This work was supported by grants from: the European AIDS Treatment Network (NEAT IG3); the Wellcome Trust (097424/Z/11/Z); Molecular Medicine Ireland; Science Foundation Ireland (09/RFP/BMT2461); and Instituto de Salud Carlos III (Spain), cofinanced by FEDER (PI14/00700 and PI14/00063). The original pharmacokinetic study was funded by Roche Pharmaceuticals.
Transparency declarations
J. C. has received research grants from ViiV Healthcare, Janssen and Merck, and has received honoraria as a speaker for or member of Advisory Boards for ViiV Healthcare, Gilead, MSD, Janssen, Chugai and Novartis. P. D. has received honoraria as a speaker for or member of Advisory Boards for Gilead Sciences, Bristol-Myers Squibb, Abbvie, ViiV Healthcare, Janssen-Cilag and Merck Sharp & Dohme, and has received research grants from Gilead Sciences, Abbvie, Boehringer Ingelheim, Pfizer Inc. and Janssen-Cilag. P. R. through his institu-tion has received independent scientific grant support from Gilead Sciences, Janssen Pharmaceuticals Inc., Merck & Co., Bristol-Myers Squibb and ViiV Healthcare. In addition, P. R. serves on a scientific advisory board for Gilead Sciences, he serves on a data safety monitoring committee for Janssen Pharmaceutica N.V. and he chaired a company-organized scien-tific symposium for ViiV Healthcare, for which his institution has received remuneration. P. W. G. M. reports grants and personal fees from Janssen-Cilag, grants from GlaxoSmithKline (Ireland), grants and personal fees from Gilead Sciences, grants and personal fees from Bristol-Myers Squibb, grants and personal fees from Merck and personal fees from ViiV, outside of the submitted work. All other authors: none to declare.
Author contributions
P. P., D. A. C. and J. M. A. L. conceived and designed the main study, contrib-uted to the substudy design and recruited patients to the study. J. C., P. R., P. D., M. G. and P. W. G. M. conceived and designed the substudy. R. T. M. conducted the gene expression experiments. E. R. F. collected the clin-ical data and performed the mtDNA experiments. E. C. and J. C. carried out the histological analysis. M. G. was responsible for the protein analyses. R. T. M. conducted the statistical analysis and wrote the manuscript. All authors critically reviewed and contributed to the final manuscript.
Supplementary data
Tables S1 to S3 are available as Supplementary data at JAC Online (http:// jac.oxfordjournals.org/).
References
1 Lake JE, Currier JS. Metabolic disease in HIV infection. Lancet Infect Dis 2013; 13: 964–75.
at UPMC on August 30, 2016
http://jac.oxfordjournals.org/
2 Rodger AJ, Lodwick R, Schechter M et al. Mortality in well controlled HIV in the continuous antiretroviral therapy arms of the SMART and ESPRIT trials compared with the general population. AIDS 2013; 27: 973–9. 3 Garrabou G, Lopez S, Moren C et al. Mitochondrial damage in adipose tis-sue of untreated HIV-infected patients. AIDS 2011; 25: 165–70. 4 Giralt M, Domingo P, Guallar JP et al. HIV-1 infection alters gene expres-sion in adipose tissue, which contributes to HIV-1/HAART-associated lipo-dystrophy. Antivir Ther 2006; 11: 729– 40.
5 Mallon PW, Miller J, Cooper DA et al. Prospective evaluation of the effects of antiretroviral therapy on body composition in HIV-1-infected men start-ing therapy. AIDS 2003; 17: 971–9.
6 Martin A, Smith DE, Carr A et al. Reversibility of lipoatrophy in HIV-infected patients 2 years after switching from a thymidine analogue to abacavir: the MITOX Extension Study. AIDS 2004; 18: 1029– 36. 7 Carr A, Samaras K, Burton S et al. A syndrome of peripheral lipodystro-phy, hyperlipidaemia and insulin resistance in patients receiving HIV prote-ase inhibitors. AIDS 1998; 12: F51– 8.
8 Moyle GJ, Baldwin C, Langroudi B et al. A 48-week, randomized, open-label comparison of three abacavir-based substitution approaches in the management of dyslipidemia and peripheral lipoatrophy. J Acquir Immune Defic Syndr 2003; 33: 22– 8.
9 Walker UA, Bickel M, Lutke Volksbeck SI et al. Evidence of nucleoside ana-logue reverse transcriptase inhibitor-associated genetic and structural defects of mitochondria in adipose tissue of HIV-infected patients. J Acquir Immune Defic Syndr 2002; 29: 117–21.
10 Capel E, Auclair M, Caron-Debarle M et al. Effects of ritonavir-boosted darunavir, atazanavir and lopinavir on adipose functions and insulin sen-sitivity in murine and human adipocytes. Antivir Ther 2012; 17: 549–56. 11 Caron M, Auclair M, Sterlingot H et al. Some HIV protease inhibitors alter lamin A/C maturation and stability, SREBP-1 nuclear localization and adipocyte differentiation. AIDS 2003; 17: 2437–44.
12 Leroyer S, Vatier C, Kadiri S et al. Glyceroneogenesis is inhibited through HIV protease inhibitor-induced inflammation in human subcutaneous but not visceral adipose tissue. J Lipid Res 2011; 52: 207–20.
13 Hresko RC, Hruz PW. HIV protease inhibitors act as competitive inhibi-tors of the cytoplasmic glucose binding site of GLUTs with differing affin-ities for GLUT1 and GLUT4. PLoS One 2011; 6: e25237.
14 Kim RJ, Wilson CG, Wabitsch M et al. HIV protease inhibitor-specific alterations in human adipocyte differentiation and metabolism. Obesity 2006; 14: 994–1002.
15 Lagathu C, Eustace B, Prot M et al. Some HIV antiretrovirals increase oxidative stress and alter chemokine, cytokine or adiponectin production in human adipocytes and macrophages. Antivir Ther 2007; 12: 489– 500. 16 Bastard JP, Caron M, Vidal H et al. Association between altered expres-sion of adipogenic factor SREBP1 in lipoatrophic adipose tissue from HIV-1-infected patients and abnormal adipocyte differentiation and insu-lin resistance. Lancet 2002; 359: 1026–31.
17 Chaparro J, Reeds DN, Wen W et al. Alterations in thigh subcutaneous adipose tissue gene expression in protease inhibitor-based highly active antiretroviral therapy. Metabolism 2005; 54: 561–7.
18 Kim MJ, Leclercq P, Lanoy E et al. A 6-month interruption of antiretro-viral therapy improves adipose tissue function in HIV-infected patients: the ANRS EP29 Lipostop Study. Antivir Ther 2007; 12: 1273–83.
19 World Medical Association. World Medical Association Declaration of Helsinki: ethical principles for medical research involving human subjects. JAMA 2013; 310: 2191–4.
20 van der Lugt J, Autar RS, Ubolyam S et al. Pharmacokinetics and short-term efficacy of a double-boosted protease inhibitor regimen in treatment-naive HIV-1-infected adults. J Antimicrob Chemother 2008; 61: 1145– 53.
21 Carr A, Workman C, Carey D et al. No effect of rosiglitazone for treat-ment of HIV-1 lipoatrophy: randomised, double-blind, placebo-controlled trial. Lancet 2004; 363: 429– 38.
22 Matthews DR, Hosker JP, Rudenski AS et al. Homeostasis model assessment: insulin resistance and beta-cell function from fasting plasma glucose and insulin concentrations in man. Diabetologia 1985; 28: 412 – 9.
23 Mallon PW, Unemori P, Sedwell R et al. In vivo, nucleoside reverse-transcriptase inhibitors alter expression of both mitochondrial and lipid metabolism genes in the absence of depletion of mitochondrial DNA. J Infect Dis 2005; 191: 1686– 96.
24 Feeney ER, van Vonderen MG, Wit F et al. Zidovudine/lamivudine but not nevirapine in combination with lopinavir/ritonavir decreases subcuta-neous adipose tissue mitochondrial DNA. AIDS 2012; 26: 2165– 74. 25 Guallar JP, Gallego-Escuredo JM, Domingo JC et al. Differential gene expression indicates that ‘buffalo hump’ is a distinct adipose tissue dis-turbance in HIV-1-associated lipodystrophy. AIDS 2008; 22: 575–84. 26 Benjamini Y, Hochberg Y. Controlling the false discovery rate: a practical and powerful approach to multiple testing. J R Statist Soc B 1995; 57: 289–300.
27 Dube MP, Komarow L, Mulligan K et al. Long-term body fat outcomes in antiretroviral-naive participants randomized to nelfinavir or efavirenz or both plus dual nucleosides. Dual X-ray absorptiometry results from A5005s, a substudy of Adult Clinical Trials Group 384. J Acquir Immune Defic Syndr 2007; 45: 508–14.
28 Picard F, Gehin M, Annicotte J et al. SRC-1 and TIF2 control energy bal-ance between white and brown adipose tissues. Cell 2002; 111: 931– 41. 29 Bao Y, Bing C, Hunter L et al. Zinc-a2-glycoprotein, a lipid mobilizing factor, is expressed and secreted by human (SGBS) adipocytes. FEBS Lett 2005; 579: 41– 7.
30 Noor MA, Parker RA, O’Mara E et al. The effects of HIV protease inhibitors atazanavir and lopinavir/ritonavir on insulin sensitivity in HIV-seronegative healthy adults. AIDS 2004; 18: 2137– 44.
31 Kim MJ, Jardel C, Barthelemy C et al. Mitochondrial DNA content, an inaccurate biomarker of mitochondrial alteration in human immunodefi-ciency virus-related lipodystrophy. Antimicrob Agents Chemother 2008; 52: 1670– 6.
32 Pace CS, Martin AM, Hammond EL et al. Mitochondrial proliferation, DNA depletion and adipocyte differentiation in subcutaneous adipose tis-sue of HIV-positive HAART recipients. Antivir Ther 2003; 8: 323– 31. 33 Jones SP, Qazi N, Morelese J et al. Assessment of adipokine expression and mitochondrial toxicity in HIV patients with lipoatrophy on stavudine-and zidovudine-containing regimens. J Acquir Immune Defic Syndr 2005; 40: 565–72.
34 Vidal F, Domingo P, Villarroya F et al. Adipogenic/lipid, inflammatory, and mitochondrial parameters in subcutaneous adipose tissue of untreated HIV-1-infected long-term nonprogressors: significant altera-tions despite low viral burden. J Acquir Immune Defic Syndr 2012; 61: 131–7.
35 Egana-Gorrono L, Martinez E, Domingo P et al. Differential subcutane-ous adipose tissue gene expression patterns in a randomized clinical trial of efavirenz or lopinavir-ritonavir in antiretroviral-naive patients. Antimicrob Agents Chemother 2014; 58: 6717– 23.
36 Haubrich RH, Riddler SA, DiRienzo AG et al. Metabolic outcomes in a randomized trial of nucleoside, nonnucleoside and protease inhibitor-sparing regimens for initial HIV treatment. AIDS 2009; 23: 1109– 18. 37 Valantin MA, Kolta S, Flandre P et al. Body fat distribution in HIV-infected patients treated for 96 weeks with darunavir/ritonavir mono-therapy versus darunavir/ritonavir plus nucleoside reverse transcriptase inhibitors: the MONOI-ANRS136 substudy. HIV Med 2012; 13: 505–15.
Effect of PI-only ART initiation on adipose tissue
JAC
at UPMC on August 30, 2016
http://jac.oxfordjournals.org/
38 Woerle HJ, Mariuz PR, Meyer C et al. Mechanisms for the deterioration in glucose tolerance associated with HIV protease inhibitor regimens. Diabetes 2003; 52: 918– 25.
39 Randell PA, Jackson AG, Boffito M et al. Effect of boosted fosamprenavir or lopinavir-based combinations on whole-body insulin sensitivity and lipids in treatment-naive HIV-type-1-positive men. Antivir Ther 2010; 15: 1125–32. 40 Blumer RM, van Vonderen MG, Sutinen J et al. Zidovudine/lamivudine contributes to insulin resistance within 3 months of starting combination antiretroviral therapy. AIDS 2008; 22: 227–36.
41 Suliman HB, Carraway MS, Welty-Wolf KE et al. Lipopolysaccharide sti-mulates mitochondrial biogenesis via activation of nuclear respiratory factor-1. J Biol Chem 2003; 278: 41510– 8.
42 Than TA, Lou H, Ji C et al. Role of cAMP-responsive element-binding pro-tein (CREB)-regulated transcription coactivator 3 (CRTC3) in the initiation of mitochondrial biogenesis and stress response in liver cells. J Biol Chem 2011; 286: 22047–54.
43 UN Joint Programme on HIV/AIDS (UNAIDS). UNAIDS Strategy 2016-2021. On the Fast-Track to End AIDS. http://www.unaids.org. 44 Arribas JR, Doroana M, Turner D et al. Boosted protease inhibitor mono-therapy in HIV-infected adults: outputs from a pan-European expert panel meeting. AIDS Res Ther 2013; 10: 3.
45 McComsey GA, Moser C, Currier J et al. Body composition changes after initiation of raltegravir or protease inhibitors: ACTG A5260s. Clin Infect Dis 2016; 62: 853–62.
46 Rockstroh JK, Lennox JL, Dejesus E et al. Long-term treatment with ral-tegravir or efavirenz combined with tenofovir/emtricitabine for treatment-naive human immunodeficiency virus-1-infected patients: 156-week results from STARTMRK. Clin Infect Dis 2011; 53: 807– 16.
47 Moyle GJ, Hardy H, Farajallah A et al. Comparison of body composition changes between atazanavir/ritonavir and lopinavir/ritonavir each in com-bination with tenofovir/emtricitabine in antiretroviral-naive patients with HIV-1 infection. Clin Drug Investig 2014; 34: 287– 96.
at UPMC on August 30, 2016
http://jac.oxfordjournals.org/